


Services on Demand
Article
 English (pdf)
 Article in xml format
 Article references
Indicators

Related links
-
 Cited by Google
 -
 Similars in Google
Share

 Permalink
Clean Air Journal
On-line version ISSN 2410-972X
Print version ISSN 1017-1703
Clean Air J. vol.28 n.1 Pretoria 2018
http://dx.doi.org/159/2410-972x/2018/v28n1a9
RESEARCH ARTICLE
An economic assessment of SO2 reduction from industrial sources on the highveld of South Africa
Marilize SteynI; Gerrit KorneliusII
IEnvironmental Engineering Group, Department of Chemical Engineering, University of Pretoria, Pretoria, South Africa. marilizeg@gmail.com
IIEnvironmental Engineering Group, Department of Chemical Engineering, University of Pretoria, Pretoria, South Africa. Gerrit.Kornelius@up.ac.za
ABSTRACT
The costs and benefits associated with the implementation of an SO2 point source standard for solid fuel combustion installations (Category 1.1 sources, National Environmental Management: Air Quality Act: s21 List of Activities 2013) were evaluated to assess the desirability of implementation of the standards from an environmental as well as economic point of view. The study used a bottoms-up or impact pathway approach to analyse the impact of emission reduction. To reach the new plant (2020) SO2 emission standard of 500 mg/Nm3, the installation of wet flue gas desulfurisation (FGD) is the likely technology as it is a widely installed and well-developed technology. Costs and benefits associated with the installation of FGD were identified and ranked into four categories, based on the expected impact and the availability of information. All costs and benefits that could be quantified and monetized (Category 1 impacts) were included in the evaluation. A sensitivity analysis was conducted on the costs and benefits with the largest impact on NPV (net present value) or the largest uncertainty associated with the calculation to determine a range of feasible values. Site specific information was used where available, supplemented by benefit transfer where local data was not available. The impact on premature adult mortality was found to be the most significant benefit and dependent on the concentration response function selected and sensitive to the VSL (value of statistical life) estimate used (high R115 billion; low R36 billion). The choice of appropriate concentration response functions and the applicability thereof in the South African context are important considerations, likely requiring further study. The capital cost of FGD installations was found to be the most significant cost and was sensitive to the evaluation method (central R187 bil; high R306 bil; low R80 bil). Failure to account for operating costs would significantly impact the economic evaluation. The results of the study indicate that, given the information currently available, it is unlikely that the benefit of reducing SO2 emissions from existing sources to the required standard outweighs the cost of implementation on the Mpumalanga Highveld.
Keywords: cost benefit analysis, flue gas desulfurisation, Mpumalanga Highveld, sulfur dioxide
Introduction
Air quality management in South Africa has undergone significant legislative reform in recent years. The National Environmental Management: Air Quality Act 39 was promulgated in 2005 and makes provision for various instruments to improve ambient air quality. One such instrument is minimum emission standards (MES) for industrial point sources. In setting the standards, the costs of compliance and expected ambient benefit of compliance were only indirectly assessed. Subsequent to the promulgation of the standards, various industries have indicated that not all of the standards were feasible through various applications for the postponement of these standards.
The purpose of the investigation was to assess the desirability of implementation of one of these standards from an environmental as well as economic point of view. The research assessed compliance with the Category 1.1 standards for SO2 emissions (DEA, 2013) as the majority of installations falling into this category have indicated that compliance with the SO2 emission standard will not be achieved within the required timeframe.
A review of environmental evaluation techniques was done in order to determine the most appropriate method to assess the economic desirability of the legislation, taking into consideration the expected benefit of implementation as well as the costs and impacts of implementing the required abatement technology to reach the standards.
Methodology
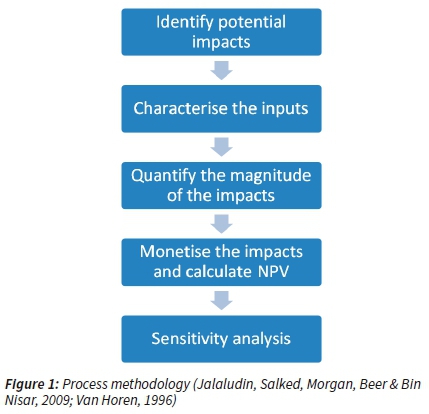
The study used a bottom-up or impact pathway approach to analyse the impact of emission reduction. The costs and benefits associated with the implementation of an SO2 point source standard of 500 mg/Nm3 for solid fuel combustion installations (Category 1.1 sources) was evaluated to determine the net present value of SO2 regulation on the Mpumalanga Highveld of South Africa. All category 1.1 sources operational at the time of study within the study area expected to have a significant impact on ambient SO2 concentrations were included in the study.
Since wet FGD is a widely installed and well-developed technology (Srivastava, 2000), it is likely that this will be the technology of choice for power generation facilities. Eskom notes in their postponement application that wet FGD is their technology of choice for SO2 reduction (Eskom, 2014) and impacts related to wet FGD were therefore used in the study. The process flow methodology is shown in Figure 1.
Externalities were identified and classified as follows, based on the expected benefit and availability of information:
Class 1 externalities: Sufficient information exists to quantify and assign a cost to the externality.
Class 2 externalities: Insufficient data exists to quantify the externalities, but the externality can potentially be significant.
Class 3 externalities: Sufficient information exists to quantify the externality, but insufficient information exists to assign a cost.
Class 4 externality: The externality is expected to have an
insignificant impact on the outcome of the study or the cost is already internalized.
Externalities related to coal mining and electricity generation are not included in this study, as the study aims to only quantify the impact of reducing SO2 emissions from these facilities in accordance with the requirements of the MES.
While the methodology followed is widely used and well documented, uncertainty is introduced into the evaluation at each step of the analysis, requiring assumptions to be made which could significantly impact the result of the economic analysis. To a certain extent, uncertainties can be lessened by well-considered and valid assumptions and further reduced by sensitivity analysis, yielding a range of potential values that could realise for sensitive inputs. A sensitivity analysis was conducted on the costs and benefits with the largest impact on NPV or the largest uncertainty associated with the calculation to determine a range of feasible values. Site specific information was used where available, supplemented by benefit transfer where local data was not available.
Evaluation of Cost
Capital Cost
The costs associated with FGD include capital cost, lime or limestone costs, cost of additional water, additional electricity usage and greenhouse gas emissions.
The installation of FGD will require direct capital cost. FGD has been widely installed internationally and capital cost estimates based on actual costs are available in literature (World Bank, 1999; Orfanoudakis, Vakalis, Krallis, Hatzaipostolou & Vlachakis, 2005; Cleetus, 2012). Eskom provided reviewed cost estimates for the installation of FGD in their postponement report (Eskom, 2014), which was used as the central estimate.
The direct capital cost estimates per kW were adjusted to the base year (2020) and compared for consistency. The time-adjusted Eskom estimate is R5950/kW, which is above the mean World Bank estimate of R4664/kW and lower than the EPA estimate of R7393/kW. The Eskom estimate was used as the mean as it is based on local conditions and is comparable to the international literature. The total capital cost was calculated using the kW output of each facility and assumes capital spend at the base year (2020). The overall calculated direct capital cost was R187 billion (2020 costs) for all the Eskom stations currently in operation within the study area as well as the Sasol facility at Secunda.
Water Cost
The operation of FGD on all the facilities will require an estimated 98 million m3 of water per annum (Sasol, 2014; Eskom, 2014). The most likely adequate source of additional water for the Vaal River system is the Lesotho Highlands Phase 2 (LHP2) Project. A study by Basson, Combrinck, Schroder and Rossouw (2010) calculated the cost of water from LHWP Phase 2, including royalties, at 6.14 R/m3 of raw water. This cost was used to calculate the costs of additional water supply as it takes the capital cost and operating costs of providing the additional water into consideration. The estimated total cost of providing water was calculated as R 32 billion (present value 2020) over the lifetime of the facilities (up to 2050).
Lime Cost (Direct)
The quantity of lime required for the operation of FGD was quoted by Sasol and Eskom in their respective postponement applications. Sasol requires approximately 180 000 tons of lime per annum, while Eskom will require an estimated 5 000 000 tonnes per annum of lime (Sasol, 2014; Eskom, 2014). Limestone consumption for the production of lime varies with limestone properties, end-product specification, limestone purity, etc, but generally two tons of limestone are required for each ton of lime produced (DME, 2005). The limestone price was calculated using the aggregate production and sales values obtained from the Department of Mineral Resources (SAMI, 2005). The cost calculated was R176/ton (2020 prices) and excludes any transport and handling costs. The transport cost to the facilities was taken as 70% of the supplied price (DME, 2005), increasing the cost of limestone to R300/ton. The cost for limestone was calculated as R63 billion over the study period.
Waste Disposal Cost
It was assumed that the waste generated would be disposed of in a similar manner to fly ash currently, that the ash-handling system was in place and significant upgrades to the existing systems were not required, due to the relatively small volume of additional waste compared to current fly ash volumes. The additional waste stream was estimated to be 350 000 tons per annum for Sasol (Sasol, 2014) and 9 500 000 tons per annum for Eskom (Eskom, 2014).
To calculate the average cost of disposal on a compliant waste disposal facility, the cost and volume of the proposed Kusile disposal facility (Dhemba, 2014) was used to calculate a disposal cost per ton based on the cost of the facility and the capacity. This value was used as it is indicative of the capital costs of providing an on-site facility for the disposal of the waste, assuming that current waste disposal facilities are compliant or that additional complaint facilities will be required to address the additional load. No costs for rehabilitation of the waste management facilities or operational costs of the facilities were taken into consideration. The cost calculated for disposal was R11 billion over the study period.
Electricity and additional CO2 cost
The efficiency of generation units will be reduced with the installation of FGD due to the increased power consumption of the FGD units and auxiliary equipment. This decrease in efficiency will have an impact on the greenhouse gas emission intensity of the unit. Energy consumption for wet limestone FGD is approximately 2% of the net generating capacity of the unit prior to the addition of abatement equipment (Srivastava, 2000). CO2 emissions will also increase due to the chemical reaction between the limestone and the SO2 (SO2 + CaCO3 -- CaSO4 + CO2). The amount of additional CO2 generated can therefore be quantified; however due to the relatively small percentage of the total greenhouse gas emissions and significant uncertainties associated with the monetization of the impacts, this impact is considered a Class 3 impact for the purposes of this study.
Evaluation of Benefits
The expected benefits associated with the reduction of SO2 include health benefits (mortality and morbidity), impact on ecosystems and water resources due to acid deposition, impact on vegetation through respiration, impact on structures and visibility impacts.
Impact on soils
Although acid deposition can be quantified, the impact thereof on ecosystems has not been quantitatively proven (Josipovic, Annegarn, Kneen, Pienaar & Piketh, 2011). It is possible that a reduction in deposition would result in increased biodiversity, as has been the case in the United States and Europe (NAPAP, 2005; EEA, 2014). It should be noted that, due to the long-term impact of deposition and the high deposition rates in South Africa, this impact is potentially significant and should be included in similar analyses as soon as sufficient information is available. At present, there is not sufficient information available to quantify and assign a monetary value to the impact and this impact is therefore classified as a Class 2 impact.
Impact on vegetation
A number of studies (Scorgie & Thomas 2006, Josipovic, Annegarn, Kneen, Pienaar & Piketh 2009) found exceedances of the UNECE-CLRTAP Lichen standard of 10 ug/m3 and of the EC standard for forest and (semi)-natural vegetation across large portions of the Highveld due to SO2 emissions from power generation facilities. The actual impact on ecosystems cannot at this stage be accurately quantified due to a lack of quantifiable damage functions. This impact is therefore classified as a Class 2 impact.
Impacts on buildings, materials and visibility
Although the potential negative impact of SO2 ambient concentrations on structures, monuments and corrosion is recognised, there is insufficient information available to quantify this impact and it is therefore classified as a Class 2 impact.
Visibility may be impaired by natural sources such as water vapour and natural dust as well as by anthropogenic emissions (Van Horen, 1996). The high degree of uncertainty as well as the non-transferability of the valuations done elsewhere means that visibility impacts are considered to be Class 3 impacts for the purposes of this study.
Health impacts
Epidemiological studies are often used to evaluate the increased risk due to air pollution, as the studies evaluate the impact on humans in real-world conditions (WHO, 2000). Concentration response functions that relate changes in concentration to increased risk are derived from epidemiological studies. Two types of epidemiological studies are commonly employed. Cohort studies are long term studies that follow study subjects to relate exposure status to a health outcome by means of a relative risk (RR). Confounders can be more easily controlled for; such studies are however conducted over long time periods and have significant costs. Two such large studies have been conducted, one by the American Cancer Society (ACS study) (Pope, Burnett, Thun, Calle, Krewski, Iyo & Thurston, 2002; Krewski, Jerret, Burnett, Ma, Hughes, Shi, Turner, Pope, Thurston, Calle & Thun, 2009) and the Harvard Six Cities study (Dockery, Pope, Xu, Spengler, Ware, Fay, Ferris & Speizer, 1993; Krewski, Burnett, Goldberg, Hoover, Siemiatycki, Abrahamowicz, White & Others, 2000). Both studies indicated increased mortality associated with air pollution.
Time-series studies correlate the incidence of health outcomes, such as mortality or hospital admissions with fluctuation in daily pollutant values to establish an increased percentage of adverse health outcomes for a certain change in ambient pollutant concentrations. As time-series studies are easier and less cost intensive, many more of these studies have been conducted world-wide. Several meta-analyses using data from different studies have also been conducted. Detailed analyses of these studies have been conducted as part of European and US health reviews (US EPA, 2004). Two large time-series studies aimed at investigating the short-term impact of pollution are the NMMAPS (National Morbidity, Mortality and Air Pollution Study) in the United States and the APHEA 1 and APHEA 2 (Air Pollution and Health: a European Approach) studies (Sunyer, Atkinson, Ballester, Le Terte, Ayres, Forastiere, Forsburg, Vonk, Bisanti, Anderson, Schwartz & Katsouyanni, 2002, Sunyer, Ballester, Le Terte, Atkinson, Ayres, Forastiere, Forsburg, Vonk, Bisanti, Tenias, Medina, Schwartz & Katsouyanni, 2003; Dominici, McDermot, Daniels, Zeger & Samet, 2003). The impacts of air pollutants on health were extensively reviewed by the Quantification of the Effects of Air Pollution on Health in the United Kingdom (COMEAP) and a series of concentration response coefficients was produced (Stedmann, Linehan & King 1999; Ayres 2009). As part of the REVIHAAP (Review of evidence on health aspects of air pollution) project (WHO, 2013), the latest available studies on the health impacts of air pollution were reviewed in order to answer questions related to air-quality policies in Europe. A study by Atkinson, Mills, Walton and Anderson (2014) reviewed epidemiological time-series studies investigating the association between mortality and hospital admissions and fine particle components. In order to better understand the health impacts of pollution in Asia, the Health Effects Institute initiated the Public Health and Air Pollution (PAPA) programme in 2002 (Anderson, Atkinson, Balbus, Brauer, Chapman, Chowdury, Cohen, Demerijan, Ebi, Favarato, Greenbaum, Mehta, North, O'Keefe, Pandey, Pope, Smith, Speizer, Walsh & Zhang, 2010).
The only South African study found that derived concentration-response functions for air pollutants is a study by Wichmann and Voyi (2012), investigating the association between ambient daily concentrations of PM, SO2 and NOx and respiratory, cardiovascular and cerebrovascular mortality in the city of Cape Town. The study found associations between the criteria pollutants and increased mortality.
In order to reduce city-specific influences, it is preferable to use multi-city, cohort studies for mortality estimates as cohort studies capture specific information of the study population to limit bias. The largest of these studies is the ACS study (Pope et al., 2002) which included the most participants and ambient stations in the analysis (with 552 138 adults using data from 151 monitoring stations). The study data was reanalysed by the Health Effects Institute (HEI) and found to be of high quality (Krewski et al., 2009). The reanalysed data was therefore used for adult mortality calculation. As these studies were conducted in a developed country (United States), a sensitivity analysis was conducted using concentration response functions calculated by Wichmann and Voyi (2012) for South Africa and data from PAPA (Anderson et al., 2010) calculated for Asian countries. To evaluate child mortality, the data from the ACS study is not appropriate, as the study subjects were all adults (Ostro, 2004). The concentration-response function derived in the Lin, Pereira, Nishioka, Concecao, Braca and Saldiva (2004) study was used, as the study was conducted in an area with relatively higher SO2 ambient concentrations. In order to determine the morbidity impacts, COMEAP data for SO2 respiratory hospital admissions was used (Ayres, 1998). For morbidity impacts of sulfates, the information contained in Atkinson et al. (2014) is a recent and comprehensive review of the available information on fine particulate components and health and will therefore be used. The study by Pikhart, Bobak, Gorynski, Wotyniak, Danova, Celko, Kriz, Briggs and Elliot. (2005) was used to quantify asthma risk.
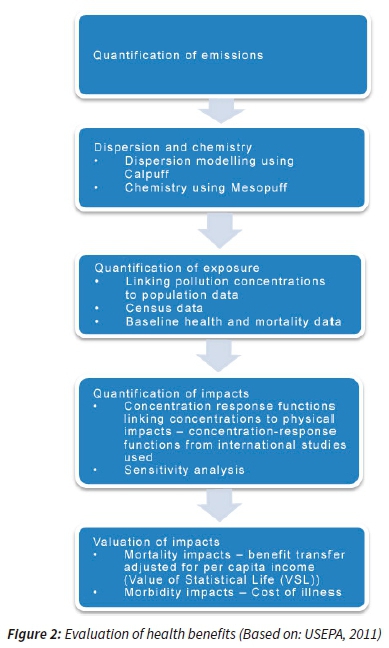
The methodology followed for calculating health benefits is shown in Figure 2. The final dose-response functions, as well as the baseline mortality and morbidity values used are given in tables 1 to 3 overleaf.
Dispersion modelling
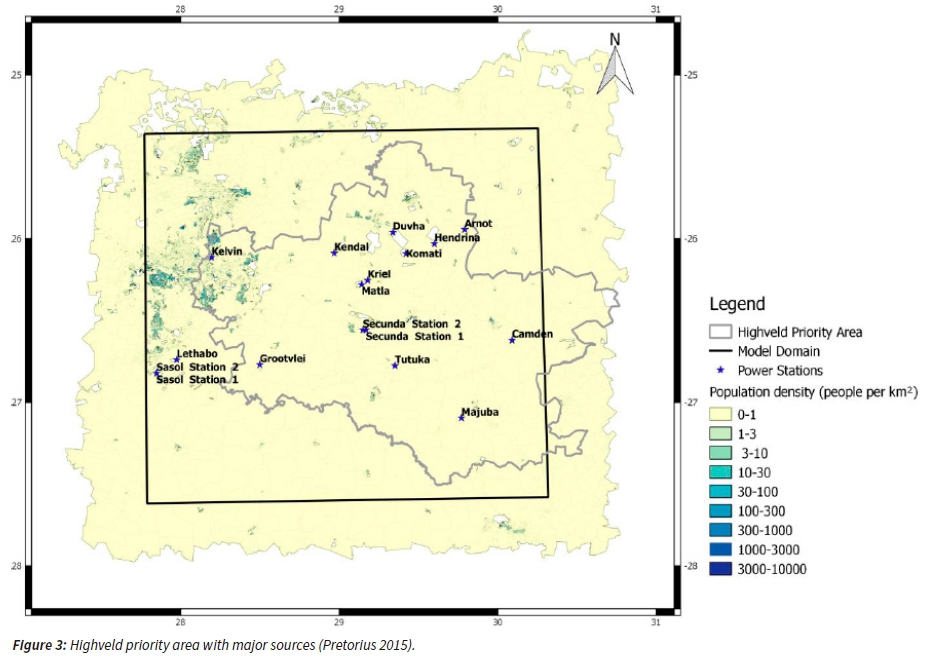
The study area was taken as the Highveld priority area, as this is where most coal-fired power stations are located. The study area, location of sources population density used in the study are shown in Figure 3 below. The Sasol 1 and 2 stations and the Kelvin station (western border of the study area) were not included.
The South African dispersion modelling regulations (DEA 2014, Government Notice 533) were consulted to guide model selection for the study. Calpuff was selected for the dispersion modelling as the model can handle calm conditions often experienced on the Highveld. The model is further recommended for longrange transport (>50 km) and for multiple sources (National Environmental Management: Air Quality Act: Regulations regarding air dispersion modelling 2014). Furthermore, the model includes chemical transformation. This is important for the study as SO2 reacts in the atmosphere to form sulfates, which must be accounted for in the study (refer to Health impacts on page 25). A full photochemical model was not used due to data limitations.
The model was run for the period 2010 to 2012 to provide a three-year view of the expected changes in ambient concentrations. A meteorological data file compiled using Calmet was used in the study. The meteorological data was obtained using MM5 (Fifth-Generation NCAR/Penn State Mesoscale Model) data tiles supplemented by surface station data from three ambient monitoring stations (Bosjesspruit, Sasol Club and Langverwacht stations). The meteorological file extended over the Highveld study area with a grid resolution of 1 km and 10 vertical layers. In the absence of measured upper air data, MM5 data provides a modelled approximation. As the benefit calculation uses the difference in concentrations modelled under baseline conditions and compliance conditions, the impacts of model uncertainty is reduced.
For the Calpuff model a grid resolution of 1 km was used. Chemical transformations were modelled using the Mesopuff II chemical transformation model, included in the Calpuff model. The Mesopuff II scheme takes the impact of relative humidity into consideration, with higher conversion rates from SO2 to sulfates at higher relative humidity, whereas in the RIVAD scheme, the transformation is linear (Scire, Strimaitis and Yamartino 2000). The RIVAD scheme is recommended for rural modelling as it assumes low background VOC concentrations (Scire et al 2000), which is not a valid assumption over the entire modelling domain (Sasol 2014). Therefore, to ensure that the impact of secondary particulates in the form of sulfates is adequately considered, the Mesopuff II scheme was selected for this model. Ambient ozone and ammonia data from three monitoring stations was used as an input to the chemical transformation model. Wet and dry deposition was included in the model. Due to the height of the stacks, building downwash effects were not taken into consideration.
Additional discreet receptors were included in the simulation model to obtain exposure data at residential areas and monitoring stations. Model output hourly, daily and annual data was extracted from the dispersion modelling results at each receptor.
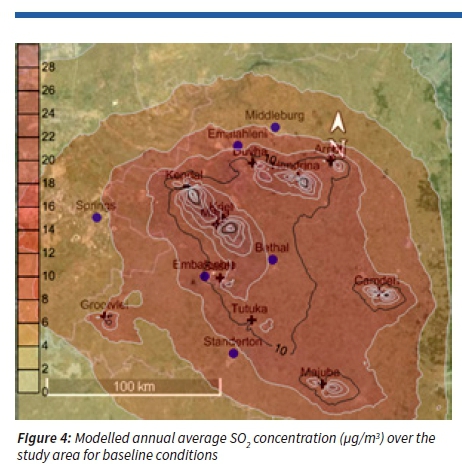
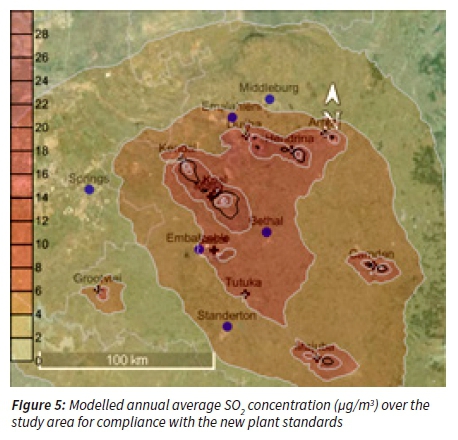
The modelling results for the annual average SO2 concentrations for the baseline and compliance scenarios are shown in Figures 4 and 5.
Discussion
In the evaluation of costs and benefits, 2020 was used as the base year for all calculations, based on the timeframe in which the requirements for existing plants to reach new plant standards comes into effect. The study further assumes that all retrofits could be completed by 2020, with water supply and lime supply infrastructure in place. This assumption ensures that the maximum benefit intended resulting from the regulations is accounted for. The study area was taken as the Highveld priority area, as this is where the majority of coal-fired power stations are located. Costs and benefits were escalated to adjust for inflation.
The timeframe of the study was taken as 30 years, ending 2050, when all the currently operating (2015) existing facilities are planned to reach end of life. It was assumed that the plants would be decommissioned according to schedule and that their lifetime will not be extended. The decommissioning dates were taken from Eskom and Sasol's postponement applications (Eskom, 2014; Sasol, 2014). Costs and benefits were only calculated for the remaining life of each facility.
Calpuff was selected for the dispersion modelling as the model includes chemical transformation and can handle calm conditions often experienced on the Highveld. The model is recommended for long-range transport (>50 km) and for multiple sources (DEA 2013b). A full photochemical model was not used due to data limitations. The model was run for the period 2010 to 2012 to provide a three-year view of the expected changes in ambient concentrations.
Additional discreet receptors were included in the simulation model to obtain exposure data at residential areas and monitoring stations. Model output hourly, daily and annual data was extracted from the dispersion modelling results at each receptor.
The methodology for the health impact assessment was as follows:
-
The changes in ambient concentration of SO2 and sulfates between the baseline (current operations) and compliance scenario (emissions at 500 mg/Nm3) were extracted from the dispersion modelling results for short-term (daily average) and long-term (annual average) impacts.
-
Population data at each receptor point was obtained from the 2010 census data. Population data was aggregated according to age brackets (children under five, youth under 30, adults above 30 years of age and elderly over the age of 55).
-
Population data was overlaid on the dispersion modelling results and health impacts were calculated using concentration response functions.
-
Baseline mortality data for South Africa was obtained from publications by Statistics South Africa (StatsSA, 2013) as well as from the World Health Organization (WHO, 2014).
-
Baseline morbidity data for South Africa was obtained from the South African Department of Health, Health and Demographic Survey (SADHS 2003) and the Chronic Disease of Lifestyle in South Africa Study (Ehrlich & Jithoo, 2006). Baseline hospital admissions were calculated using data from the HASA Study (Da Costa, 2009)
The WHO-recommended methodology (Ostro, 2004) was used to calculate the mortality and morbidity impacts. Various studies have shown that the use of threshold values have a significant impact on the outcome (Rowe, Lang, Chesnut, Latimer, Rae, Bernow & White, 1995). Therefore, to conservatively estimate health impacts, no thresholds were used. As was the approach by Rowe et al. (1995), a linear approximation to non-linear concentration-response values was used.
Adjusting the United States Value of Statistical Life (VSL) (Viscusi & Aldy, 2002), a VSL of R53 million (2020) was calculated. The income elasticity was taken as 1 to obtain a high estimate.
The data obtained from the Medscheme information (FRIDGE 2004) was used as a high estimate of healthcare costs and the data obtained from the Western Cape Government: Department of Health (2014) was used as a low estimate.
Results
The results of the analysis at a zero discount rate are shown in Table 5.
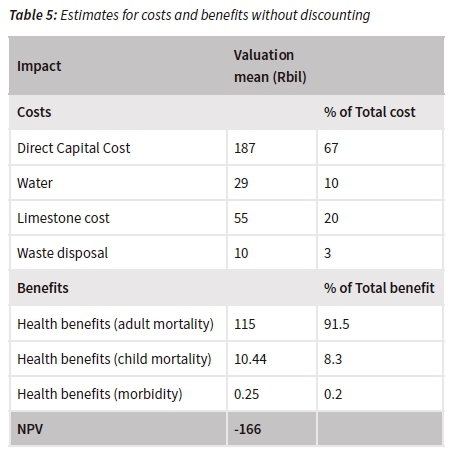
The results indicate a nett negative NPV of R 166 billion, calculated using the high estimate for benefits and the central estimate for costs.
On the cost side, the most significant cost was the capital cost at 67% of the total. Cumulative operating costs, including water, lime and waste disposal costs, were calculated at R94 billion.
The most significant benefit calculated was the reduction in premature adult mortality of R115 billion, which accounts for 91.5 % of the total benefit.
In order to determine whether partial implementation of FGD would be feasibly, the analysis was repeated on the single station with the highest health cost impact. The analysis indicates that the most significant impact is from the Kendal power station, with approximately 25% of the total mortality benefit attributable to the single station. The results of the analysis indicate that, when using the central estimate for capital cost and the high estimate for mortality benefits, the costs exceed the benefits for all discount rates for the Kendal station, largely due to the high capital cost of FGD implementation (low and high estimates from -R17 billion to -R5 billion).
Sensitivity Analysis
Due to the significant impact, sensitivity analyses were conducted on the capital cost, mortality benefit and discount rate used. The high capital cost estimate was calculated using the data from Cleetus et al. (2012) and the low estimate using Orfanoudakis et al. (2005). The range of calculated direct capital cost was R306 billion to R80 billion) for all the Eskom stations that are currently in operation within the study area, as well as the Sasol facility. The capital cost estimate had a large impact on the NPV with low and high estimates for capital costs 57% lower and 63% higher respectively than the central estimate.
The largest benefit calculated was associated with the reduction of mortality risks (91.5 % of total benefit). Due to the large number of uncertainties associated with the evaluation of mortality benefits, sensitivity analyses were conducted on various inputs into the calculation. The parameters selected for sensitivity analysis were the choice of concentration response functions used and the monetisation of the benefit (VSL estimates).
The associated health benefit associated with SO2 mortality impacts calculated using the base data was R50 billion, compared to the Asian estimate of R26 billion and the South African estimate of R53 billion for the SO2 only impact. The choice of concentration-response function and VSL estimate used were shown to have a large impact on the results and sensitivity analysis is recommended to obtain a range of estimates, as shown in Figure 3.
The use of a discount rate in this case was found to have a limited impact, as the operating costs (R94 billion) and health benefits (R115 billion) are of the same order of magnitude and occur over the same time period (annually from 2020 to 2050). The discount rate is expected to have a much more significant impact if costs and benefits occur at different times, for example a large capital expenditure to realise a long-term benefit. The calculation of the benefits are sensitive to the discount rate, with the NPV of the adult mortality benefit decreasing from R115 billion at 0% discount to R77.2 billion at 3 % discount and R46 billion at 8% discount.
Conclusions and Recommendations
The results of the study indicate that costs of the implementation of the category 1.1 new plant (2020) SO2 standard exceed the likely quantifiable benefits due to the high capital and operating cost associated with the implementation of FGD. The analysis indicated that operating costs are a significant input and exclusion of these costs will undervalue the true implementation cost.
The study evaluated mortality benefits in terms of VSL, as it is a widely used methodology. The results indicate that the choice of VSL estimate has a significant impact on the mortality benefit. VSL estimates obtained from first-world studies may not be appropriate in the South African context and could overestimate the price an individual is willing to pay for a small reduction in premature mortality risk. A standardised South Africa-specific approach to VSL (or alternatively the Value of a Life Year) would ensure that air quality-related CBAs have comparable results. Due to the uncertainty regarding the applicability of health related data derived in other parts of the world, sensitivity analysis using various concentration response functions is required.
The ecological impact of acid deposition could potentially be significant on the Highveld. Further study to apply international experience with improved ecosystem functioning resulting from pollution reduction initiatives, is required.
The impact of the regulation on the broader economy has not been taken into consideration in this study. Many factors will influence the total economic impact, including the opportunity cost of the capital spend and the impact of increased electricity tariffs due to increased cost of production. In this case, the basic financial CBA already indicates that it is unlikely that the benefits of regulation outweigh the costs.
The evaluation of costs and benefits are estimates based on the best available information and are most useful in informing decision making, prioritisation of initiatives and for illustrating the potential benefits of trade-offs. The results of the study indicate that, given the information currently available, it is unlikely that the benefit of reducing SO2 emissions from existing facilities to the required standard outweighs the cost of implementation on the Mpumalanga Highveld.
References
Anderson HR, Atkinson R, Balbus J, Brauer M, Chapman R, Chowdhury Z, Cohen A, Demerjian KL, Ebi K, Favarato G, Greenbaum DS, Mehta S, North T, O'Keefe RM, Pandey KD, Pope CA, Smith KR, Speizer F, Walsh M and Zhang J (2010) Outdoor air pollution and health in the developing countries of Asia: a comprehensive review. Special Report 18, Health Effects Institute, Boston, Massachusetts. November 2010. [ Links ]
Atkinson RW, Mills IC, Walton HA and Anderson HR (2014) 'Fine particle components and health - a systematic review and meta analysis of epidemiological time series studies of daily mortality and hospital admissions', Journal of Exposure Science and Environmental Epidemiology, vol. 25, no. 2, pp. 208-214. [ Links ]
Ayres JG (2009) Long term exposure to air pollution: effect on mortality, A report by the Committee on the Medical Effects of air pollution. [ Links ]
Basson MS, Combrinck A, Schroder JH and Rossouw JD (2010) Assessment of the ultimate potential and future marginal cost of water resources in South Africa, Directorate: National Water Resource Planning, Department of Water Affairs, South Africa, Report No: P RSA 000/00/12610 [ Links ]
Cleetus R (2012) EPA Power Plant Standards: A Powerful Catalyst for Modernizing our Electric System, A Union of Concerned Scientists Background Paper, March 2012. [ Links ]
Da Costa M (2009) Private Hospital Review 2009, Hospital Association of South Africa. [ Links ]
Department of Environmental Affairs and Tourism (DEA 2004) National Environment Management: Air Quality Act, 2004, Act No. 39 of 2004. [ Links ]
Department of Environmental Affairs (DEA 2013) National Environmental Management: Air Quality Act (39/2004): List of Activities which result in atmospheric emissions which have or may have a significant detrimental effect on the environment, including health, social conditions, economic conditions, ecological conditions or cultural heritage. Government Notice 893 of 2013 [ Links ]
Department of Environmental Affairs (DEA 2013b) National Environmental Management: Air Quality Act (39/2004): Regulations regarding air dispersion modelling. Government Notice 533 of 2014 [ Links ]
Department: Minerals and Energy (DME 2005) Dolomite and Limestone in South Africa: Supply and Demand, Report R49/2005. [ Links ]
Dhemba N (2014) Integrated Waste Management Licence Application for the Kusile Coal Fired Power Station, Draft Environmental Impact Assessment Report. (Ref. No. 14/12/16/3/3/3/51) [ Links ]
Dockery DW, Pope CA, Xu X, Spengler JD, Ware JH, Fay, ME, Ferris, BG and Speizer, FE (1993) 'An association between air pollution and mortality in six US cities', New England Journal of Medicine, vol. 329, pp 1753-1759. [ Links ]
Dominici F, McDermot A, Daniels M, Zeger SL and Samet JM (2003) Revised analysis of the National Morbidity, Mortality and Air Pollution Study: Mortality among residents of 90 cities, Health Effects Institute Special Report. [ Links ]
Ehrlich R and Jithoo A (2006) Chronic diseases of lifestyle in South Africa since 1995 - 2005, Chapter 11: Chronic Respiratory Diseases in South Africa, Chronic Diseases of Lifestyle Unit, Medical Research Council Technical Report, May 2006. [ Links ]
Eskom (2014) Applications for postponement of the Minimum Emissions Standards (MES) for Eskom's Coal and Liquid Fuel-Fired Power Stations, February 2014. [ Links ]
European Environment Agency Technical Report No 11/2014 (EEA 2014) Effects of air pollution on European ecosystems: Past and future exposure of European freshwater and terrestrial habitats to acidifying and eutrophying air pollutants. [ Links ]
FRiDGE (2004) Bentley West Management Consultants (Pty) Ltd and Airshed Planning Professionals (Pty) Ltd: Study to examine the potential socio-economic impact of measures to reduce air pollution from combustion, Final Report for the Fund for Research into Industrial Development Growth and Equity (FRIDGE), NEDLAC Trade and Industry Chamber. [ Links ]
Jalaludin B, Salked G, Morgan G, Beer T and Bin Nisar Y (2009) A methodology for cost benefit analysis of ambient air pollution health impacts, Australian Government Department of the Environment, Water, Heritage and the Arts through the Clean Air Research Program, Final Report. [ Links ]
Josipovic M, Annegarn, HJ, Kneen, MA, Pienaar, JJ and Piketh, SJ (2009) 'Concentrations, distributions and critical level exceedence assessment of SO2, NO2 and O3 in South Africa', Environmental Monitoring Assessment, December 2009, http:// www.ehrn.co.za/publications/download/120.pdf [ Links ]
Josopovic M, Annegarn HJ, Kneen MA, Pienaar JJ and Piketh SJ (2011) 'Atmospheric dry and wet deposition of sulfur and nitrogen species and assessment of critical loads of acid deposition exceedance in South Africa', South African Journal of Science, March 2011, vol. 107, no. 3. [ Links ]
Krewski D, Burnett RT, Goldberg MS, Hoover K, Siemiatycki J, Abrahamowicz M, White WH and others (2000) Health Effects Institute Reanalysis of the Harvard Six Cities Study and the American Cancer Society Study of Particulate Air Pollution and Mortality, A special Report of the Institute's Particle Epidemiology Reanalysis Project. [ Links ]
Krewski D, Jerret M, Burnett RT, Ma R, Hughes E, Shi Y, Turner MC, Pope A, Thurston G, Calle EE and Thun MJ (2009) Extended follow-up and spatial analysis of the American Cancer Society Study Linking Particulate Air Pollution and Mortality, Health Effects Institute [ Links ]
Lin CA, Pereira LAA, Nishioka DC, Concecao GMS, Braga ALF and Saldiva PHN (2004) 'Air pollution and neonatal deaths in Sao Paulo, Brazil', Brazillian Journal of Medical and Biological Research, vol 37, pp 765-770. [ Links ]
National Acid Precipitation Assessment Program Report to Congress (NAPAP 2005): An Integrated Assessment, National Science and Technology Council, 2005, Washington DC. [ Links ]
Orfanoudakis N, Vakalis A, Krallis K, Hatziapostolou A and Vlachakis N (2005) Emission Reduction Techniques & Economics in Coal-Fired Power Plants, Laboratory for Steam Boilers, Turbines & Thermal Plants, TEI-Chalkis, Psachna Evia. [ Links ]
Ostro, B (2004) Outdoor air pollution: assessing the environmental burden of disease at national and local level, Environmental Burden of Disease series No 5, World Health Organisation. [ Links ]
Pikhart H, Bobak M, Gorynski P, Wojtyniak B, Danova J, Celko MA, Kriz B, Briggs D and Elliot P (2001) 'Outdoor sulfur dioxide and respiratory symptoms on Czech and Polish school children: a small area study (SAVIAH), Small-Area Variation in Air Pollution and Health', International Archives of Occupational and Environmental Health, October 2001, vol. 78, no. 8, pp 574-578. [ Links ]
Pope CA, Thun MJ, Namboodiri MM, Dockery DW, Evans JS, Speizer FE and Heath CW (1995) 'Particulate air pollution as a predictor of mortality in a prospective study of US adults' American Journal Respiratory Critical Care Medicine, vol. 151, pp 669-674. [ Links ]
Pope CA, Burnett RT, Thun MJ, Calle EE, Krewski D, Iyo K and Thurston GD (2002) 'Lung cancer, cardiopulmonary mortality and long term exposure to fine particulate air pollution', Journal of American Medical Association, March 2002, vol. 281, no. 9, pp 1132-1141. [ Links ]
Pretorius, I (2015) Impacts and control of coal-fired power station emissions in South Africa. PhD thesis Department of Geography and Environmental Management, West University [ Links ]
Rowe RD, Lang, CM, Chesnut, LG, Latimer, DA, Rae D, Bernow, SM and White, DE (1995) New York State Environmental Externalities Cost Study, Empire State Electric Energy Research Corporation [ Links ]
Samoli E, Schwartz J, Analitis A, Petasakis Y, Wojtyniak B, Touloumi G, Spic C, Balducci F, Medina S, Rossi G, Sunyer J, Anderson HR and Katsouyanni K (2003) Sensitivity analysis of regional differences in short term effects of air pollution on daily mortality in APHEA cities. Short Communication Report to the Health Effects Institute 2003. [ Links ]
Sasol (2014) Sasol Pty (Ltd.) Final Motivation for the Additional Postponement of Compliance Timeframes in terms of Regulation 11 of the Section 21 NEM: AQA Minimum Emissions Standards, December 2014. [ Links ]
Scorgie Y and Thomas R (2006) Eskom Mpumalanga Highveld Cumulative Scenario Planning Study: Air Pollution Compliance Assessment and Health Risk Analysis of Cumulative Operations of Current, RTS and Proposed Eskom Power Station Located within the Mpumalanga and Gauteng Provinces. Report No.: APP/06/ ESKOM-05 Rev 1.0 [ Links ]
South African demographic and health survey 2003 (SADHS 2003): Full Report, Department of Health Republic of South Africa. [ Links ]
South Africa's Mineral Industry 2004-2005 (SAMI 2005); Directorate: Mineral Economics; Department: Minerals and Energy, December 2005. [ Links ]
Srivastava R (2000) Controlling SO2 Emissions: A review of Technologies. US Environmental Protection Agency; National Risk Management Research Laboratory EPA/600/R-00/09.3 [ Links ]
Statistics South Africa (StatsSA 2013) Mortality and cause of death in South Africa 2010: Findings from death notification. Statistical Release P0309.3, November 2013 [ Links ]
Stedman JR, Linehan E and King K (1999) Quantification of the health effects of air pollution in the UK for the review of the national air quality strategy, A report produced for the Department of the Environment, Transport and the Regions [ Links ]
Sunyer J, Ballester F, Le Terte A, Atkinson R, Ayres JG, Forastiere F, Forsberg B, Vonk JM, Bisanti L, Tenias JM, Medina S, Schwartz J and Katsouyanni K (2003) 'The association of daily sulfur dioxide air pollution levels with hospital admissions for cardiovascular diseases in Europe (The APHEA-II study)' European Heart Journal, vol. 24, pp 752-760 [ Links ]
Sunyer J, Atkinson R, Ballester F, Le Tertre A, Ayres JG, Forastiere F, Forsburg B, Vonk JM, Bisanti L, Anderson RH, Schwartz J and Katsouyanni K (2002) 'Respiratory effects of sulfur dioxide: a hierarchical multicity analysis in the APHEA 2 study', Occupational Environmental Medicine, 2003, vol. 60, no. 2. [ Links ]
United States Environmental Protection Agency (US EPA 2004) United States Environmental Protection agency. Epidemiology of human health effects associated with ambient particulate matter. In: Air quality Criteria for Particulate Matter. Vol II of II. Research Triangle Park, NC: USEPA. Document no EPA/600/P-99/002bF. October 2004 [ Links ]
United States Environmental Protection Agency (US EPA 2010) the Benefits and Costs of the Clean Air Act from 1990 to 2020. Final Report - Rev A, US Environmental Protection Agency Office of Air and Radiation. April 2011. [ Links ]
Van Horen, C (1996) Counting the social costs: electricity and externalities in South Africa, Elan Press and University Press. [ Links ]
Viscusi WK and Aldy JE (2002) The value of a statistical life: a critical review of market estimates throughout the world, Discussion Paper no 392 11/2002. John M Olin Centre for Law, Economics and Business, Harvard Law School, Cambridge. [ Links ]
Western Cape Government: Department of Health: (2014) Western Cape Government Hospital Tariffs: UPFS Fee Schedule for Full Paying Patients (Externally Funded, Foreigners, RGP and Patients with Private Doctor Incl): 1 APRIL 2014. https://www.westerncape.gov.za/assets/departments/health/annexure_a3_ tariffs_externally_funded_april_2014.pdf [ Links ]
Wichmann J and Voyi K (2012) 'Ambient air pollution exposure and respiratory, cardiovascular and cerebrovascular mortality in Cape Town, South Africa: 2001 - 2006', International Journal of Environmental Research and Public Health, 5 November 2012, Vol 9, pp 3975-4016. [ Links ]
World Health Organisation (2000) Evaluation and Use of Epidemiological Evidence for Environmental Health Risk Assessment: Guideline Document. EUR/00/5020369 [ Links ]
World Health Organisation (2013) Review of Evidence on Health Aspects of Air Pollution - REVIHAAP Project Technical Report. [ Links ]
World Health Organisation (2014) World health statistics 2014, Global Health Observatory Data Repository. Accessed 17/06/2015 http://apps.who.int/gho/data/node.resources. [ Links ]
Received: 14 March 2018
Reviewed: 26 April 2018
Accepted: 27 May 2018

