


Serviços Personalizados
Artigo
 Inglês (pdf)
 Artigo em XML
 Referências do artigo
Indicadores

Links relacionados
-
 Citado por Google
 -
 Similares em Google
Compartilhar

 Permalink
African Human Mobility Review
versão On-line ISSN 2410-7972
versão impressa ISSN 2411-6955
AHMR vol.3 no.1 Cape Town Jan./Abr. 2017
ARTICLES
The Impact of Migration on the Welfare of Households in Ghana: A Propensity Score Matching Approach
Abdul-Malik AbdulaiI; Louis Boakye-YiadomII; Peter QuarteyIII
IDepartment of Mathematics, University for Development Studies, Navrongo, Ghana
IIDepartment of Economics, University of Ghana, Legon
IIIDepartment of Economics, University of Ghana, Legon
ABSTRACT
Individuals usually migrate to improve their economic conditions and those of their family members left behind. However, less is understood about the impact of internal migration on the well-being of family members left behind. This study contributes to the debate by offering an empirical assessment of the welfare difference between migrant and non-migrant households by analysing data recently collected by the Centre for Migration Studies, University of Ghana. Results from the analysis are inconclusive. Using two indicators of measuring welfare (the World Bank Welfare Index and the number of children enrolled in school at the time of the survey), the latter shows higher welfare in favour of nonmigrant households whilst the former indicates equality in welfare for all households. On the other hand, econometric estimations using the Propensity Score Matching (PSM) did not find any significant difference between the welfare of households that sent out migrants and those that did not.
Keywords: impact, internal migration, households' welfare, Ghana.
Introduction
In developing countries, it is fairly common to see one or more household members migrate to either urban areas or neighbouring countries, attempting to increase their income and improve the economic conditions of their households. While remittances from migrant workers have been shown empirically to improve the economic conditions of family members left behind (Ackah & Medvedev, 2010; Quartey, 2006; Yang, 2005), less understood is the impact of migration on the well-being of family members left behind, more specifically, households with internal migrants. Since most migrant workers migrate alone, and in some cases migrate with spouses,1 their children and other dependents (the aged) are left in the care of others. As such, a question worth investigating is: To what extent is the well-being of the left-behind affected by this migration?
It is evident that though migration is prevalent in Ghana and is also not a new phenomenon, very few studies have rigorously examined its welfare impact empirically. While several causes might account for this gap in the Ghanaian literature, it does appear that data limitation and modelling difficulties are some of the main reasons. Individuals normally participate in migration to improve their well-being, whether those decisions are made at the individual or household levels (Lipton, 1980; de Haan, 1999). A household is likely to send a migrant when the expected value of the migrant's remittances exceeds that individual's net contribution to household welfare prior to migration. That is to say that in the ideal situation, migration would always be welfare enhancing.
In the welfare literature, however, there are mixed findings regarding the likely impact of migration on welfare. While some studies find a higher welfare for households with migrants (see Ackah & Medeleve, 2010; de Brauw et al., 2012), others did not find any significant impact of migration on household welfare (see Boakye-Yiadon, 2008; Litchfield & Waddington, 2003; Farrington & Slater, 2006; Lloyd-Sherlock, 2006; Sahn & Alderman, 1996). The current study contributes to the debate by offering a novel empirical assessment of the welfare difference between migrant and non-migrant households by drawing on and analysing data recently collected by the Centre for Migration Studies, University of Ghana and funded by the Sussex University, U.K.
Methodology of the Study
Data used for this study is sourced from the Migrating Out of Poverty (MOP) dataset collected by the Centre for Migration Studies, University of Ghana, in collaboration with Sussex University, U.K., from March to May 2013. This dataset is unique2 over the census datasets, which are predominantly used by most studies in Ghana. A multi-stage sampling technique was used to select 315 households in the Northern Region, consisting of 231 migrant and 84 non-migrant households for interview. The first stage was a purposive selection of 11 districts consisting of 21 Enumeration Areas (EAs) selected from a list of EAs in the 2010 National Population Census results. The number of EAs selected from each district is proportional to the total number of out-migrants from each district. These districts are the Tolon, Savelugu-Nantong, Kumbungu, Sagnarigu, Central and East Gonja, West and East Mamprusi, Kariga, Yendi, and Tamale Metropolis. The selection of these districts was informed by the high proportion of out-migrants produced by those districts recorded in the 2010 National Population Census results. This was followed by a listing of households in these selected EAs.
The second stage involved a systematic sampling with a random start to select migrant and non-migrant households from each of the selected EAs. The migrant households were further stratified into three groups: seasonal migrants, return migrants and absent out-migrants. A total of 15 households were purposively selected from each EA, consisting of 4 households from the non-migrant households and 11 households from the migrant households. The final stage was the purposive selection of an adult household member, irrespective of gender, who had more knowledge about the household for interview.
Estimation Procedure
Given that individuals or households undertake migration to improve on their well-being as espoused by economic theories, the natural questions that arise are: Why are some people failing to migrate? What, if any, are the welfare differences between migrant and non-migrant households as a result of migration? Clearly, these questions fall under impact evaluation. One major challenge in empirical studies regarding impact evaluation is the issue of a counterfactual, that is, a hypothetical scenario of what the welfare profile of households would have been in the absence of the activity (migration). The counterfactual is hypothetical because it is impossible for the researcher to know or observe exactly what the welfare levels of households would have been had one or more of their members not migrated or if the activity had not occurred.
Methods of welfare impact can be classified into two broader types: experimental and non-experimental methods. Experimental methodologies randomly select a control group prior to the application/onset of the activity and, therefore, individuals or households belonging to this group are then exempted from the intervention/activity (see Burtless, 1995; World Bank, 2007; Galasso et al., 2001). This approach is suitable for evaluating interventions for which participation can be controlled by the researcher or for which participation is randomly and naturally determined. Migration flow is not an activity that can be assessed experimentally in terms of its impact on welfare since participation is neither random nor subject to a researcher's influence. Non-experimental approaches, on the other hand, consist of a wide range of techniques that construct a control group to facilitate comparisons with a treatment group (see World Bank, 2007; Ravallion, 2001; Moffitt, 1991). These techniques include propensity score matching (PSM), instrumental variable (IV) and the double difference (difference in difference) methods. The first two techniques will be used in the current study for comparison to deal with the issue of selection bias. The last technique cannot be used as it requires data on treatments and controls before and after migration.
Instrument variables are variables that matter to participation but not outcomes. That is, a variable (instrument) that is related to migration but not to welfare is chosen. The instrumentals are first used to predict participation in activity (migration) and then one sees how the outcome indicators vary with the predicted values conditional on other characteristics. PSM, on the other hand, is a statistical matching technique that attempts to estimate the effect of a treatment, policy or other intervention (in our case, migration) by accounting for the covariates that predict receiving the treatment. The PSM approach tries to capture the effects of different observed covariates X on participation in a single propensity score. Then, outcomes of participating and non-participating households with similar propensity scores are compared to obtain the program's (participating in migration) effect (see Mensah et al., 2010).
That is, propensity score: P(X) = Pr (T = 1/X).
In using the PSM, two assumptions need to be made. These are the conditional independence and presence of common support (Rosenbaum & Rubin, 1983). The conditional independence states that given a set of observable covariates X that are not affected by treatment; potential outcomes Y are independent of treatment assignment T.
If YT represents outcomes for participants and YC outcomes for non-participants, conditional independence implies: (YT, YC) -- Ti/X.
The second assumption - common support or overlap condition:
0 < P (Ti = 1/Xi) < 1.
This condition ensures that treatment observations have comparison observations 'nearby' in the propensity score distribution (Heckman et al., 1999).
In matching participants to non-participants, different matching criteria can be used to assign participants to non-participants on the basis of the propensity. Primarily, there are four matching methods. These include the Nearest-neighbour matching (NNM), Radius matching (RM), Caliper Matching (CM) and Stratified matching (SM).3 In this study, the NNM technique with replacement and a caliper imposed to avoid poor matching is used. In the NNM, the absolute difference between propensity scores in the treated and control groups is minimised. The control and treatment subjects are randomly ordered where a treated subject is matched with a control subject with a closest propensity score.
C(Pi) = Minj|Pi - Pj|
Where C(Pi) is the group of control subjects j matched to treated subjects i on the estimated propensity scores.
Pi is the estimated propensity score for the treated subject i.
Pj is the estimated propensity score for the control subject j.
Having estimated the propensity scores, the next thing to do is to examine the impact of program participation (migration) on potential outcomes (in this case, welfare). The impact of a treatment for an individual i, noted δi, is defined as the difference between the potential outcomes with treatment and without treatment.
Thus, δi = Y1i -Y0i.
The mean impact of treatment is obtained by averaging the impact across all individuals in the population. This estimate is called Average Treatment Effect (ATE).
Implies ATE = Ε(δ) = Ε(Υ1-Υ0).
A quantity of interest is the Average Treatment Effect on the Treated (ATT), which measures the impact of participation in migration on the welfare of those households left behind.
i.e ATT = E(Y1-Y0/D=1).
Finally, the Average Treatment on the Unmatched (ATU) measures the impact that the treatment would have had on those who did not receive the treatment (control group).
In welfare literature generally, there are two main ways of measuring welfare. These are the consumption and income approaches. Each of these approaches has advantages and disadvantages. Consumption is usually measured better than income in survey data; it is less noisy and better reflects long-term household well-being. It is also a standard measure of welfare, allowing for cross-country comparisons with the results of other studies (Bontch-Osmolovski, 2009). The use of income, on the other hand, may be comparable across space (de Brauw et al., 2012). This study adopted the consumption approach of measuring welfare because of the reasons cited above by Bontch-Osmolovski (2009).
To assess the welfare difference between migrants and non-migrants in a more robust framework, the methodology of Beegle et al. (2011) was followed. The model is specified as follows:

Where ∆lnC is the change in the logarithm of monthly per capita consumption for a given household,
X represents individual characteristics,
M is an indicator variable for an individual who migrates out of the household or if a household had a migrant at the time of the survey, and
H represents a household-specific fixed effect.
An advantage of this model is that one can control for individual differences through the vector X by including categorical variables for age, gender, marital status and educational status in X.
Results and Discussion
A comparison of mean consumption expenditure as a measure of welfare across districts in the study area revealed that Tamale metropolis and Sagnarigu district have the highest mean welfare values (GH₵9,419.12 and GH₵9,499.12, respectively). 4 This result is expected, as these two areas constitute the capital of the Northern Region of Ghana where, all being equal, living standards are relatively high and more job opportunities are available. Savelugu district recorded the least mean welfare in the region.
Using the welfare index, a common approach of welfare measure (World Bank, 2008) expressed as the ratio of the mean consumption of migrants to that of non-migrants, gives an index of 0.9786.5 This indicates equality in welfare between migrant and non-migrant households. One other measure of non-financial welfare used widely in the literature is the proportion of children enrolled in school by households (see Dudwick et al., 2011; Molyaneth, 2012). Among migrant and non-migrant households, we estimated the proportion of children between the ages of 5 and 15 years (inclusive) who were at school at the time of the survey. The result indicates that there is a welfare difference between migrant and non-migrant households, with the latter households enjoying higher welfare (having higher numbers of children enrolled in school). As high as 81 percent of children in non-migrant households were enrolled in school, compared to 27.3 percent in migrant households. Perhaps the low enrolment in migrant households could be explained by the absence of migrant parents to send their left-behind children to school in cases where nobody is fully responsible for their wards at origin. This is consistent with the conventional knowledge in the literature that presumes negative consequences of parental migration for the children who are left behind at origin (see Dinbabo & Nyasulu, 2015; Xin & Chikako, 2015; Liang et al., 2008; Xiang, 2007).
The acquisition of household consumer durables by households, which is an indicator of household welfare, was also examined. The study noted that a higher percentage of non-migrant than migrant households acquired new houses and agricultural lands. Approximately 25 percent of non-migrant households acquired new houses compared to 23 percent of migrant households. Also, about 20 percent of migrants' households acquired more agricultural lands, compared to 25 percent of non-migrant households. The low patronage of agricultural lands by migrant households could be explained perhaps by the identification of other more productive investment sources than acquiring agricultural lands and might therefore be diversifying. This result is at odds with the findings noted in the literature that through remittances migrant households are more able to improve their agricultural land holding than non-migrant households. As expected, more migrant than non-migrant households acquired household electronic goods and other electronic appliances. Also worth noting is the small number of households6that reported acquiring household 'white goods' (fridges and washing machines). This could be explained by the fact that some of the communities in the study area were not connected to the national grid or, if connected, might have had difficulty paying for the exorbitant electricity bills.
In recent times, sanitation has been considered important not only for healthy living but also for ensuring a filth-free environment. This is undoubtedly welfare enhancing. Availability of places of convenience in the study area was therefore examined. The result shows that regardless of the migration status of households, almost all households (99 percent) in the study area have bathrooms. On the other hand, the majority of households (81.40 percent) do not have toilet facilities.7 This figure is about four times higher than the national average of 19 percent, but slightly lower than the regional average of 86 percent (GSS, 2012). However, it is observed that a higher percentage of migrant than non-migrant households (85 versus 81 percent) do not have toilet facilities, indicating that non-migrant households do better in constructing toilet facilities at homes and enjoy higher welfare than migrant households. This finding is consistent with Awumbila et al.'s (2014) study that reports that close to 94 and 63 percent of migrant households in Old Fadama and Nima, respectively, do not have toilet facilities in their residence. Sundari (2003) noted similar findings about Chennai slums.
To assess the impact of migration on households' welfare in the study area and to correct for selectivity bias, a regression equation was estimated using the Heckman two-step selection model. The first step was to choose an instrument that is correlated with migration as an independent variable and is not correlated with per capita consumption expenditure as the dependent variable. Ethnicity of individuals was chosen as an instrument and it was argued that people are likely to migrate if they are identifiable by certain ethnic groups. For example, in most of the other regions, certain ethnic groups8have replicas of their chieftaincy institutions and, therefore, people who travel to those destinations and are identified with these institutions are accommodated and given the necessary assistance to adjust. The same argument cannot be made for consumption expenditure. To test the relevance of the instrument, the authors regressed the ethnicity variable on per capita consumption expenditure as proposed by Mckenzie and Sasin (2007). The result shows no association between the two variables. The second step was to regress the log of per capita consumption expenditure on the regressors, including the migration status using the Heckman two-step selection to counter the selectivity bias. The Heckman two-step selection involves, first, estimating a probit model to drive the inverse mills ratio. The second step is to estimate the outcome equation including the inverse mills as a regressor. Five welfare variables were included in the equation as explanatory variables and these are the human asset variables, the house composition variables, the location variables, the employment variables and the physical asset variables.
Results from the estimation indicate that most of the parameter estimates are statistically significant and rightly signed, as shown in Table 1. Consistent with prior expectations and existing literature, educational qualification of household head increases with welfare. Implicitly, the more a household head is educated, the more likely he/she increases the earnings as predicted by the human capital model, therefore increasing the household consumption and welfare. Households increase their consumption expenditure by 6.3 percent as their heads increase their educational status. Age of head of household (Ageheadhh) is positive and significant, which means that household welfare is higher when the head is younger. This finding is consistent with studies by Ackah and Medvedev (2010).
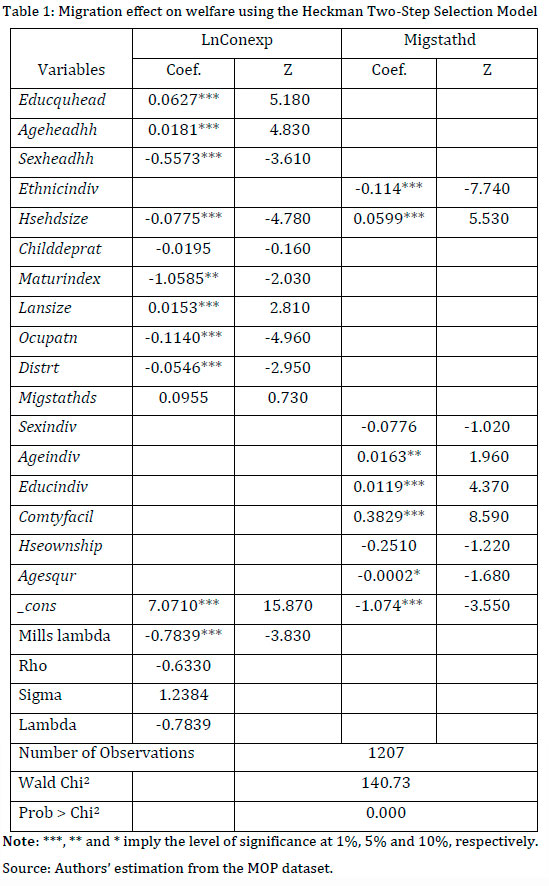
Sex of household head significantly and negatively relates to welfare as indicated by sexheadhh variable. This means that households with male heads have less welfare than their female counterparts. This can be explained perhaps by the practice of polygamy by male heads. Polygamous practice may result in larger household size9 and subsequently lead to a reduction in per capita consumption. This finding is at variance with those of Nwaru et al. (2011) and Sakiru (2013), which indicate that male-headed households have higher welfare than female-headed households in Nigeria. Having a larger household and a higher maturity index negatively affect household welfare, while owning land of greater size increases household welfare. The strong negative correlation between household size and welfare is consistent with Lanjouw and Ravallion's (1995) findings, which show a negative correlation between household size and consumption per person in developing countries. There were spatial differences in terms of welfare as shown by the district variable (Distrt). Somehow at odds with literature and the widely held view that living standards and welfare are highest in cities, the findings of the current study show that households in all other districts in the study area have higher household welfare than those in the Tamale metropolis.
Of much interest to the study is the effect of migration on household welfare as indicated by the Migstathd variable. The parameter estimate shows increases in household welfare with increasing migration, though not statistically significant. This confirms our earlier findings about the welfare and migration linkage using simple tabulation. The coefficient of the Mills ratio (λ) is negative and significant which lends support to the hypothesis of selectivity bias and, therefore, the model could not have been estimated using the OLS. Individual educational level and access to community facilities enhance household welfare.
An alternative method to the instrumental variable approach in dealing with the selectivity bias is propensity score matching. The authors used this method to also ascertain if there is a welfare difference between migrant and nonmigrant households. The results from the average treatment effects, indicators of the quality of propensity score matching, estimation of propensity scores using the logit model, covariate balance as well as robustness checking or sensitivity analysis are presented below in Tables 2, 3 and 4, respectively.
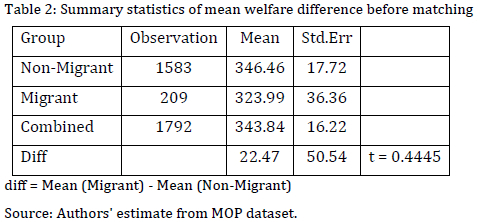
The summary statistics in Table 2 clearly show a difference in mean welfare between migrant and non-migrant households. That is, migrant households increase their consumption expenditure by Gh₵ 22.47 over non-migrant households. This mean difference in welfare may not just be the result of the treatment (migration) but could also be due to differences in individual characteristics.
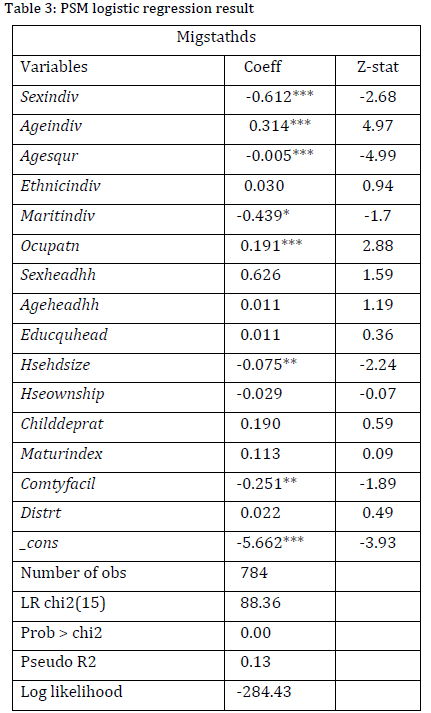
To ascertain if individual characteristics explain the welfare difference, the propensity scores using the logit model were estimated. Results from the scores indicate that most of the variables used were rightly signed and significantly influence the probability to migrate. Sex of individual significantly and negatively associated with the probability to migrate (see Table 3), suggesting that males are less likely to migrate than females. This finding is at variance with the widely held notion in the literature that males are more likely to migrate than females (see Richter & Taylor, 2006). Marital status, household size and having access to community facilities negatively and significantly correlate with the probability to migrate. The negative effect of access to community facilities on the probability to migrate suggests that having access to electricity and pipe-borne water, among others, reduces the likelihood of a household sending out a migrant (see Ackah & Medvedev, 2010).
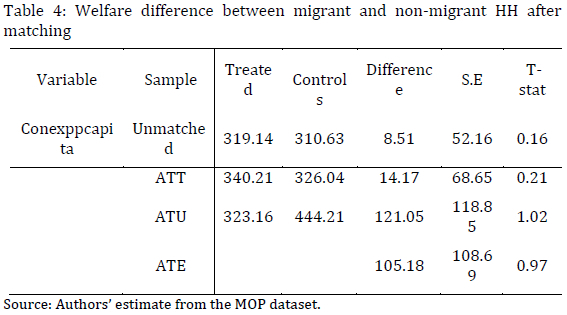
Examining the welfare difference between migrant and non-migrant households, the average treatment effect was estimated, as shown in Table 4. The result indicates a welfare difference between households with and without migrants. Focusing on the ATT, which is the average treatment effect on the treated, it is noted that migrant households increase their consumption expenditure (welfare) by 14.17 higher than the non-migrant households with the difference not statistically significant. This result is at odds with our earlier result on welfare using the number of children enrolled in school, but is consistent with the finding of Awumbila et al. (2015).
We further conducted a balancing test between the covariates to ascertain if the level of heterogeneity between the treated (migrant households) and the control (non-migrant households) is eliminated after matching. Both the standard bias before and after matching indicates that the PSM using the nearest neighbour algorithm eliminates most of the bias between the treated and the control groups. Indeed, we do not observe any significant difference in means of all the covariates included in the model after matching. The proportion of bias reduction for most of these variables is at least 55 percent. The Pseudo R2 value after matching has also significantly reduced, suggesting that the overall results from the matching procedure have satisfactorily created a balance between the covariates of the treated and the control groups (Sianesi, 2004).
Conclusions and Recommendations
The study examined the welfare difference between migrant and non-migrant households. A comparison of mean consumption expenditure (a proxy for welfare) across source districts shows that Tamale metropolis and Sagnarigu district have higher welfare values than the other districts studied in the region. Welfare difference between migrant and non-migrant households was not conclusive. While there is a higher welfare difference between migrant and non-migrant households, with the latter enjoying higher welfare using the number of children enrolled in school, there is equality in welfare between the households using the World Bank Welfare Index. On the contrary, an econometric assessment (PSM) shows higher welfare levels for migrant households, though not statistically significant.
Regarding policies, it would be useful for government and other nongovernmental organisations (NGOs) considering policies to streamline migration and improve on the welfare of the people to give more priority to education in terms of access and affordability. Also, government and other stakeholders should consider providing job opportunities and extending access to public facilities such as schools, electricity, health posts and potable drinking water to the people. Furthermore, for the recent government policy dubbed 'sanitation day'10 (which, of course, is a welfare policy) to achieve the desired goal, district assemblies should enforce their by-laws that mandate every house to have a toilet facility as most households did not have toilet facilities.
References
Ackah, C. and Medvedev, D. 2010. Internal Migration in Ghana: Determinants and Welfare Impacts. World Bank 2010 Ghana Poverty Assessment Paper. World Bank.
Awumbila, M., Owusu, G. and Teye, J.K. 2014. Can Rural-Urban Migration into Slums Reduce Poverty? Evidence from Ghana. Migrating Out of Poverty Research Program Consortium Working Paper 13.
Awumbila, M., Teye, J.K., Litchfield, J., Boakye-Yiadom, L., Deshingkar, P. and Quartey, P. 2015. Are Migrant Households better off than Non-migrant Households? Evidence from Ghana. Migrating Out of Poverty Working Paper 28.
Beegle, K., De Weerdt, J. and Dercon, S. 2011. Migration and economic mobility in Tanzania: Evidence from a tracking survey. The Review of Economics and Statistics, 93(3): 1010-33. [ Links ]
Boakye-Yiadom, L. 2008. Rural-Urban Linkages and Welfare: The Case of Ghana's Migration and Remittance Flows. Philosophy PhD Thesis, University of Bath. [ Links ]
Bontch-Osmolovski, M. 2009. Work-Related Migration and its Effect on Poverty Reduction and Educational Attainment in Nepal. PhD Thesis, University of North Carolina at Chapel Hill. [ Links ]
Burtless, G. 1995. International Trade and the Rise in Earnings Inequality. Journal of Economic Literature, 33(2): 800-816. [ Links ]
de Brauw, A., Mueller, V. and Woldehanna, T. 2012. Does Internal Migration Improve Overall Well-Being in Ethiopia? ESSP Working Paper 55.
de Haan, A. 1999. Livelihoods and poverty: The role of migration: A critical review of the migration literature. Journal of Development Studies, 36(2): 1-47. [ Links ]
Dinbabo, M. and Nyasulu, T. 2015. Macroeconomic determinants: Analysis of pull factors of international migration in South Africa. African Human Mobility Review (AHMR), 1(1): 27-52. [ Links ]
Dudwick, N., Hull, K., Katayama, R. Shilpi, F. and Simler, K. 2011. From Farm to Firm: Rural-Urban Transition in Developing Countries. World Bank, Washington D.C.
Farrington, J. and R. Slater 2006. Introduction: Cash transfers: Panacea for poverty reduction or money down the drain? Development Policy Review, 24(5): 499-511. [ Links ]
Galasso, E., Ravallion, M. and Salvia, A. 2001. Assisting the Transition from Workfare to Work: Argentina's Proempleo Experiment. A report on ex-post evaluation of the World Bank's Social Protection III Project in Argentina, September 2001.
Ghana Statistical Service 2012. 2010 Population and Housing Census Summary Report, Accra, Ghana.
Heckman, J.J., Robert, L. and Jeffrey, S. 1999 .The Economics and Econometrics of Active Labor Market Programs. In: Ashenfelter, O. and Card, D. (Eds.). Handbook of Labor Economics, 3. Amsterdam: North- Holland, pp. 1865-2097.
Khandker, S.R, Koolwal, G.B and Samad, H.A 2010. Handbook on Impact Evaluation. Quantitative Methods and Practices. The International Bank for Reconstruction and Development, World Bank.
Lanjouw, P and Ravallion, M. 1995. Poverty and household size. Economic Journal, 105:1415-34. [ Links ]
Liang, Z., Guo, L. and Duan, C.C. 2008. Migration and the well-being of children in China. The Yale-China Health Journal, 5:25-46. [ Links ]
Lipton, M. 1980. Migration from rural area of poor countries: the impact on rural productivity and income distribution. World Dev. 8(1): 1-24. [ Links ]
Litchfield, J. and H. Waddington 2003. Migration and Poverty in Ghana: Evidence from the Ghana Living Standards Survey. Sussex Migration Working Paper no. 10. Sussex Centre for Migration Research. London: MacMillan Pres ltd.
Lloyd-Sherlock, P. 2006. Simple transfers, complex outcomes: The impacts of pensions on poor households in Brazil. Development and Change 37(5): 969995.
McKenzie, D. and Sasin, M.J. 2007. Migration, Remittances, Poverty, and Human Capital: Conceptual and Empirical Challenges. World Bank Policy Research Working Paper 4272.
Mensah, J. Oppong, J.R. and Schmidt, C.M. 2010. Ghana's national health insurance scheme in the context of the health MDGs: An empirical evaluation using propensity score matching. Health Economics, 19: 95-106. [ Links ]
Moffitt, R. 1991. Program evaluation with non-experimental data. Evaluation Review, 15(3): 291-314. [ Links ]
Molyaneth, H. 2012. Revisiting Poverty-Migration Nexus: Causes and Effects of Cambodia-Thailand Cross-Border Migration. PhD Thesis, Nagoya University. [ Links ]
Nwaru, J. Iheke, C., Onwuchekwa, R. and Onyenweaku, C.E. 2011. Impact of migrant remittances on the welfare of arable crop farm households in South Eastern Nigeria. Human Ecology Review, 18(2). [ Links ]
Quartey, P. 2006. The impact of migrant remittances on household welfare in Ghana. Research Paper 158, AERC.
Ravallion, M. 2001. The mystery of the vanishing benefits: An introduction to impact evaluation. The World Bank Economic Review, 15(1): 115-140. [ Links ]
Richter, S. and Taylor, J.E. 2006. Gender and Determinants of International Migration from Rural Mexico Over Time. <http://bit.ly/2o9qzna> (retrieved 17 March 2017).
Rosenbaum, P.R. and Rubin, D.B. 1983. The central role of the propensity score in observational studies for causal effects. Biometrika 70(1): 41-55. [ Links ]
Sahn, E. D. and Alderman, H. 1996. The Effect of Food Subsidies on Labor Supply in Sri Lanka. Economic Development and Cultural Change, 45(1), 125145. [ Links ]
Sakiru, O.A. 2013. Profiles and determinants of poverty among urban households in South-West Nigeria. American Journal of Economics. 3(6): 322329. [ Links ]
Sianesi, B. 2004. Evaluation of the active labour market programmes in Sweden. The Review of Economics and Statistics, 86(1): 133-155. [ Links ]
Sundari, S. 2003. Quality of life of migrant households in urban slums. In: Martin, J., Bunch, V., Suresh, M. and Vasantha Kumaran, T. (Eds.). Proceedings of the Third International Conference on Environment and Health, Chennai, India. pp. 537-552.
World Bank 2007. Impact Evaluation. <http://bit.ly/2o9ofg9> (retrieved 17 March 2017).
World Bank 2008. World Development Report 2009: Reshaping Economic Geography. Washington, DC: World Bank. [ Links ]
Xiang, B. 2007. How far are the left-behind left behind? A preliminary study in rural China. Population, Space and Place, 13:179-191. [ Links ]
Xin, M. and Chikako, Y. 2015. Children of Migrants: The Impact of Parental Migration on their Children's Education and Health Outcome. IZA Discussion Paper, No. 9165.
Yang, D. 2005. International Migration, Human Capital and Entrepreneurship: Evidence from Philippine Migration's Exchange Rate Shocks. Policy Research Working Paper, World Bank.
1 This is more specific to rural-rural migrants who migrate for the purposes of farming.
2 Given that the survey was specifically designed for migrant source regions with high incidences of poverty, it was more detailed and comprehensive.
3 See Khandker et al. (2010) for a more detailed discussion of the various methods.
4 Equivalent to US$ 2,943.48 and US$ 2,968.48, respectively, at an exchange rate of US$1 to GH₵3.2 as at January 2015.
5 An index closer to 1 indicates greater equality between groups on the welfare measure (Dudwick et al., 2011).
6 0.71 and 0.70 percent, respectively, for non-migrant and migrant households.
7 This high deficit of toilet facilities registered by households is because most households use the bush as a place of convenience or use public toilets where available.
8 For example, we have the Dagomba, Gonja and the Mamprusi Chiefs in most of the other regions in Ghana.
9 Male-headed households tend to have larger household sizes using cross tabulation with a Chi-Square value of 152.09 at p < 1%.
10 This is a day reserved for every household to clean around its environs in the country, which falls on every first Saturday of the month.

