


Serviços Personalizados
Artigo
 Inglês (pdf)
 Artigo em XML
 Referências do artigo
Indicadores

Links relacionados
-
 Citado por Google
 -
 Similares em Google
Compartilhar

 Permalink
African Vision and Eye Health
versão On-line ISSN 2410-1516
versão impressa ISSN 2413-3183
AVEH vol.82 no.1 Cape Town 2023
http://dx.doi.org/10.4102/aveh.v82i1.801
ORIGINAL RESEARCH
Evaluating the visual function of motor vehicle drivers in Lesotho: A case for policy review
Zubeta Moledi; Diane van Staden
Department of Optometry, School of Health Sciences, University of KwaZulu-Natal, Durban, South Africa
ABSTRACT
BACKGROUND: Driving is a primary mode of travel in many countries. It relies primarily on the function of vision to navigate roads and traffic safely. Ensuring good vision for motor vehicle drivers is important to promote safety for all road users. Lesotho is a developing country, with road transportation central to the movement of people and goods within, and across the borders of the country. The absence of clear visual function requirements for driving in Lesotho motivated this study.
AIM: To assess the visual function of motor vehicle drivers in Lesotho.
SETTING: The study was conducted at the Traffic Department in Maseru, the main licensing centre where all drivers in the country must apply for issuance or renewal of driving licenses.
METHODS: This cross-sectional study recruited 460 active licensed drivers using systematic random sampling. Data were collected through a structured questionnaire, and comprehensive vision examination and was analysed using Strata version 14.
RESULTS: The mean age of participants was 42.9 ± 10.35 years. One fifth of participants had not had an eye examination before obtaining their licenses. About 70% had normal vision (6/9 or better) in the better-seeing eye. Among those with sub-normal vision, 29% had visual acuity between 6/18 and 6/48 in the better-seeing eye. About 40% had refractive error, with myopia showing the highest distribution (46.46%), followed by astigmatism (32.96%) and hyperopia (24.59%). Most participants passed colour vision (CV) (97.61%), contrast sensitivity (53.70%) testing, as well as visual field (99.6%). About 44% of participants reported having been involved in road traffic accidents.
CONCLUSION: Some vehicle drivers in Lesotho have compromised vision, with many not undergoing eye examination before obtaining driving licenses. Absence of screening methods for drivers in Lesotho could lead to road traffic accidents and have negative socio-economic impacts. Implementing standardised screening protocols would improve safety for road users.
CONTRIBUTION: A significant number of motor vehicle drivers in Lesotho have some form of visual impairment, with many not undergoing an eye examination before obtaining a driver's licenses. If drivers are encouraged to have their eyes examined regularly, many visual function anomalies could be detected early and their vision would be corrected accordingly. The absence of effective screening methods for drivers in Lesotho could possibly be a contributor to the incidence of RTAs in the country, with the resultant negative socio-economic impacts. Therefore, it is recommended that visual screening of motor vehicle drivers should be included in the traffic laws in Lesotho.
Keywords: driving licenses; visual function; driving regulations; road traffic accidents; vision standards.
Introduction
Road traffic accidents (RTAs) are the leading cause of death among children and young adults between the ages of 15 and 29 years.1,2 Every year about 1.25 million people are killed or injured due to RTAs, leaving families and communities to deal with the negative consequences.3 It is estimated that about 1.25 million people are killed on world's roads annually, with 50m people incurring nonfatal injuries.1 This presents a significant global health challenge. Road safety and road fatalities should be recognised as a major international public health issue, yet it rarely receives the attention it needs. The high number of RTAs constitutes a major public health and development concern3 because if countries do not work on road safety strategies, the cost of injuries and loss of life from RTAs will likely increase.
In 2010, the International Road Federation (IRF) set a goal to reduce road accidents by 50% in 2020 in European Union (EU) countries, with a further target of close to 0% by 2050.4 Efforts aimed at reaching these goals included safe road designs, as well as training of engineers and road builders on how to use new technologies. The World Health Organization (WHO) and the World Bank also entered a joint venture to fight this public health concern. Furthermore, the World Bank encouraged its borrowers to include road safety components within most of their highway and urban transport projects5 as RTAs may affect a country's economy in a negative way.
Visual function is the measure of how well the eye and visual system performs.6 It may include, among others, visual acuity (VA), contrast sensitivity (CS), visual field (VF) and colour vision (CV). Among the human factors that contribute to safe driving, visual skills of a driver are considered important.7,8 It is estimated that about 95% of sensory information needed for driving is visual.9,10 Research has shown that drivers with good vision have an advantage as compared to those with poor vision and may therefore have reduced chances of being involved in RTAs.11,12
Most developed countries such as the United Kingdom, Australia and the United States require anyone who intends driving on public roads to meet certain minimum visual function requirements before issuance of a driving licenses or permit. Similarly, in South Africa, the only neighbouring country to Lesotho, there are stipulated minimum visual functions that motor vehicle drivers must meet to be issued with a driver's licenses.13
Lesotho is a developing country enclaved by South Africa, with road transportation central to the movement of people and goods within, and across the borders of the country. It covers about 30 000 km2 area, with population of over 2m people, the majority of whom live in the capital, Maseru. The country is a member of the United Nations, African Union (AU), Commonwealth of Nations and Southern African Development Community (SADC).
The Lesotho Traffic Department, based in the capital city of Maseru, issues about 35 000 licenses renewals and 37 000 new licenses each year.14 Between 2012 and 2013, the number of RTAs in Lesotho increased from 2473 to 5538.15 In 2017, the number of RTAs were recorded as 4169. Fatalities from these accidents were 15.7% in 2013 and 16.4% in 2017.15 This rising incidence is of concern as RTAs have economic consequences for countries and socio-economic consequences for individuals.16 The highest percentage of fatalities (42.5%) from RTAs in Lesotho was observed in Maseru District,15 which is the economic capital. When reporting the causes of accidents, however, the Department of Road Safety focused primarily on reckless driving, driving under the influence of alcohol and 'machinery failure'. There is no literature in Lesotho to ascertain whether impaired visual function may be a contributing factor to RTAs in Lesotho.
Several studies have been conducted on visual function for driving,7,11,17,18 which have all indicated that VA, CS, VF, and CV are important functions for driving which should be assessed before issuing drivers with driving licenses. Therefore, this study was conducted to assess the visual function of drivers in Maseru, Lesotho, in the absence of standardised national requirements for driving.
Methods
This cross-sectional study was conducted at the Traffic Department in Maseru, which is the main licensing centre in Lesotho. The study was conducted between May 2019 and August 2019. Informed consent was obtained from participants following a thorough verbal explanation on the procedures that were involved in the study.
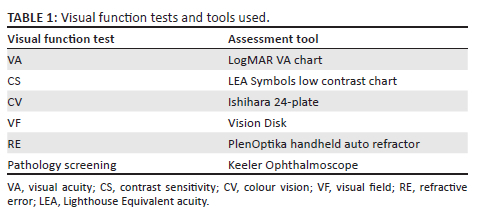
A structured questionnaire was administered to licensed drivers presenting to the Traffic Department in Maseru during the period of the study. The questionnaire was designed to elicit demographic data, the history of participants' health assessments, involvement in RTAs and factors related to safe driving. Visual function assessments were then performed by the researcher on all participants using tools as shown in Table 1. Visual functions tests were performed with visual correction where necessary.
A total of 460 drivers participated in the study, using a systematic sampling technique where every third subject who presented at the Traffic Department to renew their driver's licenses during the period of the study was selected.
For the purposes of this study, the refractive error definition was adapted from Refractive Error Study in Children (RESC) studies,19,20,21 where refractive error which ranged from 0.00 to ± 0.25 dioptre (D) was regarded as normal vision (emmetropia).
Myopia was classified as follows:
• Low to medium: −0.50 D up to −5.75 D
• High: −6.00 D or more
Hyperopia was classified as follows:
• Low: +0.50 D up to +2.00 D
• Medium to high: > +2.25 D
Astigmatism was reported as 0.75 D and more, where axis was in any meridian.
Refractive error was determined by using the PlenOptika handheld auto refractor. The test was done while the participant was seated on a chair, focusing on a target on the wall. The target chosen was a letter on the VA chart. To ensure that the results were valid, the measurement was taken in the same eye three times and average was taken. Refractive error was measured objectively and no subjective refraction was conducted due to time constraints.
Visual acuity was measured using LogMAR VA chart and was classified as follows22:
• Normal vision: 6/6 up to 6/9
• Mild visual impairment: 6/12 up to 6/15
• Moderate visual impairment: 6/18 up to 6/48
• Severe visual impairment: 6/60 or worse
The Ishihara 24-plate CV test was used to assess CV. As shown in Table 2, if 10 plates or more were read correctly, this was considered as a pass.23 If less than seven plates were correctly read, this was considered as a fail.
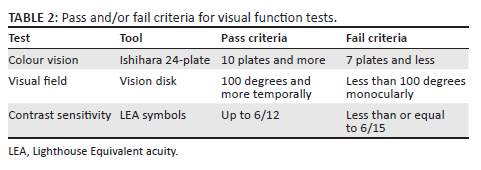
Visual field was assessed using the Vision Disk, which is a type of arc perimeter. The temporal VF was assessed, as it was most relevant for driving. A pass was considered when a participant achieved 100 degrees8 or more (full field), and less than 100 degrees was considered a fail.
For CS, the Lighthouse Equivalent acuity (LEA) Symbols low contrast chart was used, and a pass was regarded as being able to read up to 6/12, while a fail24 was reported if the result was ≤ 6/15.
Participants were screened for any possible presence of ocular pathology which could impair their vision when driving. A Keeler ophthalmoscope was used for pathology screening. The test was done in a darkened room.
After the clinical assessment, examination findings were captured using a clinical data recording sheet adopted from a study conducted in Ghana.11 Data were captured in Microsoft Excel, using a double-capturing technique to minimise errors, and were analysed using Strata version 14.
Results
The study included 460 licensed drivers, of whom 64% were male, and the remaining 36% were female. The overall mean age was 42.90 years, ±10.35 with 66% of the participants being 36-39 years of age. The median age was 40 years (interquartile range [IQR] of 25-50 years).
Clinical assessment of visual function
Visual acuity
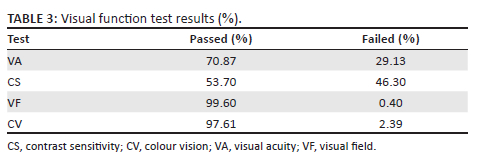
Overall, 70.87% of participants were found to have normal vision (6/9 or better in the eye with the best vision), while 134 participants (29.13) were found to have some degree of impaired visual function. Among those with subnormal VA, 0.75% had severe visual impairment.
Contrast sensitivity
Most of the participants (53.70%) passed the CS test (Table 3), achieving a result of up to 6/12 in the eye with the best vision. More than one-third (37.65%) reported wearing spectacles while driving. Among the participants who failed CS, about 57% reported that they wore spectacles while driving.
Visual field
As shown in Table 3, almost all participants (99.6%) achieved a measurement of 100 degrees temporal, with only two participants failing the test.
Colour vision
Most participants (97.61%) also passed the CV test (Table 3), with only 11 participants (2.39%) failing the Ishihara test. Of those who failed, eight (72.73%) were men. Among those who failed the CV test, four male drivers reported being involved in RTAs.
Refractive error
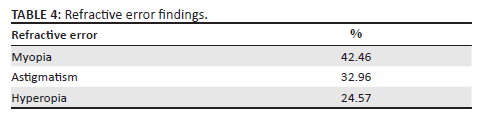
More than one-third of the participants (38.91%) were found to have some form of refractive error to varying degrees. Of the 179 participants with refractive error, the majority had myopia (42.46%), followed by astigmatism (32.96%) and hyperopia (24.57%). Although myopia had the highest distribution, none of the participants had high myopia (more than −6.00 D). Of those who were hyperopic, almost 98% were classified as having low hyperopia (+0.50 D up to +2.00 D) and only one participant had moderate-to-high hyperopia (> +2.25 D).
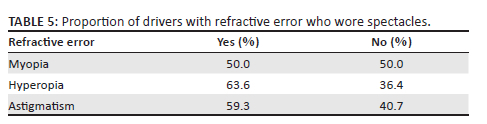
The distribution of spectacle wear was assessed against refractive error type (Table 4), categorising these into myopia, hyperopia and astigmatism.
The relationship between wearing spectacles and refractive error was statistically significant (p < 0.05) because most participants who had refractive error wore spectacles.
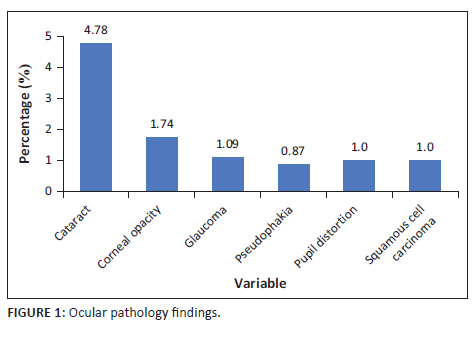
Ocular pathology
Most of participants (91.09%) had normal ocular health findings, with cataracts being the most identified pathology, found in 22 (4.78%) participants (Figure 1). One participant was suspected of having a lesion suspicious of squamous cell carcinoma of the conjunctiva, which was later confirmed through a laboratory report.
Most participants (76.95%) reported that they had to undergo a general health assessment when they had their first licenses issued. This health assessment included an 'eye examination'. However, this 'eye examination' was primarily a VA assessment. Medical doctors from both government hospitals and private practices were the most common practitioners who reportedly conducted these VA assessments, while some of the participants (12.05%) were unsure of the occupation of the person who had assessed their vision.
Factors related to safe driving
Factors relating to safe driving11 were investigated in this study. These included knowledge of traffic lights, difficulty driving at night, judging distances while driving and difficulty driving in foggy and rainy conditions. Knowledge of traffic lights was classified into, (1) knowledge of the basic colours of traffic lights (red, orange and green) and (2) the ability to identify the colours of traffic lights.
Most participants (98.26%) reported that they knew the basic colours of the traffic lights. However, 12 participants (2.61%) did not know the basic traffic light colours when asked to identify them, suggesting colours such as blue, black and white instead.
More than half of the participants (57%) reported difficulty while driving at night. On a Likert scale of 1 (poor) to 5 (excellent), all participants were asked to self-report their ability to judge distances between their car and the car in front of them when driving. Only a small percentage (4.13%) reported some level of difficulty in judging distance while driving.
When asked whether participants experienced any difficulty driving in foggy or rainy conditions, the majority (67.61%) reported no difficulty, while 5.43% of participants reported some level of difficulty when driving in foggy conditions.
Involvement in road traffic accidents
Almost half of the study sample (43.70%) reported having previously been involved in RTAs while driving, with the majority of these being male (65%). However, most of these participants (77.83%) felt that they had good vision for driving, with only 11.30% reporting that they felt they did not have good vision for driving. About 15% of those who were involved in RTAs had normal VA of 6/9 in the better eye.
History of spectacle wear
More than half of the participants (53.26%) reported that they did not wear spectacles when driving, or in general, despite 37% of these having previously been recommended to wear spectacles. Furthermore, 46.77% who reported being involved in RTA did not wear spectacles regularly when driving. Among the participants with poor VA, 32.8% wore spectacles when driving, while 28.5% did not wear spectacles when driving. Also, 29.13% of participants who had mild-to-moderate visual impairment did not use spectacles.
Discussion
The aim of the study was to assess the visual function of motor vehicle drivers in Maseru, Lesotho, to determine whether drivers possess adequate vision for driving since there are no clear national driver screening requirements in place. Most of the drivers in this study reported having some form of vision assessment prior to the initial issuance of their driving licenses. However, this assessment consisted primarily of a VA measurement and did not include other important aspects such as VF which is included in visual assessment of drivers in other countries. The VA assessments were reportedly not standardised, with different health personnel conducting this test at the hospitals and private practices and in different ways.
Although most participants felt they had good vision for driving, it is concerning that 11% felt that they did not have good vision for driving. Among those who felt they had good vision for driving, 35% passed VA test while about 43% failed VA test. It is even more concerning that while participants acknowledged their possible compromised visual status, they continued to drive, potentially posing a safety risk to themselves and others on the road. This is similar to findings in a study that investigated reasons why people continued to drive when they could not see clearly.25 The participants reported that they felt they were not obliged to drive with spectacles.25 In Lesotho, it could possibly be because optometry is still a developing profession so there is a lack of awareness of the importance of good vision in general, as well as the lack of regulations in Lesotho that prohibit drivers with poor vision from driving.
Of further concern is that almost one-third (29.13%) of participants who had mild-to-moderate visual impairment did not use spectacles. While the reasons behind participants not wearing spectacles were not investigated in this study, this finding suggests that interventions are needed to educate the public about the importance of good vision for driving, as well as the need for routine eye examinations and wearing corrective visual devices, especially when driving. Drivers in this study who did not wear spectacles (23.48%) reported having been involved in RTAs. This could possibly be due to some degree of visual function impairment, which is usually the main reason for recommended spectacle use in clinical practice.
While most participants achieved a VA of 6/9 in the better-seeing eye, which is the minimum requirement for driving in most countries, the finding that almost one-third had VA worse than 6/9 and one person had VA worse than 6/60 in their eye with the best vision is very concerning. Furthermore, half of the drivers with myopia did not wear any form of visual correction, despite their visual impairment (Table 5), which is a concern as myopia compromises driving at night.7 These findings are similar to those which have been reported in a study conducted in Nigeria.26,27 Participants with poor VA potentially have difficulty driving as they may experience challenges detecting potential hazards, as emphasised by other authors.28 Drivers with reduced VA could also have challenges in performing tasks such as reading road signs, during both daytime and nighttime driving. Furthermore, their ability to judge distances while driving could also be affected by the reduced VA.29 While the relationship between VA and RTAs was not statistically significant in this study (p > 0.26), it was almost similar to findings in a study done in Nigeria,30 where researchers found that visual impairment was not statistically associated with occurrence of RTAs. This does not take away from the importance of implementing comprehensive visual assessment of drivers in Lesotho as it would promote safety on the roads.11 Furthermore, while the results may not be statistically significant, there is a clinically significant association between VA and visual function,31,32 which is important to note, because good VA enables drivers to have good vision for driving.
Although CS function is not included in drivers' vision testing in many countries, it has been found to be associated with history of RTA involvement.33 Therefore, it was a visual function test of interest in this research. In California, participants who failed the CS test were more likely to be involved in RTAs than those who passed the test.34 In this study, more than half of participants (57%) who failed CS reported that they wore spectacles while driving, suggesting that wearing spectacles benefits drivers with CS function impairment, and therefore this study recommends that CS be included as one of the visual function tests for drivers.
Almost all the participants (99.6%) achieved a measurement of 100 degrees temporal VFs in the eye with better vision, which is above the minimum requirement for driving in most countries. However, routine screening may still be necessary to identify those who may develop reduced VF, which is associated with acquired conditions such as glaucoma. Most of the research which has assessed the relationship of VF defects and involvement in RTAs has been conducted on drivers with glaucoma.35,36 The tests used were also more comprehensive, rather than those used in screening processes. It has been found that drivers with advanced glaucoma had a higher chance of being involved in RTAs35 than drivers with normal vision. It has also been found that drivers with glaucoma were significantly less safe on the road and made more errors while driving.36 Although the current study found that less than 1% of participants had reduced temporal VF, it is important that VF assessments should be done among drivers in Lesotho as there may be drivers with incipient or advanced glaucoma on the road. Visual field defects could also affect driving abilities and put the lives of other road users in danger.
Of the 11 participants who failed the CV test, most (72.73%) were males. Among the drivers who failed the CV test, four male drivers reported being involved in RTAs. Other authors37,38 confirmed that CV defects may compromise safe driving due to difficulty in identifying road signs and seeing traffic lights. In this study, the prevalence of CV defects was found to be lower than in studies done in Nigeria30,38 where Ishihara CV plates were also used. However, even though CV is important in driving, it is not included among the visual function tests for drivers in many countries. It is therefore recommended that CV should be included among visual function tests for drivers.
The prevalence of refractive error amongst drivers in this study (38.91%) was found to be like that in Ghana.11 With regards to the link between refractive error and driving, drivers with refractive error are more likely to be involved in RTAs as compared to those without refractive error.39,40 In this study, just over one-third of the drivers with refractive errors reported to have been involved in RTAs. A significant percentage of participants with refractive error in this study reported that they do not wear spectacles while driving. Uncorrected refractive error could also contribute to difficulty driving at night, blurred vision, difficulty judging distance while driving and some level of impairment when driving in conditions such as rain and fog.41 This could imply that even if the drivers' vision is assessed and spectacle correction recommended, they may not actually wear the corrective devices, resulting in compromised vision when driving. It is therefore recommended that the importance of having good vision when driving, with or without visual correction, should be emphasised in any road safety campaigns in Lesotho. The country would also benefit from eye health promotion campaigns.
The findings of participants who reported to have been involved in RTA (44%) in this study are slightly higher than findings of other studies done in Nigeria30 and Ghana.11 This could possibly be because of the climatic differences in the three countries since the participants in Lesotho, which is a mountainous country, reported to have been involved in RTA in foggy or rainy conditions. It has also been shown that 13.92% of participants who reported a history of RTA had reduced VA and 18.7% had some form of refractive error. These results are similar to studies conducted in India41 who found the prevalence of refractive error to be just above 18% in the sample they used in their study. Similarly, other studies also found a relationship between the incidence of RTAs and reduced VA.42 This indicates that visual impairment poses a road safety hazard among motor vehicle drivers. It is therefore important to ensure that all the drivers should possess good vision.
While most participants in this study did not have identifiable ocular pathology that could impair their vision for driving, cataracts, which were found in about 5% of the participants, have a significant impact on one's quality of vision and their ability to see clearly while driving. Cataracts were also found to be the most common cause of poor vision in Nigeria43 with glaucoma the second.44 Cataracts are an unnecessary, preventable cause of visual impairment in Africa,45,46 followed by glaucoma44,45,46,47,48,49,50 of which Lesotho is part. In this study the prevalence levels of both cataracts and glaucoma were lower than in Nigeria,30 which were 14% and 11.5%, respectively. There could, however, be more drivers in Lesotho with undetected ocular pathology or other serious medical conditions such as that detected in one participant found to have a lesion suspicious of squamous cell carcinoma of the conjunctiva. Therefore, if the vision of drivers is assessed regularly by the appropriately trained personnel, such serious medical conditions could be detected and treated early, promoting the visual health of the population and safety of all road users.
Conclusion
In general, the drivers in Maseru, Lesotho, were found to have good visual function, despite the absence of clear, standardised vision screening procedures for driving. However, it is important for drivers' vision to be assessed prior to issuance or renewal of licenses in Lesotho so that visual function problems in drivers can be identified early and appropriate intervention can be taken to reduce any potential risks to road safety and road users. Standardised, comprehensive driver screening will also serve to promote and improve the eye health of Lesotho's population. It is further recommended that CS and CV be included in visual function screening requirements for drivers in Lesotho, in addition to VA and VF. The results of this study suggest that it may be important to include these tests in drivers' vision screening processes, considering the local context, specifically Lesotho's topography and road transportation usage. Furthermore, eye health promotion activities are needed in the country so that the general population understands the importance of good vision, as well as wearing corrective spectacles, both for their personal benefit and for the safety of road users when driving.
There is also a need for greater awareness around the importance of visual assessment for drivers to ensure adequate visual function of drivers in Lesotho as well as the general population. Finally, regulating screening processes and visual function standards in Lesotho could potentially reduce RTAs and minimise the related economic impact in the country.
Acknowledgements
We would like to thank the Department of Traffic and the Statistics and Road Safety departments in Lesotho for their assistance in obtaining information that is valuable to the study. We would also like to thank all participants for their time and their interest in the study.
Competing interests
The authors declare that they have no financial or personal relationships that may have inappropriately influenced them in writing this article.
Authors' contributions
The conception or design of the work, the drafting of the article as well as the data collection was the responsibility of Z.M. Both Z.M and D.v.S. were responsible for the data analysis and interpretation, the critical revision of the article, as well as the final approval of the version.
Ethical considerations
Ethical approval was obtained from University of KwaZulu- Natal (UKZN) Biomedical Research Ethics Committee (BREC) (BE023/19) and from Lesotho's Ministry of Health Research and Ethics Committee (ID164-2018).
Funding information
This research received no specific grant from any funding agency in the public, commercial or not-for-profit sectors.
Data availability
The data that support the findings of this study are available on request from the corresponding author, S.M. The data are not publicly available due to privacy and ethical restrictions.
Disclaimer
We declare that the views expressed in the submitted article are our own and not an official position of the institution.
References
1.Wales J. The political economy of road safety: A policy-oriented literature review. London: Overseas Development Institute; 2017. [ Links ]
2.World Health Organization. Global status report on road safety 2015. Geneva: World Health Organization; 2015. [ Links ]
3.World Health Organization. The global burden of diseases 2004 update [homepage on the Internet]. Geneva: World Health Organization; 2008 [cited 2019 Aug 07]. Available from: http://www.bergfiles.com/i/bf4a0e04b9h32i0 [ Links ]
4.Huvarinen Y, Svatkova E, Oleshchenko E, et al. Road safety audit. Transp Res Proc. 2017;20:236-241. https://doi.org/10.1016/j.trpro.2017.01.061 [ Links ]
5.Jindal AK, Mukherji S. World report on road traffic injury prevention. Med J Armed Forces India. 2005;61(1):91. https://doi.org/10.1016/S0377-1237(05)80135-2 [ Links ]
6.Colenbrander A. Visual functions and functional vision. Int Congr Ser. 2005;1282:482-486. https://doi.org/10.1016/j.ics.2005.05.002 [ Links ]
7.Burg A. Vision and driving: A report on research. Hum Factors. 1971;13(1):79-87. https://doi.org/10.1177/001872087101300110 [ Links ]
8.Austroads. Assessing fitness to drive for commercial and private vehicle drivers. Sydney: Austroads; 2017. [ Links ]
9.Taylor JF. Vision and driving. Ophthalmic Physiol Opt. 1987;7(2):187-189. https://doi.org/10.1111/j.1475-1313.1987.tb01018.x [ Links ]
10.Bener A, Ahmad M, El-Twail MS, et al. Visual impairment and motor vehicle accidents. Middle East J Emerg Med. 2004;4(1):39-43. [ Links ]
11.Boadi-Kusi SB, Kyei S, Asare FA, et al. Visual function among commercial vehicle drivers in the central region of Ghana. J Optom. 2016;9(1):54-63. https://doi.org/10.1016/j.optom.2015.06.004 [ Links ]
12.Owsley C, McGwin G, Jr. Vision impairment and driving. Surv Ophthalmol. 1999;43(6):535-550. https://doi.org/10.1016/S0039-6257(99)00035-1 [ Links ]
13.Adams S. Driver fitness evaluation with respect to vision. Cape Town: Occupational Health Southern Africa, 2011; p. 22-27. [ Links ]
14.Traffic Department of Lesotho. Driver's licenses issued. Maseru: Lesotho Traffic Department; 2016. [ Links ]
15.Lesotho Department of Road Safety. Research and statistics section 2017 report. Maseru: Lesotho Road Safety; 2017. [ Links ]
16.Aeron-Thomas A, Astrop A, Jacobs G. Estimating global road fatalities. TRL report 445. London: Transport Research Laboratory (TRL); 2000. [ Links ]
17.Chakrabarty N, Lakshman A, Gupta K, et al. Visual challenges among drivers: A case study in Delhi, India. Int J Innov Res Sci Eng Technol. 2013;2(7):3074-3083. [ Links ]
18.Chidi-Egboka NC, Bolarinwa OA, Awoyemi AO. Visual function test among commercial drivers in a north central state of Nigeria. Health Sci J. 2015;9(6):1-7. [ Links ]
19.Wu JF, Bi HS, Wang SM, et al. Refractive error, visual acuity and causes of vision loss in children in Shandong, China. The Shandong Children Eye Study. PLoS One. 2013;8(12):e82763. https://doi.org/10.1371/journal.pone.0082763 [ Links ]
20.McKean-Cowdin R, Cotter SA, Tarczy-Hornoch K, et al. Prevalence of amblyopia or strabismus in Asian and non-Hispanic white preschool children: Multi-ethnic pediatric eye disease study. Ophthalmology. 2013;120(10):2117-2124. https://doi.org/10.1016/j.ophtha.2013.03.001 [ Links ]
21.Wen G, Tarczy-Hornoch K, McKean-Cowdin R, et al. Prevalence of myopia, hyperopia, and astigmatism in non-Hispanic white and Asian children: Multi-ethnic pediatric eye disease study. Ophthalmology. 2013;120(10):2109-2116. https://doi.org/10.1016/j.ophtha.2013.06.039 [ Links ]
22.World Health Organization. Vision impairment and blindness [homepage on the Internet]. Fact Sheet. 2017 [cited 2019 Jul 15]. Available from: http://www.who.int/mediacentre/factsheets/fs282/en/. [ Links ]
23.Ishihara S. Test for color-blindness. Tokyo: Kanehara; 1987. [ Links ]
24.Test LC. Contrast sensitivity. Eligin, IL: Good-Lite; 1988. [ Links ]
25.Fylan F, Hughes A, Wood JM, et al. Why do people drive when they can't see clearly? Transp Res. 2018;56:123-133. https://doi.org/10.1016/j.trf.2018.04.005 [ Links ]
26.Boyce PR. Lighting for driving: Roads, vehicles, signs, and signals. London: CRC Press; 2008. [ Links ]
27.Visuelle A, Pratiques Dangereuse S, De ND, et al. Visual acuity, safe/unsafe practices and self-reported road traffic crash experiences among commuter bus drivers from two motor parks in Lagos, Nigeria. West Afr J Med. 2015;34(2):118-124. [ Links ]
28.Owsley C, Stalvey BT, Wells J, et al. Visual risk factors for crash involvement in older drivers with cataract. Arch Ophthalmol. 2001;119(6):881-887. https://doi.org/10.1001/archopht.119.6.881 [ Links ]
29.McKnight AJ, Shinar D, Hilburn B. The visual and driving performance of monocular and binocular heavy-duty truck drivers. Accid Anal Prev. 1991;23(4):225-237. https://doi.org/10.1016/0001-4575(91)90002-M [ Links ]
30.Pepple G, Adio A. Visual function of drivers and its relationship to road traffic accidents in Urban Africa. Springerplus. 2014;3(1):47. https://doi.org/10.1016/0001-4575(91)90002-M [ Links ]
31.Dairo MD, Okechukwu-Nwankpa UP, Nwankpa R. Survey on visual acuity among intra-city commercial vehicle drivers in Ibadan, southwestern Nigeria. J Public Health Afr. 2019;10(1):789. https://doi.org/10.4081/jphia.2019.789 [ Links ]
32.Onabolu OO, Bodunde OT, Otulana TO, et al. Visual acuity of commercial motor drivers in Ogun State of Nigeria. Niger Postgrad Med J. 2012;19(4):225-229. https://doi.org/10.4103/1117-1936.169549 [ Links ]
33.Hennessy DF. Vision testing of renewal applicants: Crashes predicted when compensation for impairment is inadequate. Sacramento, California: Department of Motor Vehicles, Research and Development Section; 1995. [ Links ]
34.Hennessy DF, Janke MK. Clearing a road to being driving fit by better assessing driving wellness: Development of California's prospective three-tier driving-centred assessment system. Sacramento, California: Department of Motor Vehicles; 2009. [ Links ]
35.Kunimatsu-Sanuki S, Iwase A, Araie M, et al. An assessment of driving fitness in patients with visual impairment to understand the elevated risk of motor vehicle accidents. BMJ Open. 2015;5(2):e006379. https://doi.org/10.1136/bmjopen-2014-006379 [ Links ]
36.Wood JM, Black AA, Mallon K, et al. Glaucoma and driving: On-road driving characteristics. PLoS One. 2016;11(7):e0158318. https://doi.org/10.1371/journal.pone.0158318 [ Links ]
37.Freeman EE, Munoz B, Turano KA, et al. Measures of visual function and their association with driving modification in older adults. Invest Ophthalmol Vis Sci. 2006;47(2):514-520. https://doi.org/10.1167/iovs.05-0934 [ Links ]
38.Emerole CG, Nneli RO. Visual indices of motor vehicle drivers in relation to road safety in Nigeria. Niger J Physiol Sci. 2013;28(1):57-62. https://doi.org/10.4103/1596-2393.127962 [ Links ]
39.Biza M, Mossie A, Woldemichael K, et al. Visual impairment and road traffic accidents among drivers in Jimma Town, Southwest Ethiopia. Ethiop Med J. 2013;51(2):123-132. [ Links ]
40.Ovenseri-Ogomo G, Adofo M. Poor vision, refractive errors and barriers to treatment among commercial vehicle drivers in the Cape Coast municipality. Afr Health Sci. 2011;11(1):97-102. [ Links ]
41.Verma A, Chakrabarty N, Velmurugan S, et al. Assessment of driver vision functions in relation to their crash involvement in India. Curr Sci. 2016;110(6):1063-1072. https://doi.org/10.18520/cs/v110/i6/1063-1072 [ Links ]
42.Rubin GS, Ng ES, Bandeen-Roche K, et al. A prospective, population-based study of the role of visual impairment in motor vehicle crashes among older drivers: The SEE study. Invest Ophthalmol Vis Sci. 2007;48(4):1483-1491. https://doi.org/10.1167/iovs.06-0474 [ Links ]
43.Rabiu MM. Cataract blindness and barriers to uptake of cataract surgery in a rural community of northern Nigeria. Br J Ophthalmol. 2001;85(7):776-780. https://doi.org/10.1136/bjo.85.7.776 [ Links ]
44.Anstey KJ, Eramudugolla R, Ross LA, et al. Road safety in an aging population: Risk factors, assessment, interventions, and future directions. Int Psychogeriatr. 2016;28(3):349-356. https://doi.org/10.1017/S1041610216000053 [ Links ]
45.Lewallen S, Courtright P. Blindness in Africa: Present situation and future needs. Br J Ophthalmol. 2001;85(8):897-903. https://doi.org/10.1136/bjo.85.8.897 [ Links ]
46.Lee CM, Afshari NA. The global state of cataract blindness. Curr Opin Ophthalmol. 2017;28(1):98-103. https://doi.org/10.1097/ICU.0000000000000340 [ Links ]
47.Tham YC, Li X, Wong TY, et al. Global prevalence of glaucoma and projections of glaucoma burden through 2040: A systematic review and meta-analysis. Ophthalmology. 2014;121(11):2081-2090. https://doi.org/10.1016/j.ophtha.2014.05.013 [ Links ]
48.Kyari F, Abdull MM, Sallo FB, et al. Nigeria National Blindness and Visual Impairment Study Group. Nigeria normative data for defining glaucoma in prevalence surveys. Ophthalmic Epidemiol. 2015;22(2):98-108. https://doi.org/10.3109/09286586.2015.1012268 [ Links ]
49.Budenz DL, Barton K, Whiteside-De Vos J, et al. Prevalence of glaucoma in an urban West African population: The Tema Eye Survey. JAMA Ophthalmol. 2013;131(5):651-658. https://doi.org/10.1001/jamaophthalmol.2013.1686 [ Links ]
50.Cook C. Glaucoma in Africa: Size of the problem and possible solutions. J Glaucoma. 2009;18(2):124-128. https://doi.org/10.1097/IJG.0b013e318189158c [ Links ]
 Correspondence:
Zubeta Moledi
zubeta_moledi@icloud.com
Received: 28 July 2022
Accepted: 24 Apr. 2023
Published: 19 Sept. 2023

