


Services on Demand
Article
 English (pdf)
 Article in xml format
 Article references
Indicators

Related links
-
 Cited by Google
 -
 Similars in Google
Share

 Permalink
South African Computer Journal
On-line version ISSN 2313-7835
Print version ISSN 1015-7999
SACJ vol.35 n.1 Grahamstown Jun. 2023
http://dx.doi.org/10.18489/sacj.v35i1.961
RESEARCH ARTICLE
Traffic control centre optimisation on South African freight corridors through intelligent weigh-in-motion
A. de ConingI; A.J. HoffmanI; F. MoutonII
INorth-West University, Potchefstroom, South Africa. Electrical, Electronic, and Computer Engineering. Email: A. de Coning - arnodeconing@gmail.com (corresponding); A.J. Hoffman - alwyn.hoffman@nwu.ac.za
IIUniversity of the Western Cape, Bellville, South Africa. Department of Computer Science. moutonf@gmail.com
ABSTRACT
High quality road infrastructure is essential to support economic growth for any region. For South Africa's landlocked economic hub 79% of goods are transported using roads infrastructure. Protection of the road infrastructure is implemented by means of overload control monitoring at traffic control centres (TCCs) on freight corridors. Statistics collected from TCC operations indicate that 75% to 85% of statically weighed vehicles are legally loaded, with the implication that unnecessary time was wasted for these vehicles. This paper therefore proposes an algorithm, called the intelligent weigh-in-motion (IWIM) algorithm, with the purpose to decrease static weighing of vehicles by implementing data sharing between TCCs on the freight corridor, combined with intelligent interpretation of this data. The selected algorithm was chosen after testing multiple artificial intelligence (AI) models (logistic regression, random forest tree, and artificial neural network) to achieve the best performance to decrease static weighing of vehicles while not increasing the number of overloaded vehicles allowed to proceed on the corridor. The best performing model to differentiate between overloaded and legal vehicles, random forest tree, achieved an average improvement of 65,83% in terms of vehicles to be statically weighed when compared to the current rule-based system employed at TCCs.
CATEGORIES: · Applied computing ~ Transportation
Keywords: Traffic control, overload control, freight corridor, intelligent weigh-in-motion
1 INTRODUCTION
South Africa is in dire need of expanding our exporting capability to support economic growth (Pedersen, 2007; Rodrigue, 2007; Turnbull, 2015). Most economic activities resulting in exports take place in landlocked regions, including Gauteng, which is the economic hub of the country and produces most manufactured goods. In a wider context, various countries within the Southern African Development Community (SADC) region, like Botswana, Zimbabwe, and Zambia, are landlocked and are therefore dependent on road and rail transport to facilitate supply chain operations (de Coning & Hoffman, 2014; Hoffman et al., 2013; Pricewaterhouse-Coopers, 2013). Declining rail infrastructure over the past decades will require extensive upgrading and revamping to become viable for large-scale transportation (Jorgensen, 2013; Marsay, 2013; Van der Mescht, 2006). Road transport is thus the predominant means for the region with 79% of delivery by road and 21% by rail (Jorgensen, 2013). The focus then turns to road transportation to deliver freight within the region.
Road transport is the dominant mode of land transport for export goods, including mining, agricultural, and manufactured goods. The quality of the national road network has a huge impact on the effectiveness of trade corridors that link areas of production with seaports. Road infrastructure (de Coning & Hoffman, 2014; Hoffman et al., 2013), border post operation (Bhero & Hoffman, 2013), and regional law enforcement efficiency are of utmost importance in the region's supply chains (Bosman & D'Angelo, 2011). Freight logistics within the South African context also have to take the SADC region into account. This is due to the fact that high volumes of cross-border freight are transported on multiple freight corridors to link the five landlocked countries in the region to seaports. The North-South corridor, terminating in Durban as a major seaport, spans in excess of 10 500 kilometre (km) with 18% of the corridor in South Africa (Odoki et al., 2009). Previous studies have specifically emphasised the importance of an efficient North-South corridor for the region (Odoki et al., 2009). Historic investment, annual maintenance, and upgrades have converted the South African road infrastructure into a 1 trillion South African Rand (ZAR) asset (Mitchell, 2013). This infrastructure is a catalyst to ensure commerce and economic growth in any region. It is thus of utmost importance to ensure the infrastructure is protected and legislation is implemented to achieve this protection.
1.1 Legislation
There are already mechanisms in place to ensure the protection of road infrastructure. This is achieved by a regulation from the government that states the maximum loading capacity of axles, a minimum driving axle, actual vehicle combination mass (AVCM) or gross vehicle mass (GVM), and load limits of tyres of a vehicle travelling on the road infrastructure (Department of Transport, 2004). The annual damage to the road network is estimated at ZAR 600 million (1997 value) (Department of Transport, 2004). The Council for Scientific and Industrial Research (CSIR) stated that ZAR 2 155 million is spent per annum on road construction and maintenance (CSIR, 1997). Taking the historic inflation into account over the years the annual damage is in excess of ZAR 1 500 million and the CSIR annual maintenance value is at over ZAR 5 500 million without taking into account the increase in heavy vehicle traffic on the roads of South Africa (Inflation.EU, 2016). This value is confirmed from SANRAL annual reports with maintenance cost stated as ZAR 6 276 million for the 2018/19 financial year and ZAR 6 984 million for 2017/18 (SANRAL, 2019). This is an estimated cost of only repairing a road after the damage has taken place and does not consider the additional impact of poor road conditions on the quality of life of the general population in terms of life safety, vehicle maintenance cost increases, etc. The National Department of Transport (DOT) has stated in (Department of Transport, 2004): "It is, therefore, essential that effective law enforcement be carried out throughout South Africa in order to stop this economic sabotage and protect the country's most valuable asset - its road network".
Vehicle classification for the purpose of overload control is different for different end-user categories and regulations, therefore, referring to the specific vehicle type/configurations. Understanding the codes used to identify these categories is important for future data collection and interpretation. There are 17 classifications in this scheme, based on the 1998 revision, that range from motorcycles to long trucks. Trucks are classified under heavy vehicles that range from short trucks, two axle vehicles, to long eight or more-axle multi-trailer trucks (Mikros Systems, 1998; Smith & Visser, 2001). The legislation allows for a specific maximum permissible mass per vehicle type applicable for South African roads. To understand the importance of overload control the impact of overloaded vehicles on roads needs to be investigated.
1.2 Impact of overload control
From the above discussion, it is clear that road freight logistics is essential not only in South Africa but also in the SADC region. It is however a reality that profit margins in the logistics sectors are slim, and that competition is sometimes ruthless, which causes some transporters to overload their vehicles without considering the consequences on the road infrastructure. Overloading of vehicles occurs to leverage additional income on a trip without consideration of the damage it may cause to the road infrastructure. There is an extreme impact on other industries and the economy of a country if the road infrastructure is damaged, as the economy can come to a complete halt if the transport industry is no longer functional. It is therefore important to understand the damage that is caused by overloaded vehicles. It often happens that overloaded vehicles tend to travel the roads less travelled by making use of secondary roads. These roads are not designed to carry heavy vehicles and do not have concessionaires to regularly maintain them.
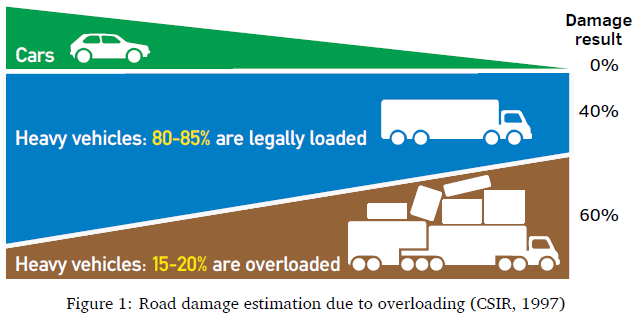
Studies have shown that 60% of road damage can be done by only 15 - 20% of vehicles being overloaded (CSIR, 1997). Furthermore, vehicles overloaded by 20% can decrease a road surface lifetime by more than 50%, as visually Figure 1 (Salama et al., 2006).
The need to protect the road infrastructure has however resulted in an overload control system that will statically reweigh legally loaded vehicles, that are loaded close to permissible limits, several times on the same corridor trip causing multiple delays (Hoffman & de Coning, 2014; SANRAL, 2017, 2018, 2019). Historical statistics have shown that a large number of vehicles (80% - 85%) are being weighed at static scales when legally loaded. This represents a significant negative impact on the economy, taking into account that around 1.7 to 1.8 million vehicles are statically weighed annually in South Africa (SANRAL, 2017, 2018, 2019).
Road surface damage is not the only impact overloaded vehicles will cause; it is however the easiest to observe. The operating cost of heavy vehicles tends to increase by 12.8% when vehicles operate on a deteriorated road infrastructure (Steyn & Haw, 2005). Overloaded vehicles operate outside the design specifications of vehicle manufacturers. These vehicles have an increased chance to be involved in accidents (Department of Transport, 2004). The annual cost due to road accidents has been estimated to be ZAR 142.95 billion which equates to 3.4% of South Africa's GDP (Labuschagne et al., 2017). The facts indicate that only 4.8% of accidents involve heavy vehicles, but unfortunately, these accidents cause a large number of fatalities when they do occur (MiWay, 2016; Stoltz, 2016). There is an extensive impact on the economy that includes police time, clearing the accident scene, lost work hours of workers stuck in traffic, and delayed delivery of goods (MiWay, 2016).
1.3 Traffic Control Centres
The enforcement of overload control rules is implemented at TCCs that are situated across the major freight corridors in South Africa. As an improvement of current TCC operations can only be done by investigating these operations, this section covers a case study of a TCC in South Africa.
Multiple TCCs are implemented across South Africa to ensure the protection of the road infrastructure. They are in most cases implemented on toll roads operated by different toll concessionaires servicing different national and regional roads. South African National Roads Agency SOC Ltd (SANRAL) has 13 TCCs that are operated by toll concessionaires and 16 satellite sites (SANRAL, 2017, 2018, 2019). The one big drawback in the design of the overload control network is that the different TCCs work in complete isolation from the TCCs up- or downstream on the same corridor (de Coning & Hoffman, 2016; Hoffman & de Coning, 2014; Hoffman et al., 2013).
Investigation of the sites has identified certain inefficiencies or shortfalls within the current overload management, which negatively affects the operational cost and time delays experienced by legally loaded freight vehicles. From the perspective of considering the entire freight corridor as a single system, inefficiencies are apparent when taking into account that most vehicles travel past several TCCs on one journey. Vehicles are required to travel over a weigh-in-motion (WIM) scale and be directed to the static scale or corridor based on the weight observed at the WIM. Communication between isolated TCCs within the corridor context is absent, as there is no real-time data sharing between TCCs. Avoidable delays occur for legally loaded vehicles loaded close to the maximum loading capacity as such vehicles trigger the WIM threshold at several consecutive TCCs on their journey. This results in multiple static weighing of vehicles loaded close to the legal limit. It also leads to increased corruption levels due to increased contact time between truck drivers and potentially corrupt officials for vehicles that are overloaded. Potential overloaded vehicles are provided with the opportunity of skipping a queue at a TCC due to other legally loaded vehicles backing up onto the highway while being weighed. Some TCCs do not operate during night time, causing so-called fly-by-night companies to dispatch overloaded vehicles during these off-duty hours. Authorities have tried to counter some of these practices by providing traffic officials on duty with a specific daily quota of vehicles to be directed toward the static scale. In order to complete these quotas as early in the morning as possible, many traffic officials however apply the practice to also direct vehicles that did not trigger the WIM scale towards the static scale. The combined effect of these phenomena is a generally low level of efficiency of the overload control system.
The impact of the inefficient operations does not only affect the freight vehicle and TCC operation but also ripples through the entire supply chain, impacting all stakeholders including cargo owners, transport operators, truck drivers, road agencies, toll concessionaires, cross border agencies, port authorities, revenue services, cargo consignees and finally the consumer.
1.4 Artificial intelligence application
AI development has improved over the last few decades and has become a common occurrence without being obvious to the general public (De Raedt et al., 2016). Natural language processing is an example of the application of AI where a mobile phone can react to voice commands and understand the instructions to start phone calls, set reminders, or start navigation tools (Goldberg, 2017; Zhang et al., 2021). Backend analytics are used in large corporations like Facebook and Google to predict market trends or understand their users to implement target advertising (Zhang et al., 2021). AI implementations are used to improve cities and evolve them into smart cities or even develop self-driving cars (Liu et al., 2018; McClellan et al., 2018). Improving business operations is another typical application of AI that ranges from optimising warehouse flows or detecting water leaks within a water leak detection system (de Ponteves & Eremenko, 2018; de Coning & Mouton, 2020).
Within AI, machine learning is a mechanism to process large amounts of data, more than what a human can process, in order to extract some knowledge to improve real-world and real-time decision-making (Campesato, 2020; Joshi, 2017; Raschka, 2016). Data gathering specifically for overload control can be implemented by means of WIM scales with the purpose of reducing vehicles required to be statically weighed (de Coning, 2022). TCCs that attempt to weigh all vehicles statically without making use of a WIM often cause extreme congestion resulting in vehicles that need to bypass the site (Shinohara et al., 2016). WIM scales are often used on a corridor to gather specific vehicle information that is relayed to law enforcement officials to take appropriate legal action (Capecci & Krupa, 2009; Green et al., 2002). Within the field overload control AI applications have been used to predict static scale weights by making use of previous TCC data to determine if the vehicle is within permissible limits (Bwire, 2019; de Coning, 2022). When a vehicle is predicted to be within limits it will not be subjected to mandatory checks at the TCC thus improving efficiency (Bwire, 2019). Performance testing of multiple AI models within the Waikato Environment for Knowledge Analysis (WEKA) had an 88% accuracy on predictions of a vehicle being overloaded or not overloaded (Bwire, 2019). This is however site-specific and all these applications indicate that an AI application can have significant benefits with implementation on the freight corridor as proposed in Section 2.4.
1.5 Problem statement
The problem is that the current overload control system in South Africa weighs an excess number of correctly loaded vehicles and this negatively impacts the whole supply chain. This article aims to address this problem by proposing an intelligent weigh-in-motion (IWIM) algorithm. This algorithm will be designed to have the ability to differentiate between legally and illegally loaded vehicles, in order to reduce the static weighing of vehicles that are legally loaded, while at the same time limiting the number of overloaded vehicles that are allowed to proceed on the corridor. This is achieved by optimising the accuracy of systems decision-making with minimal additional capital outlay and no TCC layout changes required. This approach is intended to reduce negative impacts on multiple stakeholders while still reliably protecting the road infrastructure.
The rest of the paper is structured as follows. Section 2 provides an overview of the case study that was used to optimise the current system being used at the TCC operations. This section also describes how the TCC data that was collected provides an accurate dataset representative of real-world behaviour. This data set will be used for the training and validation of the IWIM algorithm. Section 3 proposes an IWIM model to classify whether a vehicle is overloaded or not by making use of previously collected data on the corridor. Section 4 concludes the paper and discusses planned future work.
2 CASE STUDY TOWARDS OPTIMISING TCC OPERATIONS
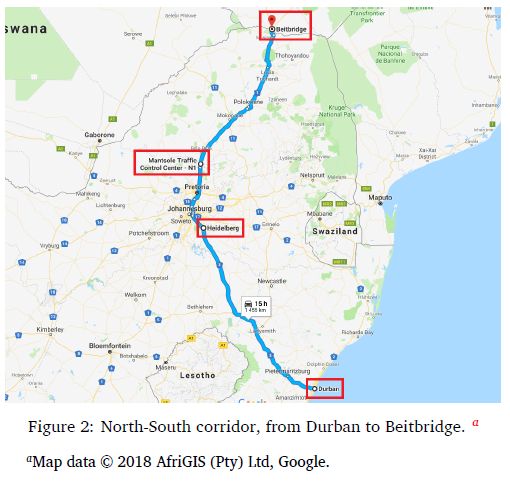
A case study was conducted at the Mantsole and Heidelberg TCCs on the North-South corridor within South Africa to understand the operational flow of these sites. These TCCs were selected as they directly follow each other on the N3-N1 corridor that links the port of Durban to Gauteng and to the Beitbridge border post, which is South Africa's busiest road border post for freight traffic. The operational flow of these individual TCCs is constructed to successfully direct vehicles loaded close to the legal threshold to the static scale. Most TCC designs include a screener lane with a WIM scale that directs a vehicle to the static scale if a weight threshold is triggered. This threshold for a WIM scale is typically 10% below the legal limit due to inaccuracies in the WIM scale. As the static scale has a higher accuracy only a static scale measurement can be legally used to prosecute a vehicle that is overloaded.
2.1 Status quo for overload control
The current TCCs are operated by multiple toll concessionaires, each of which has a public-private partnership (PPP) agreement with SANRAL. Each, however, has its own data management structure with the data sets isolated between TCCs as they are operated independently. Existing systems do not implement integrated overload control for an entire corridor but handle overload control on an isolated basis at each TCC. The normal rule that is applied at existing TCC systems is as follows: the axle configuration of the vehicle is first determined based on the consecutive sets of wheels passing the WIM scale. For each type of axle configuration, a specific threshold is applied; should this threshold be exceeded, the system will determine that the vehicle is potentially overloaded and should be weighed statically at a scale forming part of the same TCC. As a WIM scale is not as accurate as a static scale that has been correctly calibrated, the WIM scale measurement cannot be used for prosecution; furthermore, the expected error made by the WIM scale must be incorporated into the rule that is applied at the WIM scale, based on which it is decided whether to guide the vehicle to the static scale for a more accurate measurement. A vehicle is marked as overloaded if an axle weight, normalised against the permissible mass, is above 0.9 as indicated in Equation 1.

It is therefore possible that a vehicle that is within the legal weight limits will still trigger the WIM scale rule that will guide it to the static scale. Based on the result of the static weighing of the vehicle the owner of the vehicle may be prosecuted if it is found to be over the legally allowed weight limit for that axle configuration, and the vehicle may be impounded until its weight has been corrected. As many transporters load vehicles to very close to the legal weight limits, the situation currently exists where the majority of vehicles triggering the WIM scale rule are in fact not overweight and are therefore unnecessarily guided to the static scale. This tends to repeat itself at each weighbridge on the same corridor for the same vehicle, as each WIM scale will tend to produce the same result. These status quo (SQ) practices have the implication that the vehicle is subjected to many unnecessary static weighing actions.
2.2 Industry data acquisition
Optimising freight corridor TCC operations requires analysis of the current data sources available. Multiple sources were collected that include traffic volumes, vehicle classification, WIM data, and static scale data on the South African freight corridors. Annual reports from SAN-RAL describe the statistics from TCCs across the country and clearly indicate that most vehicles that are statically weighed are within legal limits. SANRAL annual reports indicate this varies from 75% - 85%; this is the number that the proposed optimisation intends to decrease while ensuring overloaded vehicles are not sent to the corridor incorrectly (SANRAL, 2017, 2018, 2019).
An accurate representation of freight corridor activities can only be obtained by consolidating data from different industry sources. This consolidation will allow the construction of the inputs required by the algorithm with the goal of improving existing operations. Data sharing between TCCs, or "de-isolation", is a key requirement before the algorithm can be implemented in a real-world solution. The outcome of the algorithm will be to decide whether a vehicle could be overloaded since it was previously seen at an upstream TCC. The Mant-sole and Heidelberg TCCs were selected to supply the input data. These TCCs are sequential sites on the North-South corridor. The SANRAL study included the North-South Corridor from Durban along the N3, merging with the N1 towards the Beitbridge border post. An overview of the corridor is indicated in Figure 2.
The data time range and general statistics of the data sets are required to determine the overlap. The North-bound (NB) data sets for WIM and static scales at both the Mantsole and Heidelberg sites are firstly analysed. This is then followed by the same process for the Southbound (SB) WIM and static scale data at Heidelberg and Mantsole.
Data available for this time period were:
• Static scale data - Mantsole NB and SB
• Static scale data - Heidelberg NB and SB
• WIM scale data - Mantsole NB and SB
• WIM scale data - Heidelberg NB and SB
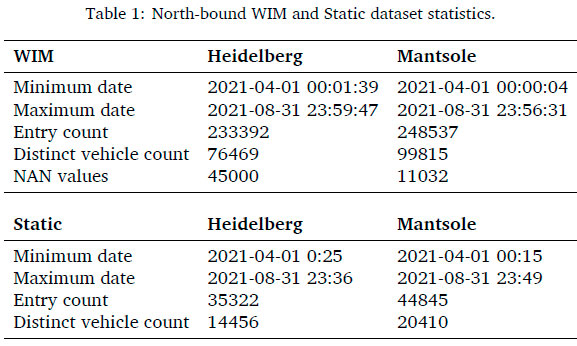
The NB data statistics are indicated in Table 1 with an overlap in data from 2021-04-01 to 2021-08-31 at both sites. Data provided from the WIM data set contained just below 482 000 vehicle weigh entries and just above 176 000 distinct vehicles in the time period. The static scale data had just above 80 000 vehicles statically weighed and just below 35 000 distinct vehicles. The WIM automated number plate recognition (ANPR) linking was unsuccessful with a NAN entry on just above 56 000 entries. This unsuccessful ANPR linking will ensure an accurate vehicle linking cannot be made and thus the current WIM scale data cannot be used with previous WIM scale data points to make a more informed decision.
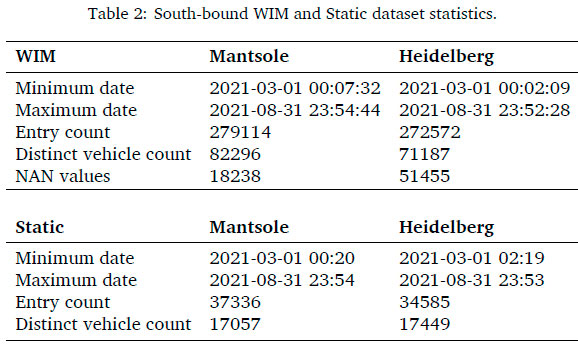
The SB data statistics are indicated in Table 2 with an overlap in data from 2021-03-01 to 2021-08-31 at both sites. The WIM data set contained just above 551 000 vehicle weigh entries and just above 153 000 distinct vehicles in the time period. The static scale data had just below 72 000 vehicles statically weighed and just above 34 000 distinct vehicles. The WIM ANPR linking was unsuccessful with a NAN entry on just below 70 000 entries.
The statistics of the overlapping data will give some additional insight into the traffic going past the TCC and what was directed to be statically weighed. The percentage of NB traffic directed to the static scale at Heidelberg was 15.13% and 18.04% at Mantsole. SB traffic had 13.38% directed to the static scale at Mantsole with 12.69% at Heidelberg. The next step in the process of constructing the input data set is to reliably link the data. This is essential and may be challenging when considering that WIM data sets had as much as 19.28% NAN or no registration information to be used for linking purposes.
2.2.1 Vehicle linking
Reliable linking of vehicle records is essential as previously discussed. Linked vehicles had to be correctly identified at both WIM and at both static scales for a given direction of travel: the WIM scale measurements are used as inputs for the decision algorithms, and the static scale measurements are required to determine the true outcomes for vehicles (overloaded or not) and the time differences between the WIM scales are used to determine if the previous sighting happened within the last 24 hours. The real-world data linking is thus a critical process step. The steps are firstly taken for the NB direction with a vehicle travelling between Heidelberg (as Site 1 NB) and Mantsole (as Site 2 NB). The SB direction will be for the reversal with vehicles travelling between Mantsole (as Site 1 SB) and Heidelberg (as Site 2 SB). Vehicle records for WIM and static scales are linked in the static scale data set and are used in the linking process. The process to link vehicle records for WIM and static scales is described as follows:
• Determine the vehicle registration number to be used as an identifier.
• Search the following site records for the same identifier.
• Determine the time variance between entries.
• Store values that have travelled between sites in the past 24 hours.
The values stored for the linking process are as follows for both Site 1 and Site 2:
• Vehicle identifier
• Date and time
• WIM axle configuration
• WIM axle count
• WIM axle unit weights
• WIM AVCM
• Travelling speed over WIM
• Static scale axle configuration
• Static scale axle count
• Static scale axle unit weights
• Static scale AVCM
• Static scale axle unit permissible weights
• Static scale permissible AVCM
• Overload status
• Site identifier
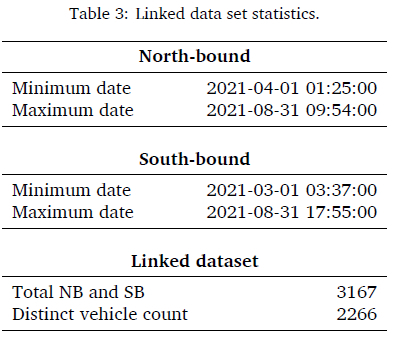
The linking process resulted in a total of 3 167 entries when combining NB and SB traffic. A total of 2 226 distinct vehicles were captured with the results in Table 3.
The linked data set had a total of 17 vehicles or 0.54% that were not overloaded at Site 1 and overloaded at Site 2. Another scenario was tested on 20 vehicles or 0.64% overloaded at Site 1 and not overloaded at Site 2. This will allow vehicles that corrected their loads at Site 1 to not be directed to the static scale at Site 2.
When training AI models on a data set where the observations with overloaded inputs or outcomes represent a small minority of the total training set, the training process tends to ignore the overloaded observations. By duplicating the small number of data points where vehicles were overloaded, we constructed an extended set that is called the padded data set. This allowed us to train the model on a more balanced data set where correct decision-making for both outcomes will be learned. This padded data set had 3692 data entries with an increase from 0.54% overloaded vehicles to 7.37% or from 17 vehicles to 272.
2.3 Rule-based performance
Any improvement against the current operations will first require an analysis of the SQ performance. The SQ rule-based system currently implemented determines whether a vehicle's WIM mass was potentially overloaded and whether it should be directed to the static scale. The WIM threshold is set at 10% from the maximum allowed mass or 90% of the legally permissible mass to determine if a vehicle will be directed to the static scale. This meant that a legally loaded vehicle that is loaded close to the permissible mass was directed to the static scale to determine its statically weighed load, even though it was not over the limit. The purpose of the AI model developed Section 2.4 is to decrease the number of legally loaded vehicles that are statically weighed.
Implementation of the rule-based system simply checked whether the maximum value for any axle and AVCM mass was above the threshold and mark it as overloaded. The steps were as follows:
• Determine the maximum of WIM axle masses and AVCM.
• Determine whether the load is more than 0.90 of the permissible mass.
• Direct to the static scale for mass above 0.90.
• Direct to the corridor for mass below 0.90.
The first rule-based performance was applied to the current site's WIM to determine the number of vehicles incorrectly directed to the static scale. The performance of the newly developed models was measured against this to determine whether it improved (reduced) the number of vehicles incorrectly sent to the static scale as indicated Equation 1.
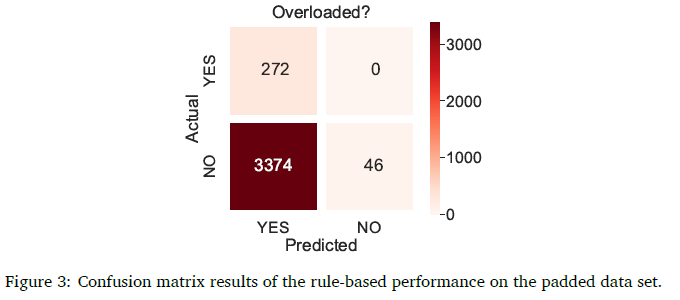
The results of the rule-based performance testing implemented on the padded data set are shown in Figure 3 as a confusion matrix. YES indicates an overloaded vehicle and NO a non-overloaded vehicle. Rule-based 1 sent 91.39% of vehicles (3374 of 3692) incorrectly to the static scale (false positive).
The second Rule-based model still used rule-based decision-making but had access to data that was shared between the TCCs. It, therefore, used WIM mass from the current and the previous TCC. The performance of the developed models will also be tested against this performance. The rule simply checked the maximum value in the measured data of both sites and marked a vehicle as overloaded if the value was above 0.90.
Another aspect to be tested was the impact of the adjusted threshold of the WIM. This added an additional dimension of testing to vehicles specifically not overloaded at Site 1 and increased the WIM threshold to a normalised axle and AVCM at Site 2. It was expected that the adjusted threshold would decrease the number of vehicles sent to the static scale. Achieving this would require data sharing between sites. The WIM thresholds were adjusted only for a non-overloaded state at Site 1 for this additional test. The current rule-based system is directed to the static scale vehicles within 10% of permissible mass or normalised weight above 0.90. The testing of the adjusted threshold was first to gradually increase the threshold to 1.00 from the current SQ threshold of 0.90. Additional testing was conducted by adjusting the threshold closer to the permissible mass as follows:
• Rule-based model 3: WIM weight threshold adjusted to normalised 0.95
• Rule-based model 4: WIM weight threshold adjusted to normalised 0.98
• Rule-based model 5: WIM weight threshold adjusted to normalised 1.00
These thresholds were purely incremental increases to determine the improvement on the SQ performance but testing was also conducted on the data sets to determine the accuracy between the WIM and static scale. The linked values from all the WIM and static scales at Mantsole and Heidelberg in both NB and SB directions were individually analysed for the deviation between the WIM and the static scale. The average discrepancies in both directions were combined and Heidelberg had an average difference of 4.2%, where the WIM weight was lower than the static scale. Mantsole had an average of -5.41%, that is, the WIM weight was higher than the static scale. These two values were tested as additional rule-based scenarios as follows:
• Rule-based model 6: WIM weight threshold adjusted to normalised 1.0541
• Rule-based model 7: WIM weight threshold adjusted to normalised 0.958
The performance of the rule-based approaches is compared in Table 4. The results indicate an increase in accuracy as the threshold is adjusted but also an increase in vehicles incorrectly directed to the corridor. The confusion matrix results are displayed in terms of accuracy and the percentage of overloaded vehicles incorrectly sent to the corridor (false negative).
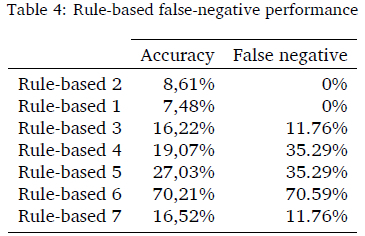
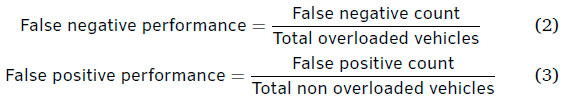
Accuracy is simply indicated as the sum of true positive and true negative, while the false negative performance was calculated as indicated in Equation 2 and false positive performance as indicated in Equation 3. The results in Table 4 show that the threshold adjustment alone would not adequately decrease the number of non-overloaded vehicles visiting the static scale and that an alternative approach is required.
2.4 Proposed IWIM solution
It is proposed to de-isolate the various TCCs by allowing information from one TCC to be used in conjunction with information from the following TCC on the corridor when a decision is made on whether to direct a vehicle to the static scale or not. The proposed IWIM concept will make the result of the static weighing of a vehicle available to all WIM scales on the same corridor, which will allow the control system at such WIM scales to make a more informed decision about whether to guide a vehicle to the associated static scale or not. This information link will allow any decision taken at a specific monitoring and control site to take into consideration the status of vehicles when detected at other TCCs prior to the respective monitoring event. The IWIM concept will implement a set of risk management rules before it decides whether to guide a vehicle that is detected at a WIM scale to the associated static scale. These rules will include the static weight of the vehicle as measured at a prior static scale, the time of travel between the prior static scale and the current WIM scale, the stopping of the vehicle between the respective scales, and the deviation of the vehicle from the normal route between the respective scales. Instead of basing the WIM decision only on the current WIM scale measurement, as is the case with the SQ rule-based method, the proposed new algorithm will incorporate the following information before a decision is made:
1. If the identified vehicle has not been weighed statically on the same corridor within a predetermined time period (which is based on the expected travel time on the corridor up to the position where the WIM scale is installed), the normal rule as explained above will apply - if the allowed threshold is exceeded the vehicle will be guided to the associated static scale.
2. If the identified vehicle has been weighed statically before on the same corridor and within the predetermined time period, it will be determined if the vehicle arrived at the current WIM scale within the normally expected travel time since the previous instance when the vehicle passed over either a WIM or static scale on the same corridor. If the vehicle significantly exceeded the normal travel time the normal rule will apply as above.
3. If the identified vehicle has been weighed statically before on the same corridor and it arrives within normal travel time, the static weighing record that has already been captured for that vehicle will be used to determine whether it should be guided to the associated static scale. If it was previously found to be within the legal limits it will be allowed to pass through, even though it may exceed the threshold as measured by the WIM scale. If it was however found to be over the legal limit at the previous static scale, it will be guided to the current static scale again, should it exceed the WIM scale threshold.
2.5 Construction of an IWIM algorithm
The simplest method to implement the proposed IWIM concept would be to use a fixed set of rules to apply the logic of the decision-making process as described above. This however will require the determination of optimal threshold values for some of the decisions to be taken to distinguish between vehicles that should be guided to the static scale and vehicles that should be allowed to proceed on the corridor. The first element of uncertainty is the time that a vehicle, that was still legally loaded at the previous TCC, should be allowed to travel from the previous to the current TCC to still be regarded as low risk, given that vehicles do not always travel at the same speed. Another element of uncertainty is how close each axle weight, as determined by the last static scale, may be to the overload limit before the vehicle will be regarded as low risk, given that some load may have shifted during the trip, resulting in changes to the axle loads. A third element of uncertainty is the current WIM scale reading, which is known to be inaccurate. It is therefore not obvious when the current WIM reading should be used to override a previous static scale reading for the same vehicle.
Under such conditions of uncertainty, a rule-based classifier is known to suffer from some weaknesses when the input data has inherent noise (i.e. if the values are random in nature rather than fixed). The reason for this is the fact that a single input value with noise may cause the rule-based technique to branch off in the wrong direction, as a rule-based technique considers the various inputs one at a time. Other classification techniques, that process all input data in parallel, have been shown to have superior classification abilities when fed with noisy data, as the presence of noise in one input variable can to some extent be compensated for by the other inputs that influence the outcome (Boschetti & Massaron, 2015; Joshi, 2017).
The previous discussion provides the motivation to evaluate several different classification techniques to produce an accurate answer regarding the overloaded value of a vehicle detected at a WIM scale, using data from the current WIM scale as well as data from previous static scale measurements. By training such techniques on a specific data set and then testing them all on another unseen data set, it will be possible to determine with a high degree of certainty which of them will produce the most reliable classifications in a real-world scenario.
2.6 Dataset pre-processing
The de-isolation of the available information will require the system to send data to a central server to be converted into a standardised format to be distributed to the rest of the TCCs on the corridor. The data collected at the site needs to be described before a proposed algorithm can be developed. Data formatting between operators may be different but the same basic data is collected. Sequential TCC data will be described from the viewpoint of the second site, called current site or Site 2, making use of data from the previous site, Site 1, as input to classify whether a vehicle should be statically weighed or allowed to proceed on the corridor. The list below describes the data to be used as input into the IWIM algorithm that will be developed:
• Axle count
• Vehicle class
• Site 1 WIM axle weights for up to 15 vehicle axles (from statistics this was determined as the maximum axle count, and thus 15 was chosen as the number of axles to use)
• Site 1 AVCM as measured by WIM
• Site 1 static scale weights
• Site 1 AVCM static scale
• Site 2 WIM axle weights
• Site 2 AVCM WIM
• Normalised travel time between sites (actual travel time divided by average historical travel time)
• Overload status as determined by Site 1 static scale
In order to reliably train various classification techniques to produce the required outcome (identification of vehicles with a low risk of being overloaded) a relatively large training data set is required, as well as a separate test set. The industry data collection discussed in Section 2.2 combined with the vehicle linking between TCCs in Section 2.2.1 ensured the input variables are available for training and testing the model. The next step is the development of the IWIM algorithm by investigating the performance of multiple AI techniques performances to improve the current operations.
3 INTELLIGENT WEIGH-IN-MOTION DEVELOPMENT
The purpose of improving the overload control operations at the TCCs, by reducing the percentage of unnecessary static weighing of vehicles without increasing the risk of allowing overloaded vehicles on the road, requires an algorithm to facilitate this optimisation. This algorithm is going to be developed by making use of an AI model to be used as the IWIM model. The first step is to determine how AI-based classifiers may be applied to overload control.
3.1 Artificial intelligence model implementation
A classifier will be used to determine from input data whether a vehicle is overloaded or not overloaded and use this outcome in the decision-making process to decide if the vehicle must be statically weighed or not. A simplified explanation of how AI-based classifiers are trained is as follows:
• Each observation in the data set consists of a number of inputs (in this case the weight of each axle and AVCM at the previous static scale, the current WIM weight as well as the travel time from the previous static scale), as well as an output or target variable.
• The corresponding overloaded state of a vehicle is used as the output variable in each observation. During the training of the models, this output is used as a target variable, i.e. the ideal outcome that the classifier should produce when fed with input data.
• The total available data set is then divided into a training and test dataset using an 80/20 split, which is typical for such methods. This is essential, as it will allow the classifiers to be tested for their ability to generalise, i.e. to produce accurate answers for data not used during the training of the classifiers.
• Each classifier consists of a mathematical model that predicts the outcome from the inputs, with selectable parameters or weights of which the values can be changed to improve the classification accuracy.
• Training will now commence on the training dataset.
• This model is now ready to be tested on the testing dataset to see how accurate it truly is on unseen data.
• Accuracy of the model is set at a percentage accuracy, but a better metric is making use of the confusion matrix that will give four possible outcomes that provide better insight to the classification accuracy (Alwis, 2016):
- Output 1 is the True Positive (TP) results where the output was set as overloaded and the model predicted the same.
- Output 2 is the True Negative (TN) result where it was not overloaded, and the model predicted the same.
- Output 3 is the False Positive (FP) where the model predicted it is overloaded but it was not overloaded.
- Output 4 is the False Negative (FN) that will indicate the model incorrectly said the vehicle is not overloaded but it was overloaded.
• Accuracy will be the sum of Output 1 and 2 divided by the total size of the data set to reflect the model's performance.
• It is however important to use Output 3 and 4 to determine how many were incorrectly sent to the static scale (that will waste time, similar to the current system) or the corridor (allowing overloaded vehicles to continue travelling without being prosecuted).
• It is also possible to assign different costs to the two types of errors (outputs 3 and 4 above) in cases where the risk of each type of error is not the same. E.g. in this case error output 3 will only cause some delay to a truck (a small risk or cost), while error output 4 will send an overloaded truck onto the corridor (a much larger risk or cost). In such a case the objective of the classifier is not to minimise the total error count but the total cost produced by these errors.
It was necessary to classify the binary outcome variable of overloaded as output 1 or not overloaded as output 0 from the input data set. The most suitable machine learning model to perform the classification had to be identified. Several classifier models were discussed for possible implementation. The following classifier models were considered for possible implementation (Raschka, 2016):
• k-nearest neighbour (kNN)
• Logistic regression
• Decision tree
• Random forest tree (RFT)
• Support vector machine (SVM)
• Naive Bayes classifiers
- Gaussian
- Multinomial
- Bernoulli
• Artificial neural network (ANN)
kNN is known as a lazy classifier that memorises the training data set to predict a label classifier (Boschetti & Massaron, 2015; Shalev-Schwarts & Ben-David, 2014). Any new data is then fitted against the closest solution to predict the label outcome. This memorisation of the training set can suffer from overfitting and slight variations to the training set can have a drastic effect on the performance of the model.
Logistic regression is typically used to determine a target class output after training (Bos-chetti & Massaron, 2015). This is perfect to predict an outcome of 0 or 1 such as that required for the IWIM development (Raschka, 2016). Its disadvantage is that the classification does not converge if the classes are not perfectly linearly separable (Raschka, 2016).
Decision tree classification generates a tree-like structure with the data point determined by simple logic to produce the outcome (Raschka, 2016). A complex data set can be expected to have lower performance and this is addressed by combining several decision trees into an RFT.
An RFT is an example of ensemble learning by combining several machine learning models together to increase performance (Boschetti & Massaron, 2015). Several decision trees are created by looking at a subset of the input variables. Each of the trees makes a decision and the majority decision is used as the output decision (Boschetti & Massaron, 2015; Joshi, 2017; Montantes, 2020; Raschka, 2016).
SVM is a machine learning model that can be used for classification or regression problems. SVM is however mostly used for tasks such as text classification, spam e-mail classification, sentiment analysis, or image recognition (Boschetti & Massaron, 2015; Raschka, 2016). The model can capture more complex relationships between data points but unfortunately is less effective on larger data sets, noisier data, and overlapping classes (Boschetti & Massaron, 2015; Raschka, 2016). This drawback means the model is not suitable for data sets from the industry.
Naive Bayes classifiers are probabilistic classifiers inspired by Bayes' theorem (Boschetti & Massaron, 2015). These models assume that all features are unrelated, even when there is a relationship between them (Joshi, 2017). The models are typically implemented on spam e-mail detection similar to the SVM. The naive Bayes classifiers available are the Gaussian, multinomial, and Bernoulli. The fact that these models assume variables are independent means they are not suitable for the current problem.
ANNs can be implemented for several purposes because they attempt to determine patterns in the data (Joshi, 2017; Shalev-Schwarts & Ben-David, 2014). ANNs take several repetitions/epochs to assign different weights to each variable to determine the appropriate outcome (Joshi, 2017). They can thus be used for several tasks, such as regression and classification (Joshi, 2017). The classification of the outcome for the current problem makes an ANN a suitable candidate but the computational power required is significantly higher than for other classifiers and training time may be increased as well.
Selecting the correct model to test on the data is based on several parameters, with a mix of technical and non-technical factors (Boehm et al., 2019). These do not just include accuracy but may include runtime, resource costs, and the ease of use of the tools (Boehm et al., 2019). The model selection for the IWIM has to result in a low number of overloaded vehicles being sent incorrectly to the corridor.
A preliminary test was conducted on the training techniques to determine their accuracy to further define which models could be used for formal training. The models with a low classification accuracy of - 80% or less - were eliminated as they tend to perform better with other applications. These included kNN, SVM, Gaussian, naive Bayes, multinomial naive Bayes, and Bernoulli naive Bayes. The performance of the logistic regression, RFT, and ANN classifiers was higher compared to the other models but logistic regression has a significantly lower performance compared to the RFT and ANN classifiers and is thus also excluded.
The RFT takes the input data set and constructs a tree to determine the output value. The first parameter to be adjusted was the maximum depth of the number of branches that would be generated for the tree. Several hyperparameters were tested by adjusting the n estimators, maximum depth, and minimum sample splits that served as input into the selection of the models to be implemented. The default value of the model was set to have a maximum of 100 depth constraints when building trees to determine possible outcomes. This was expected to increase the training time required to build the model. The second parameter set to be adjusted was the maximum depth the branches would generate, and it was set to 15. The third model had a maximum depth of 10 and the n estimator (the maximum number of trees generated in the forest) was set to 50, with the n estimator as the maximum number of trees generated in the forest. The RFT models tested were therefore as follows (de Coning, 2022):
1. Random forest tree 1: n estimators = 100
2. Random forest tree 2: maximum depth = 15
3. Random forest tree 3: maximum depth = 10, n estimators = 50
The ANN implementation uses a Python Keras classifier. First, the input layer was defined based on the 79 input variables obtained after preprocessing the data sets. Two hidden layers were added. The number of hidden layer nodes was selected as double the number of input nodes (i.e. 158 hidden nodes each); this is often used as a standard industry implementation and lowered the processing times (de Coning, 2022). It was established that increased hidden layer sizes did not influence the accuracy of the models. The dropout was varied between the data sets, with the batch sizes chosen as 25 (this size however did not influence the performance of the models during preliminary testing) because the size did not influence the performance of the models during preliminary testing.
Three ANN models were produced to test the data sets. Testing indicated that a large number of epochs did not change the results so 10 epochs were chosen for the models, while 100 epochs were used in preliminary testing. This lowered the processing times (de Coning, 2022).
1. ANN 1: 79 units on input layer, 158 units on hidden layers, 20% dropout applied, Batch size of 25, 10 epochs.
2. ANN 2: 79 units on input layer, 158 units on hidden layers, 40% dropout applied, Batch size of 25, 10 epochs.
3. ANN 3: 79 units on input layer, 158 units on hidden layers, No dropout applied, Batch size of 25, 10 epochs.
The model performance results will be investigated in more depth in the following section.
3.2 Results
The performance is firstly tested based on the improvement against the SQ. This is followed by the false negative and false positive percentage, and finally the accuracy. The models are trained on the padded data set and then tested on the original data sets as well as the padded data sets.
The improvement is calculated by determining the percentage of vehicles that are correctly sent to the static scale versus the number of vehicles that are incorrectly sent to the static scale as depicted in Equation 4. These vehicles are legally loaded and sent to the static scale with the SQ rule-based implementation and the models are required to reduce these values. The improvement I is defined as follows:

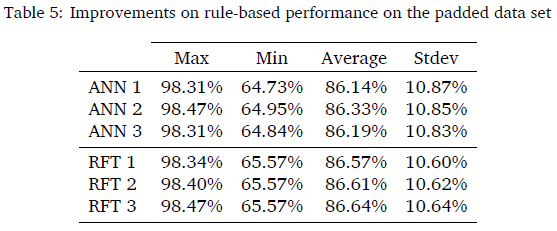
Table 5 indicates the improvement for each of the models. Models are trained on the original and padded data sets to obtain the relevant improvement against all seven rule-based performances as discussed in Section 2.3. The ANN model's best performance purely based on improvement is ANN model 2 with a maximum improvement of 98.47% and an average of 86.33%. The RFT model with the best performance purely based on improvement is RFT 3 with a maximum improvement of 98.47% and an average of 86.64%. The highest accuracy was obtained with models that were trained with the padded data set with the ANN at 98.47% and the RFT with 98.47% improvement.
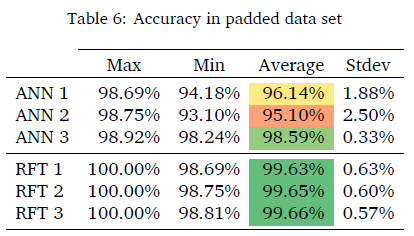
The model's maximum, minimum, average, and standard deviation are calculated for the initial assessment and indicated in Table 6. While ANN model 3 has the highest maximum accuracy at 98.92%, this model did not have the highest improvement of all the ANN models. While all RFT models had a maximum accuracy of 100%, RFT model 3 had the best improvement.
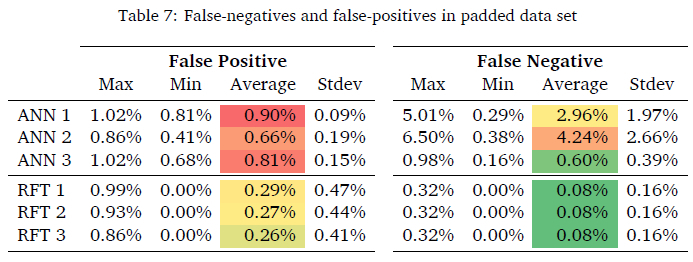
False-negative and false-positive performance is a deciding factor specifically in the context of corridor optimisation. False-negative will send overloaded vehicles to the corridor which will damage the road surface. False-positive is similar to the current SQ performance that sends non-overloaded vehicles to the static scale. Improvement on this parameter will ensure optimisation of the entire corridor. False-negative and false-positive performances are indicated in Table 7. The RFT models had an average of 0.08% sent incorrectly to the corridor when tested on the original and padded data sets. The padded data set however indicated 0% sent incorrectly to the corridor which indicates no overloaded vehicles will be missed. RFT model 3 has the lowest average false-positive sending 0.26% incorrectly to the static scale.
This model trained on the padded data set however only sent 0.03% incorrectly to the static scale which is far lower than the current operations. This improvement however is highly dependent on a larger data set accurately linked. The performance training on the original data set was considerably lower when compared to the padded data set.
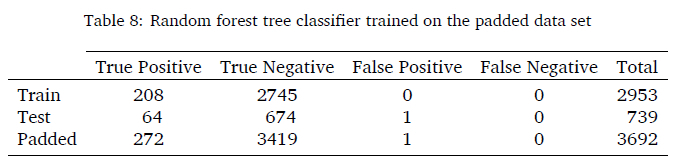
The RFT model 3 had the best performance as determined by the overview tables above. The next step is to confirm the model's performance by inspecting the confusion matrix of the model. Table 8 indicates the performance on the training, test, original, and padded data. A 100% accuracy is achieved on the training data set. The test data set had 1 vehicle sent incorrectly to the static scale with the padded data set with 1 vehicle sent incorrectly to the static scale. This model thus sent 0% of vehicles that were overloaded incorrectly to the corridor.
4 CONCLUSION AND FUTURE WORK
Freight logistics is important to support economic growth in a country like South Africa with economic hubs far from the coast, and a region like SADC which includes several landlocked countries. A deteriorating rail infrastructure ensures that road freight is the primary form of freight transportation. Overload control measures have been put in place to protect road infrastructure by implementing enforcement of legislation by means of TCCs. Unfortunately, there are inefficiencies in these operations as the system does not share information between TCCs, causing legally loaded vehicles to be subjected to several reweighs.
In this paper, we proposed a new overload control method to share data between sites to allow more intelligent decisions to be made by WIM scales. We furthermore demonstrated that this method can be combined with an AI-based classification model to improve the operational efficiency of the TCCs on the freight corridor. We constructed the dataset required by the AI model based on statistics extracted from measurements performed at the TCCs, combined with statistics from SANRAL's annual reports. The SANRAL reports also indicated that an average of 23.36% of statically weighed vehicles have been overloaded while only 0.18% are excessively overloaded to be arrested.
The proposed concept requires intelligent decision-making at TCCs, after the WIM measurement, to decide which vehicles need to be sent to the static scale. The available inputs include the weight measurements at the previous static scale and the local WIM scale as well as travel time from the previous TCC. As the data tends to be noisy, it is not trivial to make correct decisions, as indicated by the results achieved with the rule-based method. The best AI model sent no overloaded vehicles incorrectly to the corridor and 0.03% of non-overloaded vehicles incorrectly to the static scale. This is a huge decrease compared to the current 75 -85% of legally loaded vehicles currently being directed to the static scale. This justifies the use of AI techniques to improve the quality of decision-making.
The results indicate that the proposed technique can significantly improve the SQ solution. We also demonstrated that AI techniques can improve upon the results achieved by a simple rule-based method. The current best solution will be to implement a random forest tree model. The expansion of additional sites for model training will give additional confidence in the system for future deployment.
Future work will be conducted to formally report on the costs and benefits for the different stakeholders involved. This can then be used as motivation for the country-wide implementation of the system. An expansion to the SADC region can be conducted after a successful proof of concept.
5 ACKNOWLEDGEMENTS
The authors would like to thank SANRAL and Mikros Systems for making the data available for analysis to complete this study. The management teams at the Heidelberg and Mantsole TCCs are thanked for providing observation access to the TCCs. Competing interests: The authors declare that there are no competing interests in this study. Author contributions: The authors declare that all contributing authors have contributed to this article. Funding: Student bursary provided by the Intelligent Systems Research Group Disclaimer: The author's views and opinions expressed do not reflect the position of any of its affiliated agencies of the authors.
References
Alwis, R. (2016). Introduction to confusion matrix: Classification modeling. https://medium.com/tech-vision/introduction-to-confusion-matrix-classification-modeling-54d867169906
Bhero, E., & Hoffman, A. (2013). Applying RFID technology to improve efficiency in border-post cargo clearance process. 2013 Pan African International Conference on Information Science, Computing and Telecommunications (PACT), 137-141. https://doi.org/10.1109/SCAT.2013.7055105
Boehm, M., Kumar, A., & Yang, J. (2019). Data management in machine learning systems. Cham: Springer. https://doi.org/10.1007/978-3-031-01869-5 [ Links ]
Boschetti, A., & Massaron, L. (2015). Python data science essentials. Birmingham, UK: Packt. Bosman, J., & D'Angelo, M. (2011). A PPP "paradigm" for overload control on trade corridors in Africa. Southern African Transport Conference (SATC2011), 343-352. http://hdl.handle.net/2263/17319
Bwire, B. (2019). Comparative analysis of machine learning algorithms on weighbridge data for overloaded truck prediction (A case ofGilgil weighbridge station) (Master's thesis). University of Nairobi. http://erepository.uonbi.ac.ke/handle/11295/109874 [ Links ]
Campesato, O. (2020). Artificial intelligence, machine learning and deep learning. Herndon, VA, USA: Mercury Learning and Information. [ Links ]
Capecci, S., & Krupa, C. (2009). Concept ofoperations for virtual weigh station (tech. rep.). Federal Highway Administration, United States. https://rosap.ntl.bts.gov/view/dot/871
CSIR. (1997). The damaging effects of overloaded heavy vehicles on roads (4th ed., tech. rep.). Pretoria, South Africa: Department of Transport, Directorate: Traffic Control. https://loadtech.co.za/the-damaging-effects-of-overloaded-heavy-vehicles-on-roads/ [ Links ]
de Ponteves, H., & Eremenko, K. (2018). Artificial intelligence for business: Solve real world business problems with AI solutions. https://www.udemy.com/course/ai-for-business/
De Raedt, L., Kersting, K., Natarajan, S., & Poole, D. (2016). Statistical relational artificial intelligence. Cham: Springer International Publishing. https://doi.org/10.1007/978-3-031-01574-8
de Coning, A. (2022). Traffic control centre optimisation through applied intelligent weigh-in-motion (Doctoral dissertation). North-West University. http://hdl.handle.net/10394/40139 [ Links ]
de Coning, A., & Hoffman, A. J. (2014). Freight tracking cost analysis to improve logistics management operations. Annual Southern Africa Telecommunication Networks and Applications Conference (SATNAC), 383-388. https://repository.nwu.ac.za/handle/10394/15941
de Coning, A., & Hoffman, A. J. (2016). Proposed alternative to assist current overload operations in South Africa. In P. Froschauer, B. Cameron & B. Behrens (Eds.), Proceedings of the 35th annual Southern African transport conference (SATC 2016) (pp. 23-35). http://hdl.handle.net/2263/57982
de Coning, A., & Hoffman, A. (2014). Overload control centre bypass detection system. 17th International IEEE Conference on Intelligent Transportation Systems (ITSC 2014), 19041905. https://doi.org/10.1109/ITSC.2014.6957978
de Coning, A., & Mouton, F. (2020). Data processing automation for bulk water supply monitoring. In D. Kreps, T. Komukai, T. V. Gopal & K. Ishii (Eds.), Human-centric computing in a data-driven society (pp. 193-202). Cham: Springer International Publishing. https://doi.org/10.1007/978-3-030-62803-1_16 [ Links ]
Department of Transport. (2004). Guidelines for law enforcement in respect of the overloading of good vehicles: As prescribed by the National Overloading Control Technical Committee (NOCTC) (tech. rep. No. D9/3/22/5). https://paperzz.com/doc/8231172/guidelines-for-overload-law-enforcement
Goldberg, Y. (2017). Neural network methods for natural language processing. Cham: Springer International Publishing. https://doi/org/10.1007/978-3-031-02165-7 [ Links ]
Green, J. G., Nichols, A. P., Allen, E., Nuber, L., Thomaz, J. E., Bullock, D. M., Boruff, G., Was-son, J., & Newland, M. (2002). Virtual weigh station (tech. rep.). Indiana Department of Transportation, Purdue University, West Lafayette, Indiana, Joint Transportation Research Program. https://doi.org/10.5703/1288284313348
Hoffman, A. J., & de Coning, A. (2014). An intelligent freight corridor overload control system. 17th International IEEE Conference on Intelligent Transportation Systems (ITSC), 1732-1739. https://doi.org/10.1109/ITSC.2014.6957943
Hoffman, A. J., Lusanga, K., & Bhero, E. (2013). A combined GPS/RFID system for improved cross-border management of freight consignments. IEEE AFRICON Conference 2013, 18. https://doi.org/10.1109/AFRCON.2013.6757841
Inflation.EU. (2016). Historic Inflation South Africa - CPI inflation [Accessed: 2016-06-13]. http://www.inflation.eu/inflation-rates/south-africa/historic-inflation/cpi-inflation-south-africa.aspx
Jorgensen, A. (2013). Sustainable transport: Infrastructure costs and the relevance of externalities. Proceedings of the 32nd Annual Southern African Transport Conference (SATC), 1-13. http://hdl.handle.net/2263/33268
Joshi, P. (2017). Artificial intelligence with Python. Birmingham, UK: Packt. https://www.oreilly.com/library/view/artificial-intelligence-with/9781786464392/ [ Links ]
Labuschagne, F., De Beer, E., Roux, D., & Venter, K. (2017). The cost of crashes in South Africa 2016. Proceedings of the 36th Annual Southern African Transport Conference (SATC 2017), 474-485. http://hdl.handle.net/2263/62732
Liu, S., Li, L., Tang, J., Wu, S., & Gaudiot, J.-L. (2018). Creating autonomous vehicle systems. Cham: Springer International Publishing. https://doi.org/10.1007/978-3-031-01802-2 [ Links ]
Marsay, A. (2013). What is sustainable transport infrastructure? Proceedings of the 32nd Annual Southern African Transport Conference (SATC), 1-12. http://hdl.handle.net/2263/32316
McClellan, S., Jimenez, J. A., & Koutitas, G. (Eds.). (2018). Smart cities: Applications, technologies, standards, and driving factors. Springer-Verlag. https://dl.acm.org/doi/book/10.5555/3152648
Mikros Systems. (1998). Revised classification scheme for SANRAL. Now ISWIM (tech. rep.).
Mitchell, M. (2013). Towards sustainability of the South African road network. In P. Froschauer, B. Cameron & B. Behrens (Eds.), Proceedings ofthe 32nd annual Southern African transport conference (SATC2103) (pp. 1-11). http://hdl.handle.net/2263/32258
MiWay. (2016). No silver bullet when it comes to reducing the number of truck accidents. http://truckandfreight.co.za/no-silver-bullet-comes-reducing-number-truck- accidents/
Montantes, J. (2020). 3 reasons to use random forest over a neural network - comparing machine learning versus deep learning [Accessed: 2021-11-26]. https://towardsdatascience.com/3-reasons-to-use-random-forest-over-a-neural-network-comparing-machine-learning-versus-deep-f9d65a154d89
Odoki, J. B., Anyala, M., & Akena, R. (2009). Economic benefits of an efficient North-South corridor: Strategic level analysis of investments in the North-South corridor using HDM-4 (tech. rep. No. 300409). Birmingham, UK: Alta Innovations, University of Birmingham. https://www.iqpc.com/media/9098/19769.pdf [ Links ]
Pedersen, P. O. (2007). The role offreight transport in economic development: An analysis ofthe interaction between global value chains and their associated transport chains (tech. rep.). Copenhagen, Danish Institute for International Studies (DIIS). http://hdl.handle.net/10419/84544 [ Links ]
PricewaterhouseCoopers. (2013). 2013 CBC Africa infrastructure investment report. London UK: Commonwealth Business Communications. https://commonwealthbc.com/africa-infrastructure-investment-report-2013/ [ Links ]
Raschka, S. (2016). Python machine learning. Birmingham, UK: Packt. [ Links ]
Rodrigue, J. (2007). Transportation and globalization. In R. Robertson & J. A. Scholte (Eds.), Encyclopedia of globalization. https://www.routledge.com/Encyclopedia-of-Globalization/Robertson-Scholte/p/book/9780415973144
Salama, H. K., Chatti, K., & Lyles, R. W. (2006). Effect of heavy multiple axle trucks on flexible pavement damage using in-service pavement performance data. Journal of Transportation Engineering, 132(10), 763-770. https://ascelibrary.org/doi/10.1061/%28ASCE%290733-947X%282006%29132%3A10%28763%29 [ Links ]
SANRAL. (2017). SANRAL integrated report 2016/2017, Volume 1 (tech. rep.). https://www.nra.co.za/uploads/65/SANRAL-Integrated-Report-2017-Volume1.pdf
SANRAL. (2018). SANRAL integrated report 2017/2018, Volume 1 (tech. rep.). https://www.nra.co.za/uploads/65/SANRAL-Integrated-Report-2018-Volume-1.pdf
SANRAL. (2019). SANRAL integrated report 2018/2019, Volume 1 (tech. rep.). https://www.nra.co.za/uploads/65/SANRAL-Integrated-Report-2019-Volume-1.pdf
Shalev-Schwarts, S., & Ben-David, S. (2014). Understanding machine learning: From theory to algorihms. USA: Cambridge University Press.
Shinohara, K., Otto, G., Tani, V., de Mori, F., & Valente, A. (2016). Brazilian PIAF model and the direct enforcement. ICWIM7 7th International Conference on Weigh-In-Motion. https://www.researchgate.net/publication/334099058_BRAZILIAN_PIAF_MODEL_AND_THE_DIRECT_ENFORCEMENT_PROJECT
Smith, A., & Visser, A. T. (2001). A South African road network classification based on traffic loading (MSc Eng Project Report). Pretoria, South Africa: University of Pretoria. https://hvttforum.org/wp-content/uploads/2019/11/A-SOUTH-AFRICAN-ROAD-NETWORK-CLASSIFICATION-BASED-ON-TRAFFIC-LOADING-Smith.pdf [ Links ]
Steyn, W. J. V., & Haw, M. (2005). Effect of road surfacing condition on tyre life. Proceedings of the 24th Annual Southern African Transport Conference (SATC 2005), 446-456. http://hdl.handle.net/2263/6416
Stoltz, M. (2016). The truth about truck accidents on SA roads. https://www.miway.co.za/blog/business-insurance/the-truth-about-truck-accidents-on-sa-roads
Turnbull, K. F. (2015). The role of freight transportation in economic competitiveness [Issue 16]. Transportation Research Board Conference Proceedings on the Web. https://trid.trb.org/view/1358325
Van der Mescht, J. (2006). Revisiting the road versus rail debate. Proceedings of the 25th Annual Southern African Transport Conference (SATC), 485-494. http://hdl.handle.net/2263/6100
Zhang, A., Lipton, Z. C., Li, M., & Smola, A. J. (2021). Dive into deep learning. arXiv preprint arXiv:2106.11342. https://doi.org/10.48550/arXiv.2106.11342
Received: 28 February 2021
Accepted: 1 December2022
Available online: 31 July 2023

