


Services on Demand
Article
 English (pdf)
 Article in xml format
 Article references
Indicators

Related links
-
 Cited by Google
 -
 Similars in Google
Share

 Permalink
South African Computer Journal
On-line version ISSN 2313-7835
Print version ISSN 1015-7999
SACJ vol.34 n.2 Grahamstown Dec. 2022
http://dx.doi.org/10.18489/sacj.v34i2.832
RESEARCH ARTICLE
Identifying academically vulnerable learners in first-year science programmes at a South African higher-education institution
Ritesh Ajoodha
The University of the Witwatersrand, Johannesburg. ritesh.ajoodha@wits.ac.za
ABSTRACT
The Admission Point Score (APS) is used by most South African universities to identify a university programme in which a learner is likely to succeed. While the APS appears helpful to gauge the aptitude of a learner and predict their success, the reality is that between 2008 and 2015 almost 50% of learners who made the required APS for a Science programme failed to complete the requirements for that programme. This paper delineates and diagnoses learner vulnerability, using a learner attrition model, for early intervention and as an alternative to using the APS. The analysis shows that various predictive models achieve higher accuracy to predict learner vulnerability, by incorporating factors of the learner attrition model, rather than just using the APS score. This paper argues for a more complex view of predicting learner vulnerability for early interventions by incorporating the learner's background, individual characteristics, and schooling data. It does not agree with the aggregation of National Senior Certificate (NSC) subjects into APS scores since this normalises the complexity of the subtle relations between the schooling system, learner attrition, and pre-schooling pedagogical dynamics. This paper points to a more nuanced view of predicting learner vulnerability.
CATEGORIES: • Applied computing ~ Education • Computing methodologies ~ Machine learning
Keywords: Predicting learner vulnerability, Identifying at-risk learners, Early intervention, South African higher-education universities, Model-based machine learning, Education
1 INTRODUCTION
Acceptance into a university programme is often a life changing experience for most Grade 12 learners in South Africa, being a promise of higher income leading to a better quality of life (Buang et al., 2020). Sadly, most learners who are accepted into university programmes fail to complete their degree (Naylor, 2007).This often occurs due to a misalignment of interests, unmatched expectations, financial and family pressures, or even a lack of developed skills that are required of the learner to complete their selected programme (Montalto et al., 2019). Being able to identify learners who are at risk of not successfully completing their degree (learner vulnerability) early in a programme, can be helpful in utilising interventions to address these social, financial, familial, or academic pressures so that the learner will be better positioned to fulfil their degree requirements. However, the major problem addressed by this paper is that identifying the influencing or potential factors that could be used to predict learner vulnerability (a wicked problem (Ramley, 2014)) is not clear, and so many universities have resorted to using the Admission Point Score (APS) in trying to deduce learner vulnerability (Mashige et al., 2014). The APS is a metric used in South Africa to admit learners into a program at a university.
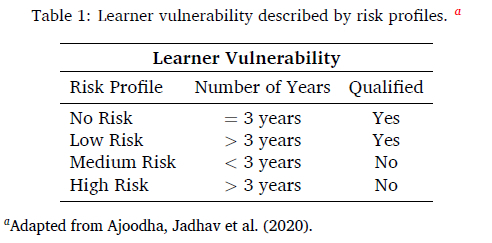
A learner who enters a programme can lead to one of the following four possible outcomes that are associated with their probability of completing their chosen programme. We refer to this notion as 'learner vulnerability' as adapted from Ajoodha, Dukhan et al. (2020) and Ajoodha, Jadhav et al. (2020). For example, a learner who fails to complete their degree before the minimum time of completion (< 3 years) is categorised as 'medium risk'. This can occur if the student drops out of their programme - perhaps through failing a subject or other difficulties. There are four risk learner profiles identified by this paper which are summarised by Table 1.
1.1 The APS as a predictor of learner vulnerability
At a South African higher-education research-intensive institution 11% of learners who registered between the years 2008 and 2015 were categorised as no risk; 28% as low risk; 56% as medium risk; and 5% as high risk in a Faculty of Science stream (i.e. either Earth Sciences, Mathematical Sciences, Physical Sciences, or Biological Sciences). Figure 1 decomposes this data for learners registered between 2008-2015. The figure indicates a 44% average of both high risk and medium risk. This presents a crisis since almost half of the accepted and registered applicants each year failed to complete the minimum requirements for their chosen degree.
At most South African higher-education institutes, entrance to a degree is assessed based on a learner's Admission Point Score (APS). The APS is an aggregation of learners' top six Grade 12 subjects. Various degrees require a specified minimum APS score to gain entry (e.g., a Bachelor of Science degree with majors in pure mathematics and computer science requires an APS score of 401 ).
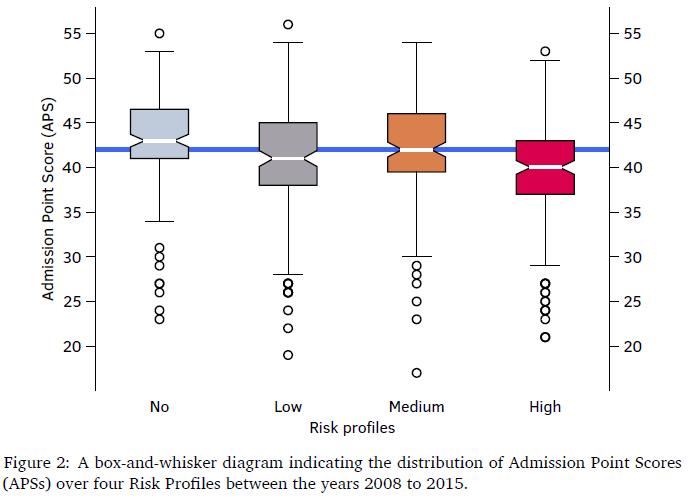
Since the APS is used to identify a university programme in which a learner is likely to succeed, it is often mistakenly recognised as a means to diagnose learner vulnerability (Mashige et al., 2014). Although the APS score appears to provide a mechanism to gauge learner performance, the reality is that between 2008 and 2015 almost 50% of learners who achieved the required APS for a programme failed to complete the requirements for their degree (as indicated in Figure 1). Figure 2 illustrates the distribution of APS scores using box-and-whisker diagrams over the four risk profiles between the years 2008 to 2015.
Each distribution (in Figure 2) of APS scores with respect to the risk profile overlaps for more than 80%. In other words, the APS score alone is not enough to determine which risk profile the learner may fall under and is therefore not a reliable tool for diagnosing learner vulnerability. For example, according to Figure 2, a learner with an APS score of 42 is likely to be in any of the four risk profiles. Thus, the APS may well be completely unsuitable for predicting learner vulnerability since many learners who are later categorised as high risk and no risk entered their degree with the same APS score.
1.2 Research focus and rationale
The debate about the possible influences which cause a student to decide to leave their undergraduate education continues since the broad causal factors linked to learner vulnerability cannot easily be uncovered. However, this paper attempted to empirically describe and signify the factors which have previously been linked to learner vulnerability, such as Grade 12 marks, biographical and individual characteristics.
The rationale of this research is that we may be better off describing learners based on their vulnerability by using background characteristics, individual attributes, and Grade 12 marks, rather than just using their APS scores. Furthermore, finding appropriate classification tools to manage and identify learner vulnerability early in the academic programme; will promote a proactive approach to learner intervention in the ever-increasing student intake.
This proactive approach will in turn prevent the accumulation of unnecessary debt by the student, reduce wasted years towards their degree completion, and foster throughput of graduates in the minimum allocated time. Therefore, identifying vulnerable learners will aid in finding deserving recipients of support and resource allocation from a teaching and learning perspective.
This paper attempts to answer the following research questions:
• What are the key potential factors characterising learner vulnerability in an undergraduate Science programme?
• Could these potential features be used to predict learner vulnerability better than just using the APS?
• Which of the adopted classification models are most suitable for classifying learners by their vulnerability, using these potential factors?
The purpose of this research is to provide a data driven tool that uses learner background, individual attributes, and Grade 12 marks to predict the vulnerability of a learner (risk profile as either no risk, low risk, medium risk, or high risk) to proactively activate an intervention that could result in the successful completion of the learner's degree.
Several machine learning predictive models have been trained, such as decision trees, instance-based classifiers, naïve Bayes models, random forests, and linear logistic regression models - to classify the learner according to these four risk profiles. Confusion matrices were used to gauge model performance and factor analysis was performed to rate the information gain of each feature in predicting the risk profile.
The results indicate that a learner's individual attributes and background attributes contributed the most towards classifying said learner into the four risk profiles. The best reported accuracy was the multilayer perceptron model (a feed-forward neural network) which achieved 85% over the four risk profiles. A web application (WebApp) which uses the multilayer perceptron predictive model to categorise a learner into these four risk profiles - by using the learner's background, individual attributes, and Grade 12 marks as input features - has been prepared.
This paper makes the following contributions: Firstly, a comparison of predictive models to calculate the probability of a learner's risk profile for a South African higher-education research-intensive institution. Secondly, an organisation of learner background, individual attributes, and Grade 12 marks - according to their contributions - to classify the four risk profiles correctly in contrast to the APS. Finally, an interactive program which is able to calculate the posterior probability over these risk profiles given learner background, individual attributes, and Grade 12 marks.
This document is structured as follows: Section 2 highlights the state-of-the-art contributions in the domain of predicting at-risk learner profiles, and a selected conceptual framework for learner vulnerability; Section 3 highlights the data, feature selection, and choice of predictive models; Section 4 outlines the major findings; and Section 5 presents the implications of this paper, outlines the contributions, and puts forward recommendations for future work.
2 RELATED WORK
The learners' readiness to 'join the academic tribe' (McKenna, 2010), has resulted in a call for research-led interventions for under-prepared, undergraduate science students which has been engendered by the transition from school to university and substandard learner placement into academic programmes (Ngo & Kwon, 2015). This call has been answered by the development of more complex tools for identifying vulnerable learners who are at risk of not completing their degree so that early interventions can be administered to remediate the learners' performance (Yeld & Haeck, 1997).
The current standard of identifying vulnerable learners is based on a basic aggregation of Grade 12 marks into Admission Point Scores (APSs). However, many universities have acknowledged a call for a more comprehensive understanding of learners and have collected data on students' biographical and enrolment status throughout their university experience -to identify learner vulnerability (Enslin, 2003). The availability of this data may provide insight into the response of the student towards the academic culture and will allow us to provide evidence-based support through faculty interventions to optimise the learner's chances of success in a programme. Some institutions, such as the Siyaphumelela (2018), have already adopted identifying the learner based on their risk factor, given their biographical and enrolment characteristics.
The biographical and enrolment data of a learner can allow us to measure the academic readiness for a particular programme by providing a more comprehensive description of the learner. For example, this data can inform us about the financial status of the learner, or even their geographical location which tells us how they access the university (Manik, 2015). This data underlines factors which inform us about latent access issues that may influence learner preparedness and thus vulnerability.
The main aim of this research is to provide a data-driven tool that uses the learner's background, individual attributes, and Grade 12 marks to predict the vulnerability of a learner. This aim has many implications for the university including the development of an 'Early Warning System' which probabilistically models the learner's trajectory using cohort analytics. Along the learner's trajectory there may be several risk factors that can prevent the student from completing their degree and which the faculty can identify by using this early warning system. With this in mind, they can structure early interventions to offer the student support in partnership with invested stakeholders in their success (e.g. bursary providers, parental support, and lecturers).
By providing these interventions to the student we can alleviate the possibility that the student will fail their selected programme. Failure presents a catastrophe for the student and can lead to lifelong consequences due to social, behavioural, and emotional problems.
Students who fail at university are more likely to engage in subsequent health-impairing behaviours (Bryant, 1978), experience financial deficits (Cornelius & Frank, 2015), and face limited economic opportunities (Feather & Davenport, 1981). Therefore, integrated approaches to evaluate and intervene in the learner's academic trajectory (by trained practitioners) can play a large role in avoiding these unfortunate outcomes. By identifying the causes of failure we can advocate for the resources to alter a vulnerable learner's academic trajectory and thus prevent further compromise of a learner's health (Fitzgibbon & Prior, 2006).
The conceptual framework of Tinto (1975) (see Figure 3), which naturally relates the biographical and enrolment data of the learner to their vulnerability, has been adopted (Schreiber et al., 2014). Tinto (1975), as well as many authors, list the following three input factors that contribute to learner vulnerability: (a) background or family, (b) individual attributes, and (c) pre-college or schooling. These factors interrelate and influence the learner's objective to complete their degree (goal commitment) or attitude towards university activities (institutional commitment). In the academic system, creating values and dispositions towards goal commitment translates into improved academic performance and intellectual development. This leads to a decrease in the probability of dropping out (Tinto, 1975).
The input factors of the conceptual framework put forward by Tinto (1975), i.e., (a) background or family, (b) individual attributes, and (c) pre-college or schooling, indicates the learner's family background, academic potential, and socio-economic status. There is a wealth of literature on whether these three characterisations could predict learner performance at a university (Ajoodha, Dukhan et al., 2020; Ajoodha, Jadhav et al., 2020).
Firstly, from the background or family standpoint, many authors have used the learner's age, gender, illness, disability, and family background to predict learner performance (bin Mat et al., 2013; Christian & Ayub, 2014; Natek & Zwilling, 2014; Oladokun et al., 2008; Osmanbegovic & Suljic, 2012; Ramesh et al., 2013). In particular, it was consistently found that female learners outperform male learners due to more effective learning strategies and positive learning styles (bin Mat et al., 2013; Simsek & Balaban, 2010), and second-language English speaking learners struggled more than those whose first language was English (Ramesh et al., 2013).
Secondly, in terms of individual attributes, much research has found that the learners' interest, motivation, study patterns, and family's support contributes substantially towards the completion of their degree (Gray et al., 2014; Hidayah et al., 2013; Mayilvaganan & Kalpanadevi, 2014; Mishra et al., 2014; Sembiring et al., 2011). Their individual interaction with other peers also contributes by establishing a social interactive network (Bogarín et al., 2014; Osmanbegovic & Suljic, 2012; Romero et al., 2013; Thai-Nghe et al., 2010; Tucker et al., 2014). However, the collection of these attributes for large studies is rare since these factors are based upon qualitative data collection techniques.
Finally, the use of pre-college or schooling characteristics have also been explored by many researchers by examining the learner's use of summative assessments (Arsad et al., 2013; Bog-arín et al., 2014; Bunkar et al., 2012; Coffrin et al., 2014; Natek & Zwilling, 2014; Oladokun et al., 2008; Parack et al., 2012), the learner's high-school background (Oladokun et al., 2008; Osmanbegovic & Suljic, 2012; Ramesh et al., 2013), and the learner's participation in extracurricular activities (Mayilvaganan & Kalpanadevi, 2014; Mishra et al., 2014; Natek & Zwilling, 2014). This particular avenue has been explored extensively since most universities base their acceptance criteria solely on an aggregation of the learner's top subjects and because of the availability of the data. This study was informed by the above authors' success in using the above-mentioned features.
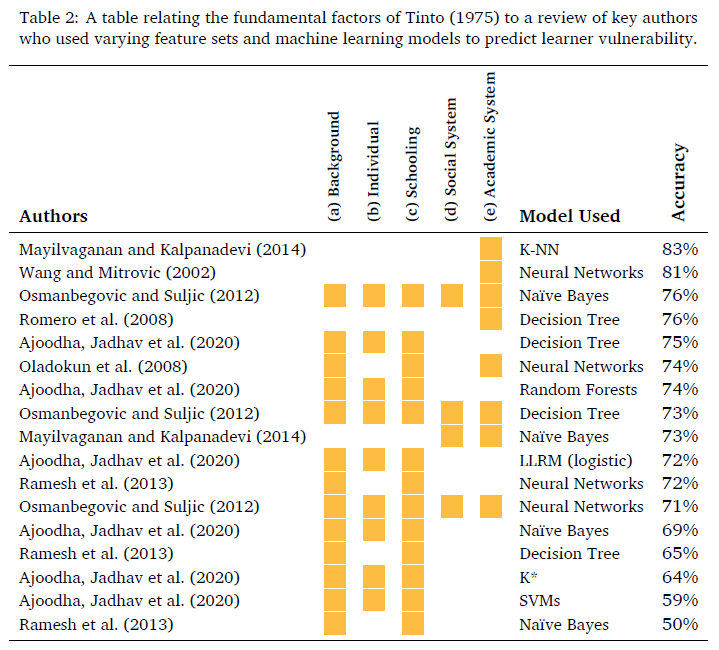
Table 2 attempts to relate the fundamental factors of Tinto (1975) to a review of key authors who use varying feature sets and machine learning models to predict learner vulnerability.
The first column indicates the authors; the second column indicates the features used with respect to the conceptual framework of Tinto (1975), i.e., (a) background or family, (b) individual attributes, and (c) pre-college or schooling, (d) the learners' integration into the Social System; and (e) the learners' integration into the Academic System; the predictive model used by the authors; and finally, the accuracy obtained by said model.
The first three rows in Table 2 indicate that using the learners' actual summative assessments at the university provides the best feature-set to predict learner vulnerability. Although this paper aims to provide a programme recommendation engine for learners who have not yet entered the university system, the results of Mayilvaganan and Kalpanadevi (2014), Minaei-Bidgoli et al. (2003) and Wang and Mitrovic (2002) demonstrate the strength of solely using assessments at undergraduate level to predict performance. Osmanbegovic and Suljic (2012) demonstrate the power of using all of the characterisations in the Tinto (1975) conceptual framework, however, including the academic system defeats the purpose of identifying vulnerable learners for early intervention (since these results are not yet available). Previous work considered using the three input features of Tinto (1975) to predict learner vulnerability (Ajoodha, Jadhav et al., 2020). Although the feature set was not as extensive as in this paper, our previous work serves as the rationale for using Tinto (1975) as a conceptual framework since its ability to describe the learner produces a feature-set which outperforms most other methods (Ajoodha, Jadhav et al., 2020). The top performing models as reflected in Table 2 are the K-NNs (Mayilvaganan & Kalpanadevi, 2014; Minaei-Bidgoli et al., 2003) and Neural Networks (Oladokun et al., 2008; Wang & Mitrovic, 2002). The K-NNs may have out-performed the neural network in Wang and Mitrovic (2002), due to the low dimensionality suggested in the feature-set and the neural network may have outperformed most other models due to its ability to capture nonlinear relationships in the wealth of data provided. The K-NN and feed-forward neural network have been included in this study as benchmarks. The next section outlines the methodology used in this paper to predict learner vulnerability based on Tinto (1975).
3 RESEARCH DESIGN
In this section the research design used by this paper is presented. This paper positioned its research design according to the framework put forward in the Nature and Relevance of Research by Brotherton (2015). This paper used a Descriptive Research Type since it aims to build on the learner attrition model by Tinto (1975) to provide a more accurate description of undergraduate learner vulnerability through several potential factors. This research is therefore quantitative. The following research methodology is proposed, as indicated by Figure 4.
In Figure 4, features are extracted from the data and predictive models are applied. Feature analysis is also performed to rank the contribution of each feature in predicting learner vulnerability.
The learner's background, individual characteristics, and Grade 12 marks are used to predict the distribution over learner vulnerability. Learner vulnerability is categorised as the following risk profiles: no risk, low risk, medium risk, and high risk.
A learner can be at: 'no risk', where the learner completes their degree in minimum time (3 years); 'low risk', where the learner completes their degree in more than the minimum time (> 3 years); 'medium risk', where the learner fails their degree before the minimum time of completion (< 3 years); or 'high risk', where the learner fails their degree in longer than the minimum time (> 3 years). This paper differentiates between medium risk and high risk on the basis that the learner wastes more resources towards a failed outcome.
Several machine learning predictive models were trained from different archetypes of machine learning to deduce the learner into these four risk profiles. Confusion matrices are used to evaluate model performance; and factor analysis was performed to rate the contribution of each feature to predicting the class label. Authors who have used this approach are outlined in Table 2.
The results in this paper can be used to help academic advisers identify the characteristics that relate to learner vulnerability in a South African context. The results of this paper can also be used to identify learners who exhibit these characteristics which in the past translated to the learner's vulnerability to not completing their undergraduate programme.
This section is structured as follows: Subsection 3.1 describes the data collection and pre-processing steps taken to prepare the data for the objective of this research, Subsection 3.2 outlines the features used to predict the class variables as well as a mechanism to gauge the contribution of each feature used, Subsection 3.3 provides brief descriptions of the machine learning classifiers used to perform the predictive task, and Subsection 3.4 provides information concerning the ethics clearance certificate obtained for this research.
3.1 Data collection and pre-processing
The standardised secondary encrypted data used in this study consisted of the biographical and enrolment data of learners registered for an under-graduate degree between the years 2008 to 2018 at a South African higher-education institution. The survey data collection instruments included biographical surveys, characteristics of curriculum, and assessment scores from a large population of respondents.
These degrees include streams of specialities from four major science streams: earth sciences, biological and life sciences, physical sciences, and mathematical sciences. The dataset originally contained a population of 16 000. Table 3 outlines the original population in more detail according to the decomposition of risk profiles for each year over the different science streams.
To protect the anonymity of all participants and to comply with the South African Protection of Personal Information Act (POPIA), the original data was used to learn a complex joint distribution from which the data used in this study was sampled. The oint distribution was learned using a Bayesian network with Dirichlet priors and sampled using ancestral sampling.
To ensure that the registration year sub-group distribution in the population was retained in the sample, the population was uniformly re-sampled (without replacement) using Stratified Random Sampling to a dataset of 200 respondents per risk class. Eight Strata (sub-groups) were created and sampled from proportionally so that the registration year distribution which exists in the population will also exist in the extracted sample.
The rationale of this work is based on the conceptual framework of Tinto (1975) who relates the biographical and enrolment data of the learner to their vulnerability. McCubbin (2003) argued that is not feasible to assess the role of the Tinto conceptual framework (Tinto, 1975) to play a role in preventing student dropout until the model itself is satisfactorily verified. To this end, this research uses the suggested factors from the Tinto conceptual framework as input from one South African high-education institution. The selection of which features fits into which of these categories is provided in Subsection 3.2.
Although these features are available in most South African universities, there is not enough evidence to generalise the established correlations between the input features and student risk to other higher-education institutions (even within the South African context).
3.2 Features used and information gain
According to Tinto (1975), the description of factors which influence learner vulnerability is broadly determined by their family background, academic potential, and socio-economic status. He solidifies these factors by relating them to (a) background or family characteristics, (b) individual attributes, and (c) pre-college or schooling data. These input factors could be associated with several collected data. The decomposition of these high-level abstractions is outlined into low-level features below. The features used in this study were selected based on their success in predicting learner vulnerability as indicated in Section 2.
For (a) background and family, the following features were used: the country and province/ state from which the learner originated, the quintile associated with the school that the learner comes from, the age of the learner in first-year, and whether their school is an urban or rural school (school type).
For (b) individual attributes, measures of the learners' proficiency in understanding academic literacy, quantitative literacy, and mathematical literacy - to the demands of university-level work - was used. These included the national benchmark tests, NBTAL, NBTQL, and NBTMA respectively (Cliff, 2015; Cliff & Hanslo, 2010; Cliff et al., 2007). The learner's intended plan description and the science stream applied to was also used as a fair indication of what occupation the learner aspires towards for their professional career.
Finally, for (c) pre-college or schooling, the learners' Grade 12 marks for the following subjects were considered: Life Orientation, Core Mathematics, Mathematics Literacy, Additional Mathematics, English Home Language, English First Additional Language, Computer Studies, any additional language, Physical Science, Life Sciences, Agriculture, Mechanical, Sport Science, Geography, Religious Studies, International Relations, Hospitality, Civil Technology, History, Politics, Business Economics, Electrical, Accounting, Statistics, Craft/Speech/Drama, Music, Art/Design, and any foreign subjects. The overall aggregate was also considered along with the APS code (adopted national standardisation to calculate the score), APS value, and the learners' overall aggregate.
Although many attributes were considered which hypothetically contribute to the successful prediction of a learners' risk profile, not all of this data equally contribute to predicting the class variable. The problem of selecting the most appropriate features to predict the class variable is called feature selection. The domain of feature selection is broken up into two-part components: (a) declaring a mechanism to perform feature evaluation with respect to the class variable (risk profile), and (b) using this feature evaluator to navigate combinations of features to derive the information loss of using variables subsets of the feature list (Jovic et al., 2015). Information gain ranking (IGR) was used to perform feature analysis. IGR calculates the reduction in entropy for each feature with respect to the class variable (Risk Profile). The reduction in entropy, or information gain, is expressed as IG, where 0 < IG < log2 n (n is the number of classes). If n = 4 (as in the classification task in this paper), information gain would range from IG = 0 (no information gain) to IG = 2 (maximum information gain).
3.3 Prediction and evaluation
The following six off-the-shelf predictive models were used from different archetypes of machine learning to predict the risk profile of a learner: decision trees, K*, linear logistic regression models, multilayer perceptron, naïve Bayes, and random forests. The justification for the choice of these procedures is two-fold: (a) to provide an overview of the experimental predictive capabilities from well-known machine learning methods; and (b) to leverage on methods which have proven capable for similar tasks as summarised by Table 2.
Decision trees The decision tree algorithm selected for this task was the C4.5 predictive model. The C4.5 algorithm uses information gain to build a decision tree based on the ID3 algorithm. The C4.5 algorithm recursively selects a feature with the greatest information gain to split the training sample. This intuitively allows the most important feature, with respect to the class variable, to make the decisions from the root down the tree. The C4.5 prediction procedure implemented in this paper follows the original algorithm by Quinlan (1993).
K* The K* instance-based classifier uses an entropy-based distance function to classify test instances using the training instance most similar to them. The K* implementation used in this paper closely followed the implementation by Cleary and Trigg (1995). Using an entropy-based distance function allows consistency in the prediction of real-valued and symbolic features found in these experiments.
Linear Logistic Regression Models The linear logistic regression predictive model uses additive logistic regression as mentioned in (Friedman, 1998) with added simple regression functions as base learners. The implementation used in this paper follows Landwehr et al. (2005) and Sumner et al. (2005).
Multilayer Perceptron The multilayer perceptron used in this paper is a feed-forward neural network which uses sigmoid functions to represent the nodes and back-propagation to classify instances. The implementation used in this paper follows Glorot and Bengio (2010).
The Naïve Bayes Model Perhaps the simplest example of a Bayesian model is the naïve Bayes model (NBM) which has been traditionally and successfully used by many expert systems (Khairina et al., 2017). The NBM pre-defines a finite set of mutually exclusive classes.
Each instance could fall into one of these classes and this is represented as a latent class variable. The model also poses some observed sets of features X1,..., Xn. The assumption is that all of the features are conditionally independent given the class label of each instance. That is,
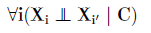
where,
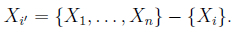
Figure 5 presents the Bayesian network representation of the NBM. The joint distribution of the NBM factorises compactly as a prior probability of an instance belonging to a class, P(C), and a set of conditional probability distributions (CPDs) which indicate the probability of a feature given the class. This distribution is more formally stated as:
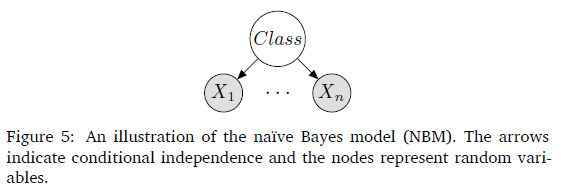
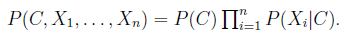
The NBM remains a simple yet highly effective, compact and high-dimensional probability distribution that is often used for prediction problems. The implementation of the NBM follows that of John and Langley (1995).
Random Forests Random decision forests are an ensemble classification learning method that uses the training data to build several decision trees based on the mode of the class variable. This technique of using several decision trees prevents over-fitting compared to a single decision tree. The implementation used in this paper is based on Breiman (2001).
All six of these predictive models are evaluated using a confusion matrix (Ting, 2017) and the associated predictive accuracy is provided alongside each model. A 10-fold cross validation scheme was used (Zhang, 1993).
3.4 Ethics clearance
The study participants were learners who studied at a South African higher-education institution. The study ethics application has been approved by the Human Research Ethics Committee (Non-Medical) of the university. The ethics application addresses key ethical issues of protecting the identity of the learners involved in the study and ensuring the security of data. The clearance certificate protocol number is H19/03/02.
4 RESULTS AND DISCUSSION
This section presents the results of this research and is structured as follows: Subsection 4.1 presents the results of the feature analysis and Subsection 4.2 presents the classification results.
4.1 Feature information gain
Table 4: A ranking of the information gain (denoted IG ) for a set of features to predict the learner's risk profile (class variable). The top nine features are highlighted (IG > 0.1).
This section explores the contribution of each of the 43 features to classify the class variable using IGR. Table 4 illustrates a ranking of the contribution of each feature to classify the risk profile using IGR. The first column indicates the rank of the feature from most contributing feature (rank 1) to least contributing feature (rank 43); column 2 indicates the information gain (reduction in entropy) associated with each feature, where 0 < IG < log24 , where IG = 0 represents no information gain and IG = log24 = 2 is the maximum information gain. The third column indicates the feature name/description. The features are colour coded relating them to Tinto's (1975) conceptual framework (brown indicating background or family, blue indicating individual attributes, and black indicating pre-college or schooling data). Table 4 indicates that the nine most contributing features are the following:
1) the plan code, plan description, majors, and science stream selected by the learner,
2) the year when the learner registered,
3) the age of the learner when they registered,
4) the school quintile of the learner,
5) their Grade 12 Core Mathematics mark, and
6) the home province of the learner.
These results indicate that the background and individual attributes of Tinto (1975) play a dominant role in predicting the vulnerability of the learner.
Although the ranking of the feature set using information gain provides a useful framework for feature elimination, the information gain value also indicates the contribution of each feature relative to the other features. Figure 6 illustrates a plot of the information gain values as ordered in Table 4. As the function in Figure 6 monotonically decreases, the loss in entropy between each subsequent point decreases logarithmically. The nine most contributing features from Table 4 are highlighted.
Table 4 and Figure 6 suggest that the individual attributes of the learner seem to count the most - compared to background and schooling attributes - when predicting the class variable. That is, what the learner chooses to study and the year in which they register for their degree. Many background attributes are also highly ranked, including the age of the learner and which school they come from. Understanding the role that these factors play could help us uncover clues to expedite learner retention and progression and thus degree completion.
4.2 Prediction
This section presents the result of the prediction models. The following six predictive procedures were employed in this paper: decision trees, K*, naïve Bayes, feed-forward neural networks, random forests, and linear logistic regression models. The relative build-time is also provided for practical applications and model replication. Figure 7 indicates the result of each of these classifiers to predict the class variable.
Figure 7(a) illustrates the confusion matrix for the multilayer perceptron predictive model which achieves 85% accuracy (680 correctly classified instances and 120 incorrectly classified instances) using 10-fold cross validation, the highest prediction accuracy achieved in this paper. Compared to the other five predictive models employed in this paper the multilayer perceptron took the longest time to build.
Figure 7(b) illustrates the confusion matrix for the random forest predictive model which achieves 84% accuracy (674 correctly classified instances and 126 incorrectly classified instances) using 10-fold cross validation. With the exception of the K*, naïve Bayes, and C4.5, compared to the other three predictive models employed in this paper the random forest model took the least time to build.
Figure 7(c) illustrates the confusion matrix for the C4.5 predictive model which achieves 84% accuracy (673 correctly classified instances and 127 incorrectly classified instances) using 10-fold cross validation. With the exception of the K* and naïve Bayes, compared to the other three predictive models employed in this paper the C4.5 model took the least time to build.
Figure 7(d) illustrates the confusion matrix for the linear logistic regression predictive model which achieves 83% accuracy (661 correctly classified instances and 139 incorrectly classified instances) using 10-fold cross validation. With the exception of the multilayer perceptron predictive model, the linear logistic regression model took the longest time to build.
Figure 7(e) illustrates the confusion matrix for the naïve Bayes predictive model which achieves 82% accuracy (655 correctly classified instances and 145 incorrectly classified instances) using 10-fold cross validation. With the exception of the K* predictive model, from the other five models employed in this paper the naïve Bayes took the least time to build.
Figure 7(f) illustrates the confusion matrix for the K* predictive model which achieves 75% accuracy (601 correctly classified instances and 199 incorrectly classified instances) using 10-fold cross validation. From all six predictive models employed in this paper K* took the least time to build.
Using the APS score alone as an input feature into the multilayer perceptron achieves only 30% accuracy, the Linear Logistic prediction model achieves 34%, and naïve Bayes achieves 28% accuracy. When including the learners' Grade 12 Mathematics or Mathematics Literacy mark and English Home Language or First Additional Language mark to predict the learners' vulnerability alongside the APS; the Multilayer perception, linear logistic regression, and naïve Bayes increases to 50%, 44%, and 38% respectively. Randomly guessing the class variable would result in 25% accuracy since there are four risk profiles (one out of four).
Although using the APS does provide a higher predictive accuracy than randomly guessing the vulnerability of the learner, it is clear from Figure 7 that incorporating the biographical and individual data into the predictive models yields a higher accuracy than just using the APS alone, or even using the APS in conjunction with the Mathematics or English grades.
Although the combined feature set achieves 85% accuracy over predicting learner vulnerability, using the multilayer perceptron, not all the listed features in Table 4 provide an equal contribution towards correctly classifying the class variable. While the graph in Figure 6 monotonically decreases, the contribution of each subsequent feature is similar after the seventeenth rank, which means that an increasingly smaller entropy is lost with every employed subsequent feature. An example of the practical implication of this is that trading off Grade 12 Mathematics Literacy for Agriculture may result in less information gain (IG ~ 0.000436) than trading off the learner's science stream for Grade 12 Core Mathematics (IG ~ 0.1535).
In terms of interpreting the recorded incorrectly classified instances, the severity of the misclassifications indicated in Figure 7 vary. For example the misclassification of one no risk instance by the random forest as high risk is far more severe than the misclassification of nineteen no risk instances by the multilayer perceptron as low risk, given the definition of the class labels and sensitivity of instances being incorrectly classified. In a practical implication it may be better to present the distribution of the likelihood of a sample to belong to a set of classes as a probability distribution (e.g., no risk: 10%, low risk: 35%, medium risk: 30%, high risk: 25%). This way borderline misclassifications could be handled using a more intelligible strategy and within context.
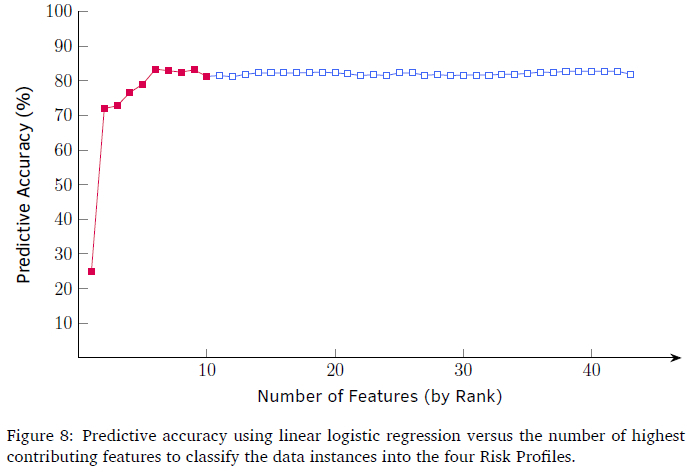
Using the linear logistic regression predictive model and the IGR feature ranking in Table 4, Figure 8 presents the performance of the linear logistic regression model using consecutive subsets of features. Figure 8 illustrates the predictive accuracy versus the number of highest contributing features to classify the data instances into the four risk profiles.
Figure 8 shows that using the plan description results in an increase of 45% accuracy using the linear logistic regression model. Furthermore, using just the first ten features in Table 4 achieves 80% accuracy and features ranked between 14 to 43 result in only minor prediction accuracy improvement (<5%). However, only using the Plan Code results in performance which is no better than random guessing (25%). The next section provides implications of this work, future research avenues, and concluding remarks.
4.3 Application
The example in Figure 9 attempts to reveal the predicted posterior distribution over the four risk profiles (no risk, low risk, medium risk, and high risk) using a learner with the following data: from Gauteng in South Africa; from an urban school with a quintile of 3; registered at age 18; with a 55%, 50%, and 62% score in the National Benchmark tests on Academic Literacy, Mathematical Literacy, and Quantitative Literacy respectively; with a plan description of BSc in Mathematical Science majoring in Computer Science; achieving a 70% in Life Orientation; 65% in Core Mathematics; 55% in Additional Mathematics; 72% in English Home Language; 60% in Computer Studies; 65% in Physical Sciences; 70% in Life Sciences; and 60% in Geography.
The output of the program is that the learner is hypothetically 15% likely to be at no risk; 45% likely of being at low risk; 30% likely to be at medium risk; and 10% likely to be at high risk. The underlying model used to perform the prediction task in the WebApp is the multilayer perceptron which gave the best predictive accuracy of all the models used in this paper.
5 IMPLICATIONS, CONCLUSION, AND FUTURE WORK
The significance of this paper is to develop a framework to identify potential factors that could be used to predict learner vulnerability with a view to addressing the poor throughput or retention rates at South African higher-education institutions. The methodology in this paper could be duplicated in other contexts to determine the potential factors that could influence learner vulnerability, since the broad causal factors linked to learner vulnerability cannot easily be uncovered.
This research acknowledges that the latent causal factors that gives rise to the ground-truth distribution which relates student factors to their attrition rates are not formally understood and that these associated factors differ from institution to institution. Therefore the process of testing the factors which hypothetically can be linked to student attrition needs to be contextually established for a specific institution considered.
We therefore recommend the following framework: (a) establish potential candidate features linked to student vulnerability - this research uses the conceptual framework of Tinto (1975) as a rationale; (b) evaluate the ability of these factors to predict student vulnerability with respect to several benchmarks (perhaps using an APS equivalent). Although the learned distribution may not converge to a ground-truth distribution related to learner vulnerability, the results could be a more suitable description than using the APS score. Since the contextual dynamics may be influenced by political, biological (e.g. COVID-19), and sensitive to pedagogical and curriculum changes, this framework should be routinely revisited and historical data should be considered carefully on its relevance.
Due to the increased intake of learners at many South African universities, a shrinking amount of resources and attention is being provided to diagnose learner vulnerability. Therefore, automatically forecasting learner vulnerability via an early warning system is essential. More specifically, predicting when students will experience vulnerabilities in their chosen curriculum allows the university to intervene early which may prevent the student from dropping out.
The results of the proposed programme recommendation engine achieved a higher classification accuracy than any of the models in Table 2. Although my previous work underlines the importance of biographical characteristics Ajoodha, Jadhav et al. (2020), this paper emphasises the value of the learners' individual attributes such as their choice of plan code, majors, and chosen science stream. These individual attributes seem to indicate the learner's vulnerability more than any background or scholastic attribute.
More research is needed to measure the influence of abstract individual attributes to learner vulnerability (which have been indicated in related work) such as motivation, determination, and commitment - in addition to the features used in this paper. These factors will help us communicate the Institutional Commitment of the Tinto (1975) conceptual framework, and its relationship to structure, culture, and agency of the learner (Longden, 2004).
The broad contribution of this work is in providing a more complex view to identifying vulnerable learners than using the APS score. Thus an outcome of this research is a predictive practical tool which uses the learner's background, individual, and scholastic attributes to flag them as a viable or deserving recipient of support (through early interventions) to increase their chances of completing their academic programme. Figure 9 presents an interface for such a tool.
Based on the conceptual framework of Tinto (1975), future avenues of research can:
a) explore the impact of the highly ranked features in Table 4 on learner vulnerability,
b) model the learner in the academic system through their grade performance and intellectual development, or
c) incorporate data which reveal peer-group interactions and faculty interactions in the social system.
These future avenues contribute mainly towards understanding the factors which relate to student retention and thus the progression of the student toward completing their undergraduate degree. Moreover, the implications of using the tool presented in Figure 9 to predict learner vulnerability could also be studied by intervention specialists at higher-education institutions.
ACKNOWLEDGEMENTS
This work is based on the research supported in part by the National Research Foundation of South Africa (Grant number: 121835). All the anonymous reviewers are thanked for their critically reading of this manuscript and suggesting improvements.
References
Ajoodha, R., Dukhan, S., & Jadhav, A. (2020). Data-driven student support for academic success by developing student skill profiles. 2nd International Multidisciplinary Information Technology and Engineering Conference (IMITEC 2020), 1-8. https://doi.org/10.1109/IMITEC50163.2020.9334109
Ajoodha, R., Jadhav, A., & Dukhan, S. (2020). Forecasting learner attrition for student success at a South African university. Conference of the South African Institute of Computer Scientists and Information Technologists (SAICSIT 2020), 19-28. https://doi.org/10.1145/3410886.3410973
Arsad, P. M., Buniyamin, N., & Manan, J.-l. A. (2013). A neural network students' performance prediction model (NNSPPM). 2013 IEEE International Conference on Smart Instrumentation, Measurement and Applications (ICSIMA), 273-277. https://doi.org/10.1109/ICSIMA.2013.6717966
bin Mat, U., Buniyamin, N., Arsad, P. M., & Kassim, R. (2013). An overview of using academic analytics to predict and improve students' achievement: A proposed proactive intelligent intervention. 2013 IEEE 5th Conference on Engineering Education (ICEED), 126-130. https://doi.org/10.1109/ICEED.2013.6908316
Bogarín, A., Romero, C., Cerezo, R., & Sánchez-Santillán, M. (2014). Clustering for improving educational process mining. Proceedings of the Fourth International Conference on Learning Analytics and Knowledge, 11-15. https://doi.org/10.1145/2567574.2567604
Breiman, L. (2001). Random forests. Machine Learning, 45(1), 5-32. https://doi.org/10.1023/A:1010933404324 [ Links ]
Brotherton, B. (2015). Researching hospitality and tourism. Sage. https://us.sagepub.com/en-us/nam/researching-hospitality-and-tourism/book242749
Bryant, T. E. (1978). The effect of student failure on the quality of family life and community mental health. Bulletin of the Orton Society, 28(1), 8-14. https://doi.org/10.1007/BF02653423 [ Links ]
Buang, Z., Mohamad, M. M., Ahmad, A., & Yuniarti, N. (2020). The earnings and employment of community colleges' graduates: Occupational field and gender analysis. Jurnal Pen-didikan Teknologi danKejuruan, 26(1), 11-17. https://doi.org/10.21831/JPTK.V26I1.29750 [ Links ]
Bunkar, K., Singh, U. K., Pandya, B., & Bunkar, R. (2012). Data mining: Prediction for performance improvement of graduate students using classification. 2012 IFIP International Conference on Wireless and Optical Communications Networks (WOCN), 1-5. https://doi.org/10.1109/WOCN.2012.6335530
Christian, T. M., & Ayub, M. (2014). Exploration of classification using NBTree for predicting students' performance. 2014 International Conference on Data and Software Engineering (ICODSE), 1-6. https://doi.org/10.1109/ICODSE.2014.7062654
Cleary, J. G., & Trigg, L. E. (1995). K*: An instance-based learner using an entropic distance measure. Proceedings of the Twelfth International Conference on Machine Learning, 108114. https://doi.org/10.1016/B978-1-55860-377-6.50022-0
Cliff, A. (2015). The national benchmark test in academic literacy: How might it be used to support teaching in higher education? In Language matters (pp. 3-21). Routledge, UNISA Press. http://dx.doi.org/10.1080/10228195.2015.1027505
Cliff, A., & Hanslo, M. (2010). The design and use of 'alternate' assessments of academic literacy as selection mechanisms in higher education. Southern African Linguistics and Applied Language Studies, 27(3), 265-276. https://doi.org/10.2989/SALALS.2009.27.3.5.939 [ Links ]
Cliff, A., Ramaboa, K., & Pearce, C. (2007). The assessment of entry-level students' academic literacy: Does it matter? Ensovoort, 11(2), 33-48. http://dx.doi.org/10.10.80/10228195.2014.958519 [ Links ]
Coffrin, C., Corrin, L., de Barba, P., & Kennedy, G. (2014). Visualizing patterns of student engagement and performance in MOOCs. Proceedings of the Fourth International Conference on Learning Analytics and Knowledge, 83-92. https://doi.org/10.1145/2567574.2567586
Cornelius, L. M., & Frank, S. A. (2015). Student loan debt levels and their implications for borrowers, society, and the economy. Educational Considerations, 42(2), 35-38. https://doi.org/10.4148/0146-9282.1052 [ Links ]
Enslin, P. (2003). Citizenship education in post-apartheid South Africa. Cambridge Journal of Education, 33(1), 73-83. https://doi.org/10.1080/0305764032000047513 [ Links ]
Feather, N. T., & Davenport, P. R. (1981). Unemployment and depressive affect: A motivational and attributional analysis. Journal of personality and social psychology, 41(3), 422-436. https://doi.org/10.1037//0022-3514.41.3.422 [ Links ]
Fitzgibbon, K., & Prior, J. (2006). Students' early experiences and university interventions-a timeline to aid undergraduate student retention. Widening Participation and Lifelong Learning, 8(3), 17-27. http://dx.doi.org/10.1080/01587919.2011.584846 [ Links ]
Friedman, N. (1998). The Bayesian structural EM algorithm. Proceedings of the Fourteenth conference on Uncertainty in Artificial Intelligence, UAI'98, 129-138. https://dl.acm.org/doi/10.5555/2074094.2074110
Glorot, X., & Bengio, Y. (2010). Understanding the difficulty of training deep feedforward neural networks. In Y. W. Teh & M. Titterington (Eds.), Proceedings of the Thirteenth International Conference on Artificial Intelligence and Statistics (pp. 249-256). PMLR. https://proceedings.mlr.press/v9/glorot10a.html
Gray, G., McGuinness, C., & Owende, P. (2014). An application of classification models to predict learner progression in tertiary education. 2014 IEEE International Advance Computing Conference (IACC), 549-554. https://doi.org/10.1109/13.965780
Hidayah, I., Permanasari, A. E., & Ratwastuti, N. (2013). Student classification for academic performance prediction using neuro fuzzy in a conventional classroom. 2013 International Conference on Information Technology and Electrical Engineering (ICITEE), 221-225. https://doi.org/10.1109/ICITEED.2013.6676242
John, G. H., & Langley, P. (1995). Estimating continuous distributions in Bayesian classifiers. Eleventh Conference on Uncertainty in Artificial Intelligence, 338-345. https://dl.acm.org/doi/proceedings/10.5555/2074158
Jovic, A., Brkic, K., & Bogunovic, N. (2015). A review of feature selection methods with applications. 2015 38th International Convention on Information and Communication Technology, Electronics and Microelectronics (MIPRO), 1200-1205. https://doi.org/10.1109/MIPRO.2015.7160458
Khairina, D. M., Maharani, S., Hatta, H. R., et al. (2017). Decision support system for admission selection and positioning human resources by using naïve Bayes method. Advanced Science Letters, 23(3), 2495-2497. https://doi.org/10.1166/asl.2017.8653 [ Links ]
Landwehr, N., Hall, M., & Frank, E. (2005). Logistic model trees. Machine learning, 59(1), 161-205. https://doi.org/10.1007/S10994-005-0466-3 [ Links ]
Longden, B. (2004). Interpreting student early departure from higher education through the lens of cultural capital. Tertiary Education & Management, 10(2), 121-138. 10.1023/B:TEAM.0000023836.16827.5A [ Links ]
Manik, S. (2015). Calibrating the barometer: Student access and success in South African public higher education institutions. Alternation Special Edition, 17(6), 226-244. http://alternation.ukzn.ac.za/Files/docs/22%20SpEd17/12%20Manik%20F.pdf [ Links ]
Mashige, K. P., Rampersad, N., & Venkatas, I. S. (2014). Do National Senior Certificate results predict first-year optometry students' academic performance at university? South African Journal of Higher Education, 28(2), 550-563. https://doi.org/10.20853/28-2-348 [ Links ]
Mayilvaganan, M., & Kalpanadevi, D. (2014). Comparison of classification techniques for predicting the performance of students' academic environment. 2014 International Conference on Communication and Network Technologies, ICCNT, 113-118. https://doi.org/10.1109/CNT.2014.7062736
McCubbin, I. (2003). An examination of criticisms made of Tinto's 1975 student integration model of attrition. https://www.psy.gla.ac.uk/~steve/localed/icubb.pdf
McKenna, S. (2010). Cracking the code of academic literacy: An ideological task. In Beyond the university gates: Provision of extended curriculum programmes in South Africa (pp. 8-15). https://www.researchgate.net/publication/276174049_McKenna_S_2010_'Cracking_the_code_of_academic_literacy_An_ideological_task'_Beyond_the_university_gates_Provision_of_Extended_Curriculum_Programmes_in_South_Africa_Hutchings_and_Garraway_Editor
Minaei-Bidgoli, B., Kashy, D. A., Kortemeyer, G., & Punch, W. F. (2003). Predicting student performance: An application of data mining methods with an educational web-based system. Frontiers in Education (FIE 2003) 33rd annual, 1, 13-18. https://doi.org/10.1109/FIE.2003.1263284
Mishra, T., Kumar, D., & Gupta, S. (2014). Mining students' data for prediction performance. Proceedings of the 2014 4th International Conference on Advanced Computing & Communication Technologies, 255-262. https://doi.org/10.1109/ACCT.2014.105
Montalto, C. P., Phillips, E. L., McDaniel, A., & Baker, A. R. (2019). College student financial wellness: Sstudent loans and beyond. Journal of Family and Economic Issues, 40(1), 3-21. https://doi.org/10.1007/s10834-018-9593-4 [ Links ]
Natek, S., & Zwilling, M. (2014). Student data mining solution-knowledge management system related to higher education institutions. Expert Systems with Applications, 41 (14), 64006407. https://doi.org/10.1016/j.eswa.2014.04.024 [ Links ]
Naylor, R. (2007). Whose degree is it anyway?: Why, how and where universities are failing our students. Professor Robert Naylor. https://books.google.co.za/books?id=NJQwKwAACAAJ
Ngo, F., & Kwon, W. W. (2015). Using multiple measures to make MATH placement decisions: Implications for access and success in community colleges. Research in Higher Education, 56(5), 442-470. https://doi.org/10.1007/s11162-014-9352-9 [ Links ]
Oladokun, V., Adebanjo, A., & Charles-Owaba, O. (2008). Predicting students' academic performance using a artificial neural network: A case study of an engineering course. The Pacific Journal of Science and Technology, 72-79. http://ir.library.ui.edu.ng/handle/123456789/1796
Osmanbegovic, E., & Suljic, M. (2012). Data mining approach for predicting student performance. Economic Review: Journal of Economics and Business, 10(1), 3-12. http://hdl.handle.net/10419/193806 [ Links ]
Parack, S., Zahid, Z., & Merchant, F. (2012). Application of data mining in educational data-bases for predicting academic trends and patterns. 2012 IEEE International Conference on Technology Enhanced Education (ICTEE), 1-4. https://doi.org/10.1109/ICTEE.2012.6208617
Quinlan, R. (1993). C4.5: Programs for machine learning. Morgan Kaufmann Publishers.
Ramesh, V., Parkavi, P., & Ramar, K. (2013). Predicting student performance: A statistical and data mining approach. International Journal of Computer Applications, 63(8), 35-39. https://doi.org/10.5120/10489-5242 [ Links ]
Ramley, J. A. (2014). The changing role of higher education: Learning to deal with wicked problems. Journal of Higher Education Outreach and Engagement, 18(3), 7-22. https://openjournals.libs.uga.edu/jheoe/article/view/1133 [ Links ]
Romero, C., López, M.-I., Luna, J.-M., & Ventura, S. (2013). Predicting students' final performance from participation in on-line discussion forums. Computers & Education, 68, 458472. https://doi.org/10.1016/jxornpedu.2013.06.009
Romero, C., Ventura, S., Espejo, P. G., & Hervás, C. (2008). Data mining algorithms to classify students. 1st Educational data mining 2008. https://www.educationaldatamining.org/EDM2008/uploads/proc/19_Romero_19.pdf
Schreiber, B., Luescher-Mamashela, T., & Moja, T. (2014). Tinto in South Africa: Student integration, persistence and success, and the role of student affairs. Journal of Student Affairs in Africa, 2(2). https://doi.org/10.14426/jsaa.v2i2.64 [ Links ]
Sembiring, S., Zarlis, M., Hartama, D., Ramliana, S., & Wani, E. (2011). Prediction of student academic performance by an application of data mining techniques. International Conference on Management and Artificial Intelligence IPEDR, 6(1), 110-114. http://www.ipedr.com/vol6/21-A10015.pdf [ Links ]
Simsek, A., & Balaban, J. (2010). Learning strategies of successful and unsuccessful university students. Contemporary Educational Technology, 1(1), 36-45. https://doi.org/10.30935/cedtech/5960 [ Links ]
Siyaphumelela. (2018). Seeing students as people in the world [Accessed 15 November 2022]. https://www.siyaphumelela.org.za/conf/2016/data/Presentation21.pdf
Sumner, M., Frank, E., & Hall, M. (2005). Speeding up logistic model tree induction. 9th European Conference on Principles and Practice of Knowledge Discovery in Databases, 675683.
Thai-Nghe, N., Horváth, T., & Schmidt-Thieme, L. (2010). Factorization models for forecasting student performance. 4th Educational Data Mining 2011, 11-20. https://educationaldatamining.org/EDM2011/proceedings-2
Ting, K. M. (2017). Confusion matrix. In C. Sammut & G. I. Webb (Eds.), Encyclopedia of machine learning and data mining (pp. 260-260). Boston, MA: Springer. https://doi.org/10.1007/978-1-4899-7687-1_50
Tinto, V. (1975). Dropout from higher education: A theoretical synthesis of recent research. Review of Educational Research, 45(1), 89-125. http://dx.doi.org/10.3102/00346543045001089 [ Links ]
Tucker, C., Pursel, B. K., & Divinsky, A. (2014). Mining student-generated textual data in MOOCs and quantifying their effects on student performance and learning outcomes. TheASEE Computers in Education (CoED) Journal, 5(4), 84-95. https://doi.org/10.18260/1-2--22840 [ Links ]
Wang, T., & Mitrovic, A. (2002). Using neural networks to predict student's performance. In-ternattional Conference on Computers in Education, 969-973. https://doi.org/10.1109/CIE.2002.1186127
Yeld, N., & Haeck, W. (1997). Educational histories and academic potential: Can tests deliver? Assessment & Evaluation in Higher Education, 22(1), 5-16. https://doi.org/10.1080/0260293970220101 [ Links ]
Zhang, P. (1993). Model selection via multifold cross validation. The Annals of Statistics, 21(1), 299-313. https://doi.org/10.1214/aos/1176349027 [ Links ]
Received: 3 May 2020
Accepted: 21 August 2022
Available online: 5 December 2022
1 Many South African Institutions use the APS as a means for learner placement. As an example, consider the University of Johannesburg APS requirements for various degrees based on the NSC Admission Requirements: https://www.uj.ac.za/faculties/febe/Pages/UndergraduateFEBE.aspx.

