


Services on Demand
Article
 English (pdf)
 Article in xml format
 Article references
Indicators

Related links
-
 Cited by Google
 -
 Similars in Google
Share

 Permalink
South African Computer Journal
On-line version ISSN 2313-7835
Print version ISSN 1015-7999
SACJ vol.33 n.2 Grahamstown Dec. 2021
http://dx.doi.org/10.18489/sacj.v33i2.928
RESEARCH ARTICLE
Big Data Driven Decision Making Model: A case of the South African banking sector
Komla Pillay; Alta van der Merwe
Department of Informatics, University of Pretoria, South Africa
ABSTRACT
The quest to develop a Big Data Driven Decision Making framework to support the incorporation of big data analytics into the decision-making process resulted in the development of a decision making model. The study was conducted within the banking sector of South Africa, with participants from three leading South African banking institutions. The conducted research followed the design science research process of awareness, suggestion, development, evaluation and conclusion.
This study developed a theoretical Big Data Driven Decision Making model which illustrates the decision-making process in banking using big data. The study further determined the organizational supports that need to be in place to support the big data analytics decision-making process.
CATEGORIES: · Information systems ~ Data analytics
Keywords: big data, big data analytics, innovation, decision-making, banking sector, design science, theoretical model, organizational support
1 INTRODUCTION
Fast paced technology advancements have reshaped organizations over the years and have challenged these organizations to keep up with the changes. One such technology trend that has emerged is the use of big data analytics with the potential to enhance knowledge within an organization (Ishwarappa & Anuradha, 2015). Decision-making regarding big data analytics within organizations ultimately influences innovation within organizations. Many organizations are unsure of how to proceed with this innovation in order to embrace all of the possibilities. An investigation into existing big data analytics business models only yielded the Gartner's Business Analytics Framework. This framework defines the people,
processes and platforms that need to be integrated and aligned to take a more strategic approach to business intelligence, analytics and performance. (Chandler et al., 2011)
The framework does not identify organizational supports and guidelines that need to be in place for the incorporation of big data analytics into managerial decision-making.
Big data is a collection of large, complex sets of data which includes data from social media and real-time system records (Ishwarappa & Anuradha, 2015). The big data analytics era has introduced new methods for extracting and analyzing information in order to gain insights into the organizations, customers and business processes (Xu et al., 2016). Big data was used to highlight the challenges that the visualization of data would mean in the computing world. It was then defined for its volume, velocity, and variety of information which meant that sophisticated software had to be designed in order to handle the data. At the beginning of 2009, big data analytics became revolutionary and signaled new opportunities for business intelligence. Researchers began to predict that data collected will shift from structured to unstructured (Wang et al., 2018).
Big data analytics can help organizations make better and faster decisions. There is an opportunity to supplement the current managers' intuitive and experienced based decisions with data driven insights. There is a need for managers to better incorporate big data analytics into the decision-making process. In order for managers to better make use of big data analytics, they must first understand what the decision-making process looks like with big data analytics. They also need to understand what organizational supports need to be in place to support the big data analytics decision-making process.
1.1 Big Data Analytics in Banking
Decision makers within organizations rely on the quality, relevance and validity of the information when making key organizational decisions. Data storage technology and data gathering techniques have progressively improved. This innovative environment has created a new era for various sectors especially the banking sector. Banks have the opportunity to improve their customer information, products, risk measurement and market expectations. Banking institutions have embraced analytics but turning the analytical insights into business outcomes has been a challenge. Big data analytics success requires business adoption and change management. In 2018, only 7% of banks in the EMEA (Europe, Middle East & Africa) region had attained complete incorporation of important analytics use cases. Only 15% of banks in the EMEA region think that the management relies on analytics to make decisions. There is 20% of staff in EMEA banks that believe their management can be convinced by big data analytical insights that go against their original belief. Half of the management in the surveyed banks in the EMEA region, responded positively to the value that analytics offers their institution with only 25% effectively communicating how operational capacity can be improved (Naveira et al., 2018).
Many banking and other organizations are focusing on the development of tools that enable the storing and processing of these large volumes of structured and unstructured data. Organizations thereafter invest time and financial resources to enable their staff to use these tools. There is a gap in the research that there is not much attention placed on managers who use these progressive tools that generate smarter information. There is no process or system to monitor the impact of this on the organizations' decision-making cycle. Furthermore, there are no models, guidelines or frameworks to assist managers in incorporating big data analytics to support their decision-making.
The purpose of this study was to develop a model that can be used to assist managers in incorporating big data analytics into decision-making in the banking sector. The development of the model entailed establishing a set of criteria for the selection of an existing decision-making model that supports the incorporation of big data analytics, establishing the content of a decision-making model that includes big data analytics and developing an organizational supports model that can be used in conjunction with a decision-making model to promote the facilitation of big data analytics for decision-making in banking.
2 THEORETICAL FOUNDATION
The fundamental theories and models used for the development of the Big Data Driven Decision-Making models include Capgemini's Big Data Maturity model, Simon's decision-making model and the data pyramid.
2.1 Capgemini's Big Data Maturity Model
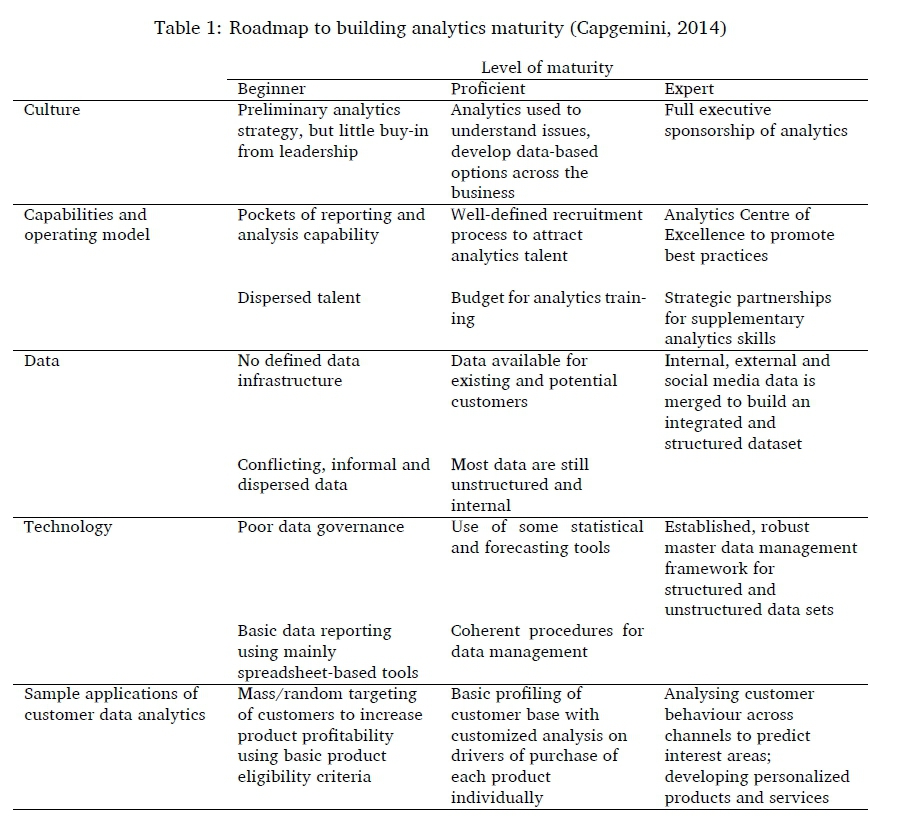
The level at which an institution has adopted big data analytics can be described using the Capgemini's Big Data Maturity model - outlined in Table 1. This model defines three levels of big data maturity: beginner, proficient and expert. The model rates each level against four categories: culture, capabilities and operating model, data and technology. Organizations within the banking sector can move to a higher level of maturity by possibly hiring and training the right analytics staff with continuous upskill options to stay abreast of new developments in big data analytics tools and techniques. Further to this, decision-making staff within the organization should also be trained on the use of analytics so their reliance on specialized analytics staff is diminished thereby enhancing the decision-making process (Capgemini, 2014).
2.2 Simon's Decision-Making Model
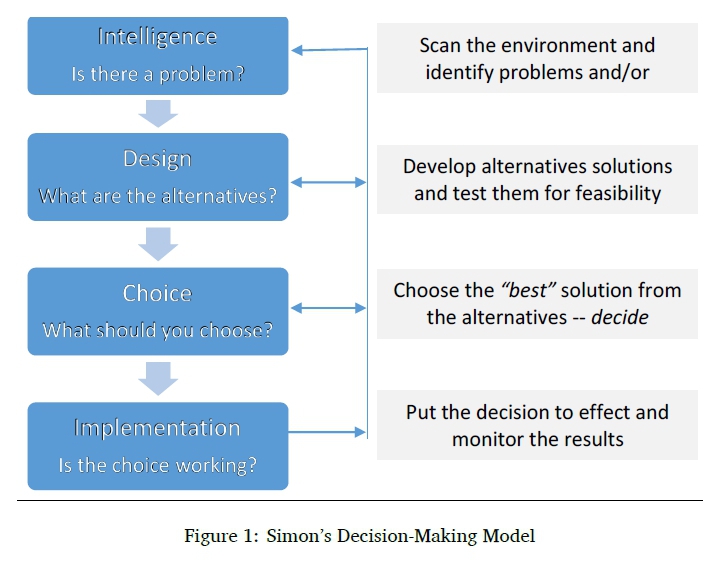
Herbert Simon's (1979) decision-making model as depicted in Figure 1, forms the basis of many decision-making models and has proven to stand the test of time. Simon's model depicts the decision-making process as either a linear or iterative flow of steps. At any point in the process, the decision maker may choose to revisit a previous step for further refinement. The phases of Simon's decision-making model are - Intelligence: the problem or opportunity is identified and relevant information is thereafter gathered. This is a time consuming, critical stage because the decision emanates from the information. The decision can only be as good as the information gathered; Design: several possible solutions for the problem or approaches to capitalize on an opportunity are developed. This phase includes intense research into the different available options; Choice: this phase evaluates the alternatives outlined in the design phase. The end result is a chosen option for implementation; and Implementation: the chosen option is implemented. If the chosen option is unsuccessful, then the decision-making process starts again at Intelligence or alternatively, the Design and Choice phases are revisited (Simon, 1979)
2.3 Data Pyramid / Wisdom Hierarchy
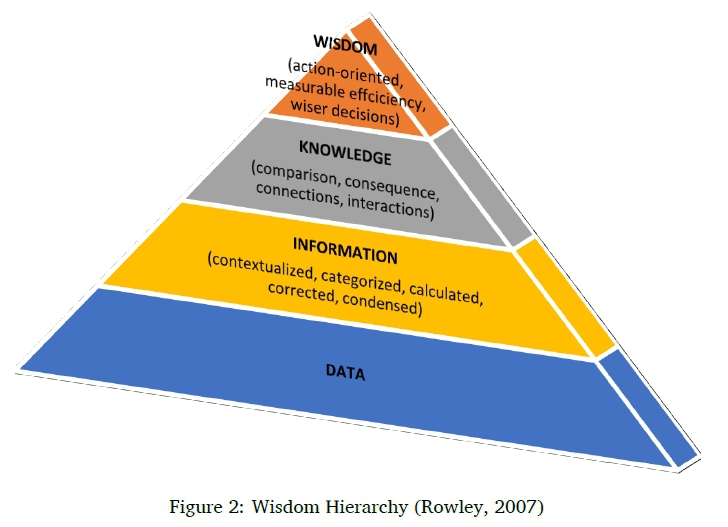
The wisdom hierarchy as depicted in Figure 2, starts at data, progressing to information, then knowledge and finally wisdom. Data is seen as the initial building block which can be categorized and corrected to become information. Likewise, information can be compared or connected to become knowledge and lastly wiser decisions can thereafter be made (Rowley, 2007). The importance of the generation of suitable knowledge being input into the decisionmaking process is known. The theoretical BDDDM model shows how the steps involved in decision-making process correspond to the wisdom hierarchy. It references the wisdom hierarchy from data to information to knowledge to wisdom. The wisdom level is able to be achieved due to big data analytics enabling action oriented automatic decisions and the ability to measure efficiency using tracking analytics.
3 METHODOLOGY
The design science research methodology as outlined by Vaishnavi and Kuechler (2011) was followed for this research. A convenience sample was used for the study that included three of the five major banking institutions in South Africa. One interview and two questionnaires were administered for this research. In total six participants, two from each sampled institution were interviewed and surveyed. The participants were the Chief Information Officers (Chief Information Technology Officers) and another senior member of staff. A letter was sent to the Chief Information Officers of the selected banks, requesting their participation together with the participation of another senior member of their team. The senior staff members that participated were selected by the Chief Information Officers themselves.
The Big Data Driven Decision Making (BDDDM) framework was developed via three iterations with the findings from one of the iterations adding value to the next development iteration. The design research strategy as implemented by this research project is outlined below:
Cycle 1 was to be aware of, suggest and develop the theoretical model for big data driven decision-making for banking. This was achieved through a literature review and insight gained from interviews. The theoretical model provided the foundation for the next core development cycle and represented the development of the first construct for the Big Data-Driven Decision-Making (BDDDM) framework. The theoretical DDDM model was used as a base to construct the theoretical BDDDM model.
Cycle 2 was to be aware of, suggest and develop the organizational supports for big data driven decision-making for banking. This was achieved through a literature review and analysis of the questionnaire and interview data. The organizational supports model provided the input for the next core development cycle and represented the development of the second construct for the BDDDM framework.
Cycle 3 was to be aware of, suggest and develop the management guideline structure for the use of big data in decision-making. This cycle is not included in this paper.
The development phase was followed by the testing of the presented theoretical BDDDM model and guidelines by means of a proof of concept. The assessment of the practicality or usability, reliability, and efficiency was conducted by administering a test questionnaire to the participants from the three cases.
This paper will only detail the findings of cycle 1 and cycle 2, which resulted in the theoretical and organizational supports model for Big Data Driven Decision Making Model.
4 DATA COLLECTION
The data collection techniques used to establish a set of criteria for the selection of a base decision-making model (for cycle 1) that supports the incorporation of big data analytics was conducted by surveying the literature for managerial and data-driven decision-making models. The sample of the decision-making models was managerial or data driven due to the nature of the research being undertaken which is the development of managerial guidelines in a big data environment.
The data collection techniques used to establish the content of a decision-making model and the necessary organizational supports included literature review, structured questionnaire and semi-structured interview.
Purposive non-probability research sampling was used. Purposive sampling is based on using one's judgment to select cases that will enable the research objectives to be met. It is often used when working with small samples. This research project selected three banking institutions where participants were administered questionnaires and interviewed. The three chosen banking institutions are on the top five biggest banks in South Africa list (Smith, 2017). South Africa has five big banking institutions whose rating is based on the number of South African banking customers. The research population for this research study is the top five South African banking institutions. The reason that this was chosen as the research population - the more established institutions are likely to be market leaders and have the necessary infrastructure to adopt the latest market trends like big data. The sample size for this research project was three institutions of a sample population of five. The number of respondents from each sample institution was small due to the nature of the information that was gathered together with the high-profile positions of the personnel that were interviewed. Sampled personnel included executive and senior information officers from the chosen institutions.
5 DATA ANALYSIS
5.1 Cycle 1 data analysis
The data analysis to determine a suitable model to adapt for big data analytics decision-making was carried out by comparing the various decision-making models according to the criteria that was determined by a Systematic Literature Review (SLR). The SLR established selection criteria were: focus on quality, incorporates decision support system technology, focus on meaningful insights, staff data literacy in an organizational environment, incorporates evaluation, incorporates the core phases of decision-making (intelligence, Design, Choice and Implementation), and focus on big data. The Data Driven Decision Making (DDDM) model was the most suitable decision-making model for adaptation. Figure 3 depicts the DDDM model. Although this data driven decision-making model originated in the education sector, the translation of this model to incorporate big data is seamless as it best fits the identified criteria. The key criteria is illustrated by the blocks with italic font-this was added on the original DDDM model in order to demonstrate the suitability of the model.
The theoretical Big Data Driven Decision Making (BDDDM) Model was created using exploratory data analysis. The process of adapting the theoretical DDDM model to the theoretical BDDDM model followed four steps:
1. illustrate how the phases of Simon's decision-making model maps to the different steps of big data analytics,
2. re-map the levels of the wisdom hierarchy to the steps for the analysis of big data,
3. map the different levels of decision-making in the banking sector, and
4. explain the role of technology tools from the perspective of big data analytics.
5.2 Cycle 2 data analysis
The BDDDM Organizational Supports was also created using exploratory data analysis. This model was formed by identifying the organizational supports necessary for big data and thereafter identifying the corresponding steps for the organizational supports.
6 RESEARCH FINDINGS
6.1 Cycle 1 Research Findings
The shortlisted decision-making models were assessed against the criteria to determine that the Data Driven Decision Making (DDDM) model was the most suitable for adaptation. The Data Driven Decision Making Model met six of the seven established criteria. This model resonates the best with the proposed research due to its focus on the role of data in the decision-making process.
The objective for developing the theoretical BDDDM model was to demonstrate how decisionmaking works when big data analytics is incorporated into the decision-making process. Incorporating Simon's Decision-Making model resulted in the addition of the intelligence, design, choice and implementation phases. The decision-making phases outlined in Simon's decision-making model was incorporated into the newly created BDDDM model. The reason for the inclusion is that Simon's model is seen as a standard for decision-making models as many decision-making models use this model as their base. It also serves to assist the decision-maker to understand which phase of the decision-making cycle the different big data analysis steps are positioned.
Thereafter the identified DDDM model shows how the steps involved in the decision-making process correspond to the wisdom hierarchy. It references the wisdom hierarchy from data to information to knowledge. It does not reference the wisdom hierarchy up to the wisdom stage. The big data analytics use in artificial intelligence allows for the wisdom level of the wisdom hierarchy to be referenced in the created BDDDM model. The wisdom level is able to be achieved due to big data analytics enabling action oriented automatic decisions and the ability to measure efficiency using tracking analytics.
The DDDM model illustrated the steps involved in the processing of data as it is being converted to knowledge. This set of steps were collect, organize, analyses, summarize, synthesize and prioritize. The reason why these steps were changed in the newly created BDDDM model was due to the steps involved in the processing of big data differing. The steps involved in the analysis of big data are recording, acquisition, cleaning, extraction, integration, aggregation and interpretation. The phases of Simon's decision-making model are intelligence, design, choice and implementation. The steps for the analysis of big data, the phases of Simon's decision-making model and the different levels of the wisdom hierarchy all come together in the theoretical BDDDM model.
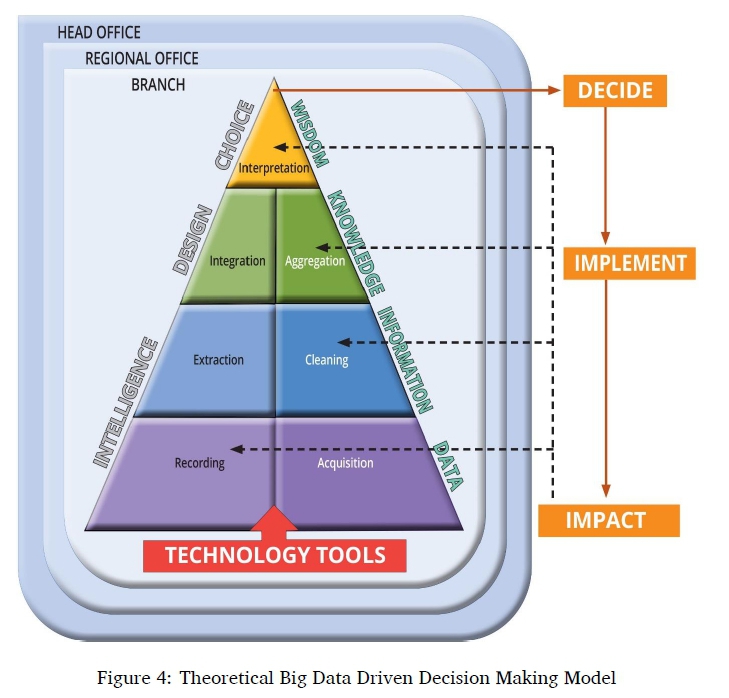
• Due to big data analytics enabling artificial intelligence, the decision can be made automatically within the system. Alternatively, the decision can be recommended and approved outside the system. This is the reason why choice from Simon's decision-making model can be both in and out of the system.
• The intelligence phase of Simon's decision-making model corresponds with data and information on the data pyramid and acquisition, recording, cleaning and extraction phases of big data analysis.
• The different alternatives generated for each decision makes up the design phase of Simon's decision-making model and this corresponds to knowledge on the wisdom hierarchy. The corresponding big data analysis steps for design phase are aggregation and integration.
• At the wisdom level, the corresponding big data analytics step is interpretation and this can also be corresponded to the choice phase of Simon's decision-making model.
Once a decision is taken and implemented, the results are fed back into the system to the relevant phase or step. The implementation and impact part of the BDDDM model is the same as that of DDDM except for the additional feedback loop to the Wisdom band of the data pyramid.
The next step of creating a theoretical BDDDM model looked at the decision-making levels. The created theoretical BDDDM model shows the different possible levels of decision-making in banking being branch level, regional level and head office. The interviewees revealed that decisions are taken at all three of these levels with decisions effected by big data only being made at regional and head office level. The final step for the creation of the theoretical BDDDM model involves technology tools. Technology tools are demonstrated as an arrow entering into the BDDDM model as the tools facilitate the data entering into the banking system. Technology tools assists big data decision-making as it brings in the raw data into the system. Some technology tools have pre-processing functionality built in which already starts the big data analysis process. Big data mining is not possible without the use of technology tools. Data and technology are linked together with the data being entrenched into the technology and is therefore regarded jointly. The type of data differs according to the type of technology and there also exists different user groups of the organization who will use different technology tools.
The theoretical BDDDM model is depicted in Figure 4 which illustrates the different steps involved in the analysis of big data, how each step correlates to the wisdom hierarchy and thereafter maps these two parts to Simon's Decision-Making Model. The theoretical BDDDM model was evaluated by the research participants against three objectives: the model clearly demonstrates how decision-making will look if big data analytics were incorporated; the model clearly illustrates how Simon's decision-making model (i.e. intelligence, design, choice and implementation) maps to the different steps of big data analytics; and the models clearly demonstrates the different levels of decision-making that big data analytics should support in the banking environment. Respondents conclusively agreed that all the outlined objectives were successfully achieved. The theoretical BDDDM model outlined what big data driven decision-making will look like by illustrating the big data analysis steps in relation to the elements of data, information, knowledge and wisdom-this is the output from cycle 1.
6.2 Cycle 2 Research Findings
Cycle 2 of the study determined the organizational supports that need to be in place to support the big data analytics decision-making process. This is a two-part process of identifying the organizational supports and identifying the corresponding steps for the organizational supports.
The organizational supports necessary for big data analytics decision-making in banking were determined from the interview response and mapping the response to the literature. The first discussion point of the semi-structured interview required the respondents to outline the organizational supports that are necessary for the effective use of customer data to improve customer service (sample use case used for the purpose of the interview) in banking. The results were data-driven strategies, big data analytics organization structure, organizational understanding of big data processes, market leading tools, focus on technology and talent needed to support big data analytics culture. The six different organizational supports were categorized into Capgemini's Big Data Maturity organizational support categories of data, infrastructure, capabilities and operating model, and culture. The reason for the categorization was to determine if the respondents identified categories that fit into the organizational support categories identified by Capgemini Big Data Maturity Model (Capgemini, 2014). The Capgemini Big Data Maturity model is a model developed for the banking sector that helps determine an organization's level of big data maturity. This model also categorizes organizational supports for the banking sector. The feedback received from the respondents can be grouped into the established categories as in Table 2. All responses were able to be logically grouped into one of the existing categories so this confirms that the organizational supports found in big data literature can be used for the BDDDM Organizational Supports model.
The identified organizational supports were further streamlined by combining Data and Infrastructure. The reason for the merge is that you cannot separate the data from the technology with regard to big data analytics. The data and technology are inextricably linked as the choice of technology determines the format and structure of the data. The final list of organizational supports is Data and Technology, Capabilities and Operating Model, and Culture.
Part 2 of the organizational supports model is identifying the corresponding steps for the organizational supports. In order to identify the corresponding steps that talk to the organizational supports, the steps in the analysis of big data were mapped to the relevant organizational support. The three chronological and inter-reliant steps are outlined in Figure 5. It is also important to note that the Data and Technology organizational supports have been combined at the process level. The reason for this is the interconnectedness of the two supports for the purposes of gathering and storing the data. Figure 5 outlines the process with the identified organizational support, its component parts and its' relation to the steps in the analysis of big data.
The mapping process was done using the literature. The interviewees were also asked during the semi-structured interviews about how these processes work on the ground. The relevant responses are listed below according to process and are discussed in relation to the literature.
Organizational Support 1. From the interviews, it was established that the banking institutions make use of third-party organizations to collect some of their data. Banking institutions do not have total control over the data collection methods. The institutions do gather some of their own data. It was also determined that customer data containers are decentralized with customer records for transactions, risk profiling and credit history, and are managed by various units within the organization. South African Banks analyses mostly structured voluminous data. The interview with key stakeholders revealed that banks do not have entrenched mechanisms in place to deal with unstructured data. Important to note at this juncture that dealing with unstructured data is a key component of working with big data.
Organizational Support 2. The interviewees from all the case studied institutions shared the same sentiment that the necessary big data analytics skills with respect to available big data analytics technology within their organizations are a challenge. The interviewees went as far as citing that the industry does not have sufficient or adequate big data analytics capacity. The interviewees also stated the close working partnerships that have been developed with external entities that assist banking institutions with their data analytics capacity. This process is responsible for conducting the analysis in order to create the explicit knowledge that is vital to managerial decision-making within the organization. This process requires the identified decision maker's knowledge requirements, use of data and the relationship with the identified data variables.
Organizational Support 3. This process requires the explicit knowledge output from Organization Support process 2, to be used by the decision makers to inform or justify their strategic and operational decisions. This is the last process of the BDDDM Organizational Supports model for banking.
The identified organizational supports together with the associated steps are demonstrated in Figure 6, BDDDM Organizational Supports model for banking-this is the output for cycle 2.
6.3 How do the created constructs add value to the banking industry?
The theoretical model is a good tool to use for the dissemination of information regarding what is involved in the big data decision-making process. Typical banking institutions have a Design and Development unit (as was the case with all 3 cases for this study) that is a nucleus of the decision-making process. This unit will use the BDDDM model to disseminate how decision-making in a modern financial institution that is dependent on technology works. This unit will bring the decision-making stakeholders up to speed with the process of technological big data decision-making. The foundational understanding of how big data decision-making works ensures that all stakeholders have the same view of the structure of decision-making. This knowledge can promote a common understanding thereby facilitating more streamlined functioning of the operational teams. The theoretical BDDDM model can be used to demonstrate to non-technical banking staff (some managers) the internal workings of the big data decision-making process. It can be used to determine bottlenecks in the decision-making process.
The organizational supports as identified in the BDDDM organizational supports model need to be in place to ensure effective decision-making. Typically in banking institutions, the Chief Information Officer (CIO) will delegate the responsibility for each organizational support to the relevant unit. For example, the responsibility for the data and technology will lie with the Information Security unit, the Capabilities and Operating support will be in the System Development unit, and the Culture support will be with the CIO. The derived organizational supports have to be constantly checked for validity. Sometimes the structure of the organizational supports may remain the same as in the name, but the composition of the structure may change due to technological advances or organizational culture change. So each relevant unit will be awarded a check list to update every quarter to ensure the right actions are being performed on or with the organizational support. The BDDDM organizational supports model will assist the responsible banking unit to periodically assess the composition of the organizational support to establish if any amendments are necessary.
7 CONCLUSION AND LIMITATIONS
The theoretical and organizational supports model together illustrate the Big Data Driven Decision Making Model. Both models are linked by the big data processing steps. The theoretical model demonstrates how the big data decision making process works and the organizational supports model demonstrates what supports need to be in place within the organization to enable an efficient big data driven decision making process.
The following limitation must be taken into consideration when evaluating the creation of the theoretical and organizational supports Big Data Driven Decision Making Models:
• This study did not include the specific types of technology used in the banking sector for the processing of the big data. These technologies have a lot of processing ability which could have some impact on what the decision-making model would look like based on the steps involved in big data processing.
References
Capgemini. (2014). Big data alchemy: How can banks maximize the value of their customer data. [Last accessed 10 Dec 2021]. https://www.capgemini.com/resources/big-data-customer-analytics-in-banks/
Chandler, N., Hostman, B., Rayner, N., & Herschel, G. (2011). Gartner's business analytics framework. https://www.gartner.com/imagesrv/summits/docs/na/business-intelligence/gartners_business_analytics_219420.pdf
Goldenburg, B. (2017). The components of effective, data-driven decision-making [Last accessed 10 Dec 2021]. https://ismguide.com/data-driven-decision-making/
Ishwarappa, J., & Anuradha, J. (2015). A brief introduction on big data 5Vs characteristics and Hadoop technology. Procedia Computer Science, 48, 319-324. https://doi.org/10.1016/j.procs.2015.04.188 [ Links ]
Mandinach, E., Honey, M., & Light, D. (2006). A theoretical framework for data-driven decisionmaking. American Educational Research Association.
Naveira, C. F., Jacob, I., Rifai, K., Simon, P., & Windhagen, E. (2018). Smarter analytics for banks [Last accessed 10 Dec 2021]. https://www.mckinsey.com/industries/financial-services/our-insights/smarter-analytics-for-banks
Rowley, J. (2007). The wisdom hierarchy: Representations of the DIKW hierarchy. Journal of Information and Communication Science, 33(2), 163-180. [ Links ]
Simon, H. (1979). Rational decision making in business organizations. The American Economic Review, 69(4), 493-513. [ Links ]
Smith, A. (2017). Top 5 biggest banks in South Africa [Last accessed 10 Dec 2021]. https://buzzsouthafrica.com/top- 5-biggest- banks-in-south-africa/
Vaishnavi, V., & Kuechler, W. (2011). Extending prior research with design science research: Two patterns for DSRIS project generation. Lecture Notes in Computer Science, 6629,166-175. [ Links ]
Wang, Y., Kung, L., & Byrd, T. (2018). Big data analytics: Understanding its capabilities and potential benefits for healthcare organisations. Technological Forecasting and Social Change, 126(3-13). [ Links ]
Xu, Z., Frankwick, G., & Ramirez, E. (2016). Effects of big data analytics and traditional marketing analytics on new product success: A knowledge fusion perspective. Journal of Business Research, 69, 1562-1566. [ Links ]
Received: 6 December 2020
Accepted: 27 September 2021
Available online: 19 December 2021
Email: Komla Pillay komla.pillay@up.ac.za (corresponding), Alta van der Merwe alta.vdm@up.ac.za

