


Services on Demand
Article
 English (pdf)
 Article in xml format
 Article references
Indicators

Related links
-
 Cited by Google
 -
 Similars in Google
Share

 Permalink
South African Computer Journal
On-line version ISSN 2313-7835
Print version ISSN 1015-7999
SACJ vol.31 n.2 Grahamstown Dec. 2019
http://dx.doi.org/10.18489/sacj.v31i2.690
RESEARCH ARTICLE
Mobile enterprise application adoption: A South African insurance study
Henri Knoesen; Lisa F. Seymour
Department of Information Systems, University of Cape Town, Cape Town, South Africa. henri.knoesen@alumni.uct.ac.za, lisa.seymour@uct.ac.za (corresponding)
ABSTRACT
The factors impacting mobile enterprise application (MEA) adoption are important as they contribute to usage and subsequently improved business performance. By means of a literature review, conceptual design of a model, survey and qualitative analysis, this mixed method study examined factors influencing user adoption of MEAs in the insurance industry. The conceptualised model combined elements of the extended technology acceptance model with constructs from Vuolle and Käpylä's mobile work model. The data collected supported the overall validity of the model and all, but one of the hypotheses were supported. Interesting findings include the importance of willingness to fund devices on the adoption by users and the importance of job relevance and the location dependency of the MEAs on their usefulness. These findings are relevant to organizations deploying MEAs and researchers studying adoption.
CATEGORIES: · Information systems ~ Mobile information processing systems
Keywords: mobile enterprise applications, mobile apps, technology adoption, TAM
1 INTRODUCTION
The advancement of mobile technologies and the resultant rise in the use of mobile applications (apps) over the past decade has resulted in the ubiquitous use of these technologies (Hasan, Gómez, & Kurzhöfer, 2013; Hoos, Gröger, Kramer, & Mitschang, 2015). Other evidence of this shift in mobile technology adoption is that mobile traffic was set to grow to 52% of all website traffic in 2018, up from 50.3% in 2017 (Statisa, 2018). Since the introduction of the iPhone in 2007, there has been a rapid growth in mobile apps (Giessmann, Stanoevska-Slabeva, & Visser, 2012). By 2017 there had been approximately 197 billion apps downloaded (Statista, 2018). While these apps have been consumer driven, it has resulted in interest in mobile apps for enterprises too (Samson, 2013). What this growth in mobile use shows is the fact that millions of people now understand, perceive, and interact with the world in a completely new manner (Gartner, 2017). Mobility is one of the most important current market and technology trends affecting information and communication technology.
Mobile apps used in business are called mobile enterprise apps (MEAs), and they are one of the top ten strategic technology trends since 2014 (Hoos et al., 2015). Market research in 2016 showed that 35% of employees used apps for work-related activity (Gartner, 2017). Also, a survey in 2017 found that CIOs recognise that enterprise mobility is a core component of digital transformation (Ismail, 2017). While public facing apps are commonplace, MEAs are less so due to their newness in an organization setting. MEAs have been defined as, "applications that are designed for and are operated on mobile devices and which facilitate users within the core and/or support processes of their enterprises" (Giessmann et al., 2012). MEAs have a simple touchscreen-based interface and can be used anytime and anywhere (Clevenger, 2011). MEAs differ from earlier mobile apps running on mobile devices such as laptops, PDAs and mobile phones by the technical capabilities of the smart mobile touch-based devices. Yet, unless MEAs are adopted and used by the relevant users, benefits will not accrue to organisations. The question therefore asked in this study is; What are the factors that influence the user adoption of MEAs?
The paper proceeds as follows. Section 2 provides a brief discussion of the literature pertaining to mobility and the adoption of technology. Section 3 describes the conceptualisation of the model used and Section 4 explains the method of investigation. Section 5 presents the results of the data analysis and Section 6 concludes the study.
2 LITERATURE REVIEW
The literature investigating the adoption of technology is plentiful. The reason for this interest is that organizations struggle with the adoption of technologies by users and hence the realization of expected benefits from technologies and systems. It is important to address MEA adoption because adoption has an impact on business performance through business process productivity improvements (Hoos, Gröger, Kramer, & Mitschang, 2014; Rangone & Renga, 2006).
One of the drivers of prioritizing MEA development by senior management is the demand for MEAs based on improvements of handheld devices. These devices can run multiple apps, crunch vast amounts of data offline and access huge datasets using wireless connectivity. Three other drivers are accelerating the demand for MEAs are executive demand, an increasingly mobile workforce, and customer's demand for real-time information and services (Harvard Business Review, 2012). Enterprise mobility is characterized by organizations integrating mobile technologies into their existing IT infrastructure giving employees the ability to work while on the move (Basel, Gómez, & Kurzhöfer, 2013). The business opportunities created by smart mobile devices are enabled by MEAs (Ovcjak, Hericko, & Polanäc, 2015).
While there is a growing number of researchers investigating mobile apps (Chung, Lee, & Kim, 2014; Gebauer, Shaw, & Gribbins, 2010), most studies (Hoehle, Zhang, & Venkatesh, 2015; Sivakumar & Reddy, 2015), have focused on consumer-facing mobile apps and there is still little research focusing on MEAs (Picoto, Bélanger, & Palma-dos-Reis, 2014; Xiao, Meredith, & Gao, 2017). Various studies have been conducted to understand the goals (H.-W. Kim, Chan, & Gupta, 2007; T. M. Lee & Park, 2008) and the perceived value of utilising mobile apps (Kaasinen et al., 2009). These studies are not transferable to a business context as business expectations dictate the value analysis of corporate services and not individual goals as is the case in consumer services (Paavilainen, 2002). Falk and Leist (Falk & Leist, 2014), in their review of mobile business process case studies, note that many studies focus on the business to customer interaction. While, some cases are employee-centred, they limit their focus to changes in workplaces or roles, and some focus on pre-requisites for implementation. Few studies have focused on mandatory mobile apps which are significantly different to consumer-facing apps. There has been one case study, in financial services in Germany, but it focuses on optimizing business process criteria (Gruhn & Köhler, 2007). Studies (Basole, 2007; Picoto, Palma-dos-Reis, & Bélanger, 2010) have identified the business value of mobile services, yet research specifically on user adoption of MEAs is lacking.
The dominant theory to study user adoption is the technology acceptance model (TAM) which was derived from social psychology theories and was used initially to explain the adoption of IT productivity tools by individuals (Grover & Lyytinen, 2015). TAM has been modified over time to variants such as extended TAM (TAM2) (Venkatesh & Davis, 2000), the Unified Theory of Acceptance and Use of Technology (UTAUT) (Venkatesh, Morris, Davis, & Davis, 2003) and the extended UTAUT2 (Venkatesh, Thong, & Xu, 2012). There is also a substantial body of knowledge on adoption of enterprise applications which is dominated by the TAM and TAM2 constructs perceived usefulness and perceived ease of use and the TAM2 construct subjective norm (Amoako-Gyampah & Salam, 2004; Valdebenito & Quelopana, 2018). Yet studies using TAM variants have been criticised as they do not add novel features of the actual IT and tell us very little about how and why IT is adopted (Grover & Lyytinen, 2015). In addition, the original list of factors influencing technology usage intention in TAM only accounts for 50% of the variance in intention to use (Legris, Ingham, & Collerette, 2003). Therefore, combining attitude-based constructs, such as in TAM2 and UTAUT, allows for a richer understanding of factors impacting adoption. In enterprise application adoption studies, new factors impacting the central constructs include training and communication (Amoako-Gyampah & Salam, 2004; Valdebenito & Quelopana, 2018). Yet these studies also lack any characteristics of the actual technology.
Another criticism of TAM-based models is that they suffer from common methods variance where users self-rate their perceptions of how useful and easy it is to use a system (Straub & Burton-Jones, 2007). They are then asked to rate their level of usage. This creates a potential bias in the results which impacts the correlations between the constructs (Straub & Burton-Jones, 2007). This claim has caused some debate in the IS literature between those that claim that the TAM relationships are known to the point of certainty (Benbasat & Barki, 2007) and those claiming that there is a flaw in the methods of verifying the relationships in empirical TAM studies (Malhotra, Kim, & Patil, 2006). In addition, TAM is criticized for being too abstract and not having practical application (Benbasat & Barki, 2007).
Furthermore, TAM based models have been criticised for not adequately unpacking the dependant variable and what system use or behavioural intention entails (Straub & Burton-Jones, 2007). Suggestions to improve the use of these models include, treating the reference theory as malleable and to include additional IT constructs (Grover & Lyytinen, 2015) and resolving the dependant variable. This has been our attempt in this paper.
3 CONCEPTUAL DESIGN OF THEORETICAL FRAMEWORK
This study focused on the insurance industry which influenced the conceptual design. Insurance companies are faced with a never-ending drive to have more information to enable better underwriting at lower costs. Technology innovation is the means by which this goal is achieved. It is not only the consumer-facing mobile apps which are being demanded, but MEAs which allow for better quality data collection, better data availability for mobile staff, and MEAs for risk assessment and claim handling. MEAs have a multitude of roles to play in improving efficiency and effectiveness of business processes which enable the insurance companies of the future. It is therefore important to understand the use of these MEAs by employees as it determines their success.
Deciding which model or constructs from multiple models to use is a difficult decision to make (Venkatesh et al., 2003). The objective should be to have a model which is parsimonious and enables a detailed understanding of the phenomenon under investigation (Taylor & Todd, 1995). Hence, we chose to combine TAM2 with constructs from a TAM based mobile work model created by Vuolle and Käpylä (Vuolle & Käpylä, 2010). Their mobile model combines four adoption and evaluation models, namely, TAM, task technology fit, the Information System Success Model and Socio-Technical Theory for impact studies. Their model includes mobile function and mobile task characteristics. We included all except two constructs from the mobile work model, namely service quality and perceived cost savings. Service quality was omitted to reduce complexity in the model and its effect on adoption has already been described in other studies (Roostika, 2011). Cost savings was omitted as the study was interested in investigating the effect of the company's willingness to fund from a cost perspective rather than cost savings. Hence, we address the TAM critique that technology characteristics and contextual factors are missing from adoption models and needed in future research (Marangunic & Granic, 2015).
A second change we made to the model was to change the dependent variable intention to use to symbolic adoption to better address mandatory use as the MEA use in this study was predominantly mandatory. All TAM2 constructs were added to the model except voluntariness and because of the predominantly mandatory use and because of the change in the dependent variable. Figure 1 represents the proposed research model used in this research. These constructs will now be explained in more detail.
3.1 Symbolic adoption
The system use construct in TAM is criticised for not being investigated enough to understand its implications for user adoption (Straub & Burton-Jones, 2007). Enterprise application TAM studies have found very low variation fit with the dependent variable intention to use (Amoako-Gyampah & Salam, 2004). Hence, system use has been replaced in this study by symbolic adoption. Symbolic adoption is defined as "a peak motivational state reflective of a user's mental evaluation of the technology and its use as a worthwhile concept" (Karahanna & Agarwal, 2006). Symbolic adoption has been shown to be a key antecedent of IS use that is innovative in nature (Wang & Hsieh, 2006). Symbolic adoption is also more appropriate in this context as users are often mandated to use MEAs and symbolic adoption has been used to explain adoption in mandatory contexts as opposed to voluntary contexts (Wang & Hsieh, 2006). In a mandatory context, intention to use is not relevant as users are required to use the technology.
3.2 Perceived usefulness and ease of use
Perceived usefulness is defined as, "the user's subjective view of the probability of increasing one's work performance when employing a specified information system as it exists inside an organization" (S. Lee, 2016). Perceived usefulness refers to the adopter's subjective probability that applying the new technology will be beneficial to the individual who will realize a perceived utility from it (Rouibah, 2009). Users need to perceive that the system will be useful or else they will not attempt to use it no matter how easy or difficult it is to use (Gardner & Amoroso, 2004). According to TAM and TAM2, attitudes towards usage are influenced by external variables outside of the system which influence perceived usefulness or perceived ease of use (S. Lee, 2016). The factor most important in information system success measurement is not system use but net benefits that are derived from use (Seddon, 1997).
Perceived usefulness is a better proxy for measuring net benefits than actual system usage (Seddon, 1997). This proposition holds true even in the case of mandatory use (T. M. Lee & Park, 2008). The hypothesis tested was:
H18: Perceived usefulness positively influences symbolic adoption.
Perceived ease of use is a direct determinant of perceived usefulness (Venkatesh & Davis, 2000). It is the degree to which the adopter expects the new technology to be free of effort regarding its transfer and utilization (Rouibah, 2009). This implies that the easier a system is to use, the more one can increase job performance by using it. This correlation between ease of use and intention to use (symbolic adoption) has been well established with empirical evidence over several decades. The hypotheses proposed therefore were:
H11: Perceived ease of use of the MEA has a positive influence on perceived usefulness.
H19: Perceived ease of use positively influences symbolic adoption.
3.3 Subjective norm and image
Subjective norm explains the social influences which determine technology use. Subjective norm is defined as "a person's perception that most people who are important to him think he should or shouldn't perform the behaviour in question" (Fishbein & Ajzen, 1977). Subjective norm was excluded from TAM because it was believed that it had an insignificant impact (Davis, 1989). However, other studies found that in the case of mandatory systems, the impact was significant on intention to use (symbolic adoption in this model) (Barki & Hartwick, 2001; S. Lee, 2016). Subjective norm only influences intention for mandatory use, not voluntary use. This causal mechanism is called compliance (Venkatesh & Davis, 2000). The compliance effect of subjective norm comes into play whenever a person perceives that a social actor wants him to perform a specific behaviour, and the actor can punish or reward the behaviour or non-behaviour (Venkatesh & Davis, 2000). TAM2 theorizes that in a computer system context, the compliance effect of subjective norm on intention to use (symbolic adoption), is greater than the effect of perceived ease of use and perceived usefulness, and will occur in mandatory, but not voluntary, system usage scenarios (Venkatesh & Davis, 2000). This led to the following hypotheses:
H1: Subjective norm has a positive influence on symbolic adoption.
H17: Subjective norm has a positive influence on perceived usefulness.
Image is included in the model as individuals respond to social normative influence to maintain a favourable image within a reference group (Kelman, 1958). TAM2 theorizes that subjective norm will positively influence image because if the reference group believes that an individual should use a system, then by using the system the individual's image will be elevated (Pfeffer, 1981). The literature suggests that by increasing one's image amongst a reference group, this creates power and influence resulting from elevated status and therefore increases productivity. Individuals, therefore, perceive that using a system leads to improvements in their job performance (perceived usefulness) which is an indirect result of image enhancement, over and above any performance benefits directly attributable to system use (Venkatesh & Davis, 2000). This relationship between subjective norm and image and the resultant effect on perceived usefulness is captured in TAM2. This study did not include the relationship between subjective norm and image as it is well established. The test for image influencing perceived usefulness was considered more important and led to the hypothesis:
H2: Image has a positive influence on perceived usefulness.
3.4 Job relevance, output quality and result
b relevance, output quality and result demonstrability are all instrumental determinants of perceived usefulness. People form perceived usefulness judgments by comparing what a system can do against what they need to get their job done (Venkatesh & Davis, 2000). Job relevance is an individual's perception of the degree to which the system applies to their job. Output quality is a further consideration which individuals use when deciding on perceived usefulness. Over and above the job relevance of a system to the job requirements, the output quality from that system is a deciding factor when deciding on system usage (Davis, Bagozzi, & Warshaw, 1992).
Result demonstrability is defined as "the tangibility of the results of using the innovation" (Moore & Benbasat, 1991). If users cannot attribute gains in their job performance to use of a system, adoption will be low and perceived usefulness will be affected negatively. The importance of this construct in TAM2 is that if a system produces effective job results by a user but those results are produced obscurely, users are unlikely to understand how useful the system is (Venkatesh & Davis, 2000). The correlation between usage intention and result demonstrability was found to be strong (Agarwal & Prasad, 1997). This then led to the following hypotheses:
H3: Output quality has a positive influence on perceived usefulness.
H4: Job relevance of a MEA has a positive influence on perceived usefulness.
H5: Result demonstrability has a positive influence on perceived usefulness.
3.5 Mobility, time criticality and location-dependency
Mobility, location-dependency and time-criticality refer to the actual mobile tasks performed. There are various dimensions to mobility over and above the obvious dimension of spatial mobility (Kakihara & S0rensen, 2001). Mobility also has to do with interaction among people. It needs to be thought of in terms of spatial, temporal, and contextual aspects of mobility in human interaction (Kakihara & S0rensen, 2001). The concept of mobility is complex and does little to explain task fit or any other variable (Gebauer, 2008). Mobility is not necessarily associated with geographical location and long-distance movement but is more generalized with the ability to 'roam free' and still be connected (Gebauer, 2008). Mobility is associated with independence and flexibility that users gain with respect to a physical location and the ability to change location frequently (Gebauer, 2008). Hence the following hypothesis was proposed:
H6: Mobility of the MEA has a positive influence on perceived usefulness.
Location-dependency describes the ability to locate a mobile user and provide location specific information and services. The services may include information about the geographic location (e.g., for navigational purposes) or location about others (e.g., for finder services that let users locate, clients, businesses, or landmarks) (Junglas & Watson, 2003). Location dependence has been found to be a strong influencing factor for mobile users when evaluating a new technology (Gebauer, 2008). The hypothesis therefore proposed was:
H7: Location dependency in a MEA has a positive influence on perceived usefulness.
Time-criticality has been used to capture the temporal nature of mobile tasks (Yuan, Archer, Connelly, & Zheng, 2010). It refers to the importance of time in task performance and has two dimensions, time flexibility and urgency (Yuan et al., 2010). Flexibility defines to what extent the mobile task must be performed on time, while urgency defines the importance with which a task must be performed promptly. This led to the hypothesis:
H8: Time criticality of a MEA positively influences perceived usefulness.
3.6 Maturity and portability
Maturity and portability refer to the mobile technology itself. Maturity of a technology has a significant impact on use ofthat technology (Kelman, 1958). Only once users perceive a technology to be mature will they be willing to try it, much less use it, irrespective of whether it is a good fit to the task for which they need to use the technology. This leads to the following hypothesis:
H10: Maturity of a MEA positively influences perceived usefulness.
In turn, portability has also been found to have a significant effect on perception of a MEA (Kelman, 1958). User expectations about the portability of a device influence their evaluation of a MEA. Portability is important in terms of battery life, weight, and size of the device. This leads to the following hypotheses:
H9: Portability of a MEA positively influences perceived usefulness.
3.7 Perceived loss of control and willingness to fund
Perceived loss of control and willingness to fund are organizational factors. To have satisfactory interactions with others, it is essential to have a feeling of control (Schutz, 1966). Control is a human driving force, and it is defined as the need to demonstrate one's competence, superiority, and mastery over the environment (White, 1959). To understand TAM in a mandatory environment, the concept of perceived loss of control was examined (T. M. Lee & Park, 2008) as it predicts aspects of motivational, cognitive, and emotional functioning (Skinner, Chapman, & Baltes, 1988). Various studies (Spector, 1986; Tetrick & LaRocco, 1987) have shown that perceived control positively affects job satisfaction, organizational commitment, motivation, and performance. Perceived loss of control plays a critical role in determining the success of information systems and organizational performance in the context of mandatory technology acceptance (T. M. Lee & Park, 2008). The hypothesis proposed was:
H16: Perceived loss of control influences symbolic adoption.
Costs of a technology are always a primary factor in its adoption (S. H. Kim, 2008). Without funding, individuals, employees, or organizations can't adopt and use technologies (S. H. Kim, 2008). Funding changes peoples' attitudes and behaviour towards technology and a lack of funding retards IT adoption (S. H. Kim, 2008). A company's willingness to fund has a significant impact on the user's intention to use a mobile wireless technology (S. H. Kim, 2008). From an individual perspective, the cost savings come from cost-effective communication and information exchange (S. H. Kim, 2008). The hypothesis tested for this construct was:
H15: The Company's willingness to fund has a positive influence on symbolic adoption.
3.8 Experience
TAM2 theorizes that subjective norm has a significant initial effect on intention which then becomes insignificant three months after system implementation (Gebauer, 2008). The reason given is that before a system is implemented, the individual must rely on the opinions of the reference group or influencer as the basis for their intention. After system usage, the individual draws from their own experience and the normative influence decreases. Hence an increase in system experience has been shown to have a moderating effect on subjective norm's influence on intention (symbolic adoption). Mandating the use of a system can increase initial system use which is useful for initial inertia to adoption (Agarwal & Prasad, 1997). However, such pressure erodes over time. Prior experience also has a significant moderating effect between a company's willingness to fund (S. H. Kim, 2008). The hypotheses that were tested for the moderating effect were as follows:
H12: There is a moderating effect by experience on subjective norm and symbolic adoption.
H13: There is a moderating effect by experience on subjective norm and perceived usefulness.
H14: There is a moderating effect by experience on a company's willingness to fund and symbolic adoption.
4 METHOD
The philosophical stance taken in this research to answer the questions was that of pragmatism. The mixed method strategy included a review of the literature, conceptualisation of a model and subsequent survey and interviews within a single organization which had implemented 3 MEAs. Pragmatism focuses on the problem to be researched and the consequences of the research (Feilzer, 2010; Tashakkori & Teddlie, 1998). Survey can validate relationships that are common across users and can provide generalizable statements about influencing factors motivating their adoption (Gable, 1994). By means of the survey, quantitative data was collected and analysed to confirm factors influencing user's adoption of MEAs. To add insight and context, qualitative interview data from a wider action research study was analysed and compared to the survey findings.
4.1 The case organisation
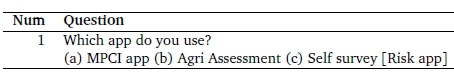
InsureUs is a short-term insurance company in the Western Cape, South Africa. The organization has made a strategic decision to make digital a strategic focus for growth and sustainability and as such portals and mobile apps have received special attention. MEAs are ideally suited to this industry because most of the service providers such as brokers and assessors spend most of their time out of the office visiting clients and sites so mobility plays an important role in their daily job functions. The three MEAs selected for the study were the first ones which had been developed for use in the organization. They were the Multi-Peril Crop Insurance (MPCI) and Agri assessment (Agri) MEAs, which were created for the agricultural business and are used by assessors whose job it is to go out to farms and do assessments of the risk insured as well as assess claims, and a Risk assessment MEA for the Brokers.
The MPCI MEA was used to assess the growth stages of the crop being insured so that a value may be derived for the insurance cover. The Agri MEA was used for the claims process for crop insurance. Surveying risks is a problem due to the high number of assessments needing to be done in the organization. The Risk MEA was intended to be used by the brokers to do their own risk assessments for new policies and renewals.
The assessors are mandated to use the tools provided by InsureUs if they want to be selected as service providers while the brokers are not obliged to use them. In other words, the assessor apps are mandatory while the use of the Risk MEA is voluntary but incentives are provided to Brokers if they use it. The intention is to mandate its use in the future. User adoption of the MEAs, provided as tools for the assessors and brokers, will drive efficiencies for the organization in cost cutting and many other anticipated benefits and also benefits accruing to the users too therefore it is important that there is symbolic adoption.
4.2 Survey data collection and analysis
The survey, included in Appendix A, was emailed to all 342 assessors and brokers who had registered on the apps; 88 responses were received and 82 could be used (23 from brokers and 59 from assessors). Table 1 shows the number of respondents per MEA along with their experience levels. Experience refers to the amount of experience which the user has with using mobile apps (Q13).
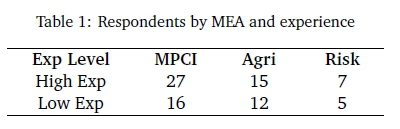
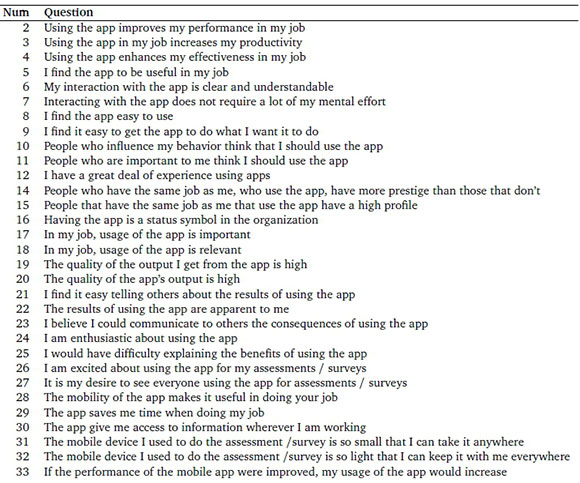
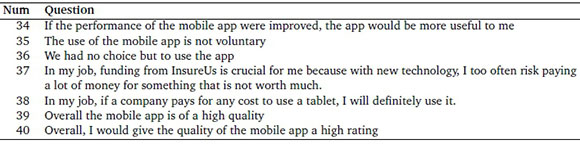
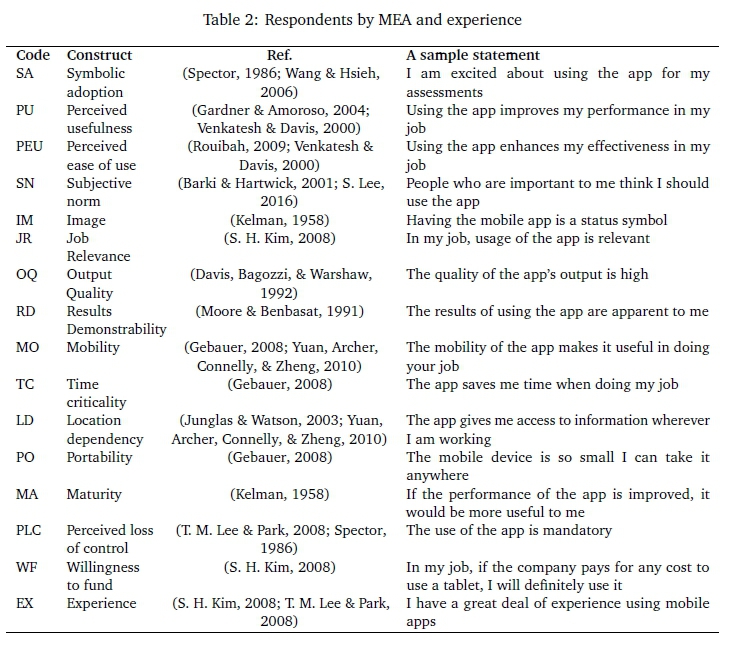
Table 2 acts as a key to the 16 construct codes used in this paper, including a sample question from the survey and literature sources for the relevant constructs. The survey instrument was designed from previous adoption studies (Chen & Nath, 2004; Gardner & Amoroso, 2004; Gebauer, Shaw, & Subramanyam, 2007; S. H. Kim, 2008; T. M. Lee & Park, 2008; Seymour, Makanya, & Berrangé, 2007; Venkatesh & Davis, 2000), and had multiple questions for all variables except for mobility, time criticality and location dependence which were single item constructs.
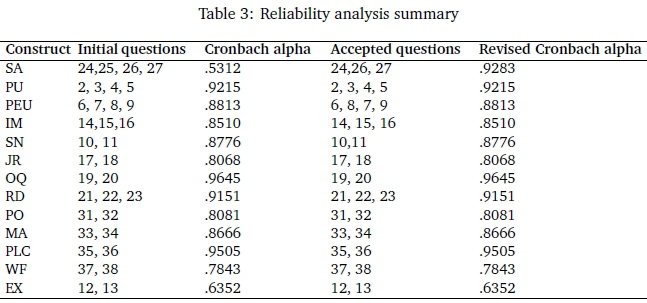
The first step in the data analysis was to test whether the questions in the survey were suitable and reliable to be grouped and averaged, with the purpose of forming one variable that could be used to test the model. Cronbach Alpha was used to test the reliability of the constructs in the model. Cronbach Alpha measures the internal consistency of responses to determine how well the constructs are measuring what it is expected to measure and is indicated by a score between 0 and 1. Great internal consistency is indicated by a coefficient that is close to 1 (Tavakol & Dennick, 2011). Reliability is concerned with the ability of an instrument to measure consistently. Internal consistency describes the extent to which all the items in a test measure the same construct and thereby the inter-relatedness of the items within the test (Tavakol & Dennick, 2011).
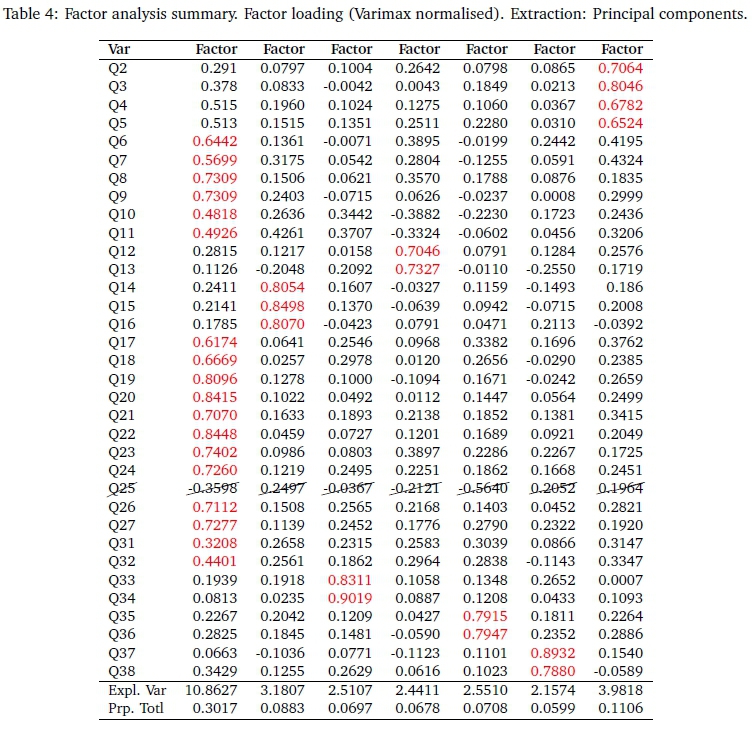
Table 3 summarises the Cronbach Alphas for all the initial questions and shows the final set of accepted questions for each construct. Table 4 shows the factor loadings for the multiple item construct questions. All multiple-item constructs met the required Cronbach Alpha measure of greater than 0.6 which is the acceptable measure for construct reliability in an exploratory study (Bhattacherjee, 2012). The Cronbach Alpha for Symbolic adoption went from 0.53 to 0.93 when removing question 25. Alpha values of greater than 0.7 were obtained for each of the groups related to the constructs which implies that the questions were reliable and there was a high degree of internal consistency for the test items in the constructs and that the questions group well together (Gliem & Gliem, 2003).
Factor analysis was performed to test for convergent and discriminant validity (Bhattacherjee, 2012). Validity is concerned with the extent to which an instrument measures what it is intended to measure. Convergent validity is indicated when there is a loading of 0.6 or more by a single construct for the same factor while discriminant validity is indicated by items having a loading of 0.3 or less for other factors (Bhattacherjee, 2012). A factor loading of 0.6 or higher for construct test items in an exploratory study is considered acceptable for convergent validity (Bhattacherjee, 2012). A factor analysis standard (Keller & Warrack, 2004), varimax normalisation, was used. For construct validity, factor loadings above 0.7, with a maximum of 1.0, are considered acceptable. All constructs except PO and SN loaded above the 0.6 value therefore the data was acceptable to continue with the analysis. For the constructs that loaded, the only question which had values less than 0.6 was question 25 and it was therefore deemed unacceptable to include in further analysis and removed. Many of the constructs loaded in one column while other columns had single factors. Question 7 had a score below 0.7 but was retained because removing it lowered the Cronbach alpha for PEU to 0.8548.
After grouping and averaging the selected questions, bi-variant Spearman correlation tests (non-parametric) were performed on the data sets to test the main hypotheses. Following which multiple then stepwise regression was performed to identify the equation best describing the significant variables of the adoption model. Experience has been shown to explain differences in individuals when adopting technology (Hartwick & Barki, 1994). To test the moderating effect of Experience on the relationships between Subjective norm and Perceived usefulness, Subjective norm and Symbolic adoption, and Company's willingness to fund and Symbolic adoption, the PROCESS modelling tool for SPSS (Hayes, 2012) was used.
4.3 Qualitative data collection and analysis
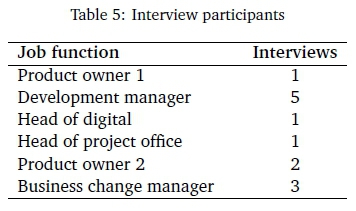
Interview data collection was part of a broader study and started in February 2017 and concluded in September 2018. The data was collected primarily through 13 semi-structured interviews with 6 purposefully identified stakeholders from the MEA projects who could give deep insights into the workings of the projects (Table 5). These participants were the main stakeholders in the MEA projects. The interviews loosely followed the interview protocol questions listed in Appendix 1. Secondary data in the form of minutes from six Risk MEA steering committees was also collected. The interviews were transcribed from digital voice recordings and then checked for accuracy against the recordings. The transcripts and documents were then loaded into a computer-assisted qualitative data analysis (CAQDAS) software package called HyperResearch (79). The interviews were given codes to protect the anonymity of the respondents. Any data which was identifiable to a respondent was made anonymous. The text was coded looking for themes related to the adoption factors. The coding also allows for the development of a detailed understanding of the phenomena which the data was seen to be presenting (Marnewick, 2016).
5 FINDINGS AND DISCUSSION
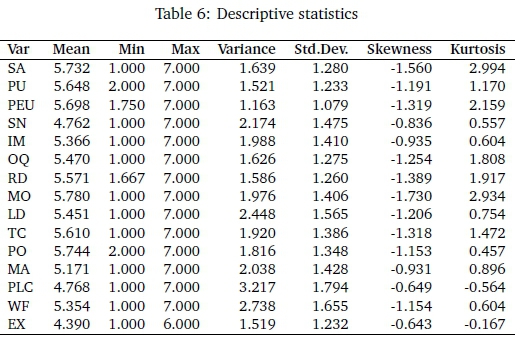
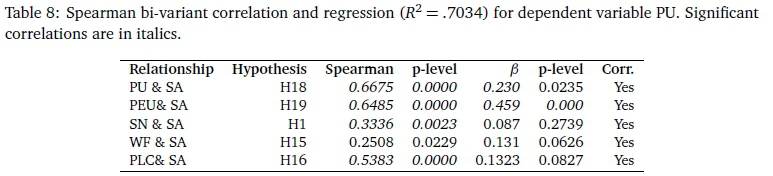
The descriptive statistics in Table 6 describe the survey data. The Likert scale of the questions was spread from 1 to 7 where in most cases 1 (strongly disagree) was a negative response, 7 (strongly agree) was the most favourable response and 4 was neutral. The sample skewness, as well as kurtosis, indicates a left-skew (negative skew) with a positive kurtosis suggesting narrow range round the peak of distribution for most of the constructs. It is worth reporting the 95% confidence interval (CI) for this data, as this speaks to effect size and their precision and allows for direct comparisons to other but similar datasets. Since the sample distributions skew to the left for most constructs, CI must be calculated after bootstrapping (number of bootstrap replicates = 200). Confidence interval ranges have a very narrow range round the mean. We are therefore confident that we captured the true population mean in this dataset. Ultimately, we conclude a predominantly favourable response to the survey questions. Spearman correlation tests were first carried out to test the correlation between the variables. The results are shown in Table 7 and 8. The analysis of all responses found that all variables were correlated at a 95% level of significance other than willingness to fund and symbolic adoption, and maturity and perceived usefulness.
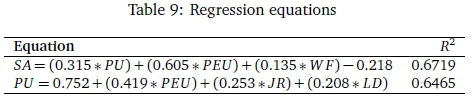
Multiple and then forward stepwise regression was then performed to investigate the simultaneous effect of the independent variables on symbolic adoption and perceived usefulness. The regression equations in Table 9 were generated from stepwise regression because of the high correlation between variables. The coefficient of determination (R2) is an indication of the percentage of variation in the dependent variable which can be explained by variation in the independent variables (Keller & Warrack, 2004). The independent variables for symbolic adoption accounted for 67% of the total variation and for perceived usefulness they accounted for 65%. The various variables and relationships confirmed are now discussed.
5.1 Symbolic adoption
Symbolic adoption had a medium of 6 (moderately agree) which meant on the whole the users were enthusiastic and excited to use the MEAs. Symbolic adoption achieved the second highest mean value in the descriptive statistics and was most skewed (left-skewed) regarding distribution. Yet, a lack of user adoption of the MEA can erode benefits from using the MEAs. There was evidence that some users had not adopted the MEAs and that there was resistance to change old work practices:
Some feel they are good in the method they follow and don't see how the app can help (MM)
Some brokers don't do a risk assessment and do not want to do it at all. (PO2)
5.2 Perceived usefulness and ease of use
Perceived usefulness and ease of use each had a mean around 6 (moderately agree) which meant on the whole the users believed the MEAs were useful and easy to use. Perceived ease of use achieved the third highest mean value in the descriptive statistics. Both variables were correlated with each other and with symbolic adoption.
A few themes related to usefulness and ease of use of the MEAs was found in the qualitative analysis. The assessor or broker has the client data readily available to them so they can provide a better service and offer advice immediately rather than having to go back to their office and then contact the client after their meeting. With standardised assessments, it also improves transparency into the assessment process which makes it easier for the client to understand how their premiums are calculated. Basole (Basole, 2009) identified improved customer service from the use of mobility.
We are clear the reason we are doing this project is that we want to have a better understanding of client's risk collectively, we want to get them to proactively advise clients how to reduce their risk which is good for everyone. (DM1)
Poor functional design can impact usefulness and ease of use, for example if the MEA does not facilitate the user's job function as they expect it to. Having insufficient functionality in the MEA can result in extra effort to get a job done and hence reduced perceived usefulness and lower user adoption. This was raised as a concern:
There's a gap between the end user and us. When we are doing mobile, there shouldn't be a gap. Early in your process, you should be saying before I design a new assessment let me go on a trip and see first-hand and you make notes. We do it late ... (DM1)
5.3 Subjective norm and image
The relationship between subjective norm and image and its resultant effect on perceived usefulness is captured in TAM2. Image is the most representative of normally distributed data when compared to others, indicating that participants didn't have strong feelings about it. The MEAs gave InsureUs a market leading image with their insurance tools.
Nobody else does surveys like this in South Africa. It has a reputation benefit. (HD)
Brokers feel it is a fantastic tool; they feel it is a differentiator in the market. (PO3)
In terms of subjective norm, InsureUs was aware that the influence of individuals, such as MEA champions would increase adoption and their marketing division could assist with creating awareness and hype around the MEA.
Identify 14 super-user relationship managers to be present at the sessions to give a demo of the App (1 in each region) (MM)
The need for champions has been identified to promote information systems and hence improve adoption (Nelson, 2007). Venkatesh and Davis (Venkatesh & Davis, 2000) found that subjective norm exerted a significant direct effect on usage intentions over and above perceived usefulness and perceived ease of use for a mandatory system. This finding was not validated in this study. Subjective norm had a lesser influence than perceived usefulness and perceived ease of use. The difference in findings can be because of the smaller sample size and fewer cases in this study compared to the Venkatesh and Davis study as well as a different population sample based on geography and sophistication of users. This would need to be investigated further to find the possible reasons for this difference. They also found that as individuals gained direct experience with a system over time, they relied less on social information informing perceived usefulness and intention but continued to judge a system's usefulness by potential status benefits resulting from use (Venkatesh & Davis, 2000). This finding is validated in this study when looking at the high correlation results of both image and perceived usefulness and subjective norm and perceived usefulness. It would, therefore, be advisable to have MEA champions advocating the use of the MEA.
5.4 Job relevance, output quality and result demonstrability
These findings in this study confirm that judgements of a system's usefulness are affected by the user's cognitive matching of their job goals within the consequences of using the system (job relevance). The influence of result demonstrability on perceived usefulness was also stated by Venkatesh and Davis (Venkatesh & Davis, 2000) and subsequently confirmed in this study. Kim (S. H. Kim, 2008) showed that in the workplace users are more willing to adopt a technology that is useful (job relevance) which is again validated in this study. Although it was clear that job relevance and result demonstrability of the MEAs was not being made explicit to the users.
But if we have benefits and we track that and use that to justify to them why we doing it and what the benefits are to them, that would be great. (PO1)
5.5 Mobility, time criticality and location-dependency
This convenience from mobile apps is confirmed by Stieglitz and Brockmann (Stieglitz & Brockmann, 2012). In this study, mobile tasks were found to be convenient. For users that are mobile and out visiting clients for most of their work day, having a diary on the device linked to worklists creates an efficient and easy way to manage their time. In terms of location dependency, mobile devices have apps which assist with driving directions which makes getting to clients simpler. Features such as geo-location which is standard in mobile devices make it convenient to geo-tag premises or a location for assessment. Rich data can then be sourced for that specific location. Previously this sort of accuracy was more difficult. The MEAs in the assessment and claims process allowed for a richer report to be created more easily with photos and notes included. Mobility enables working remotely and away from the office on client premises.
That is a huge benefit being able to work offline and not have to be connected is a huge benefit. (DM1)
In terms of time criticality, there was also a negative consequence of saving time. The use of the MEA saved time which meant that the users claimed less hours and then got paid less:
Assessors aren't jumping up and down because of the apps. Firstly, it reduces their time spent doing assessments, so they get less money. (PO1)
5.6 Maturity and portability
The only correlation which was not validated (H10) was that of maturity and perceived usefulness. Perceptions of the maturity of a technology have been found to strongly influence perceived usefulness (Gebauer, 2008). If users perceive that the technology is not mature then they will not be willing to try the technology, let alone use it. In contrast to the literature, there was no correlation between maturity and perceived usefulness in this study.
Portability achieved the highest sample mean in the descriptive statistics so the users were positive about the portability of the MEA. In terms of the actual devices, portability enabled the users to perform other tasks while on the move. This has been noted as an advantage (Pavin & Klein, 2015) and was confirmed here.
Now yes you can get it on your laptop but with this app, he can sit, and while he is waiting for his meeting, he can send some of his emails. (PO1)
5.7 Perceived loss of control and willingness to fund
Perceived loss of control relates to mandatory use. The highest standard deviation and thus highest sample variance was found for perceived loss of control indicating this construct to be the least reliable for this dataset. This was because the assessors are mandated to use the tools provided by InsureUs if they want to be selected as service providers while the brokers are not obliged to use them.
You see in the Agri space those guys get paid to do assessments. 'You now need this type of hammer to do this type of work. If you don't have this hammer you can't do this work. (DM1)
In the case of the Agri MEA, assessors were reimbursed for their purchase of a device but in the case of the Risk MEA, no such arrangement was made, and Brokers were expected to purchase their own devices. This has a significant impact on the adoption of the MEA as demonstrated by the regression equations even though the correlation was not strong. The importance was confirmed in interviews.
The first thing is because we not buying the equipment. If we gave everyone a tablet they would be much more enthusiastic. But the thing is our assessors are part-time people who sometimes work for us when there is hail or when there is not hail so we can't supply everyone with a tablet because some of them won't only use it for us. So what we said was you buy the device and we will compensate you as you work. So that's the one big issue is that they have to buy the device. (PO1)
5.8 Experience
Experience had the second lowest mean (neutral) indicating that many users were not experienced with MEAs. This was noted:
The other issue is that most of the assessors are older people and 50 plus which are not technologically savvy, so they don't want to work with tablets. (PO1)
Moderation tests described by Hayes (Hayes, 2012) were used to determine the significance of the moderation effect of experience in H12, H13, H15. The change in the R2 and the significance of the change are found in Table 10. The tests showed that the moderation influence of experience on subjective norm and symbolic adoption was significant at 3.7% which is below the accepted level of 5%. The literature shows that mandating system use is only effective initially before the user has personal experience (Agarwal & Prasad, 1997). Initially, the user draws on the normative group for their intention to adopt however as personal experience grows, the group influence falls away, and personal experience has a stronger influence. In this study, the influence of experience level had a moderating effect on the relationship between symbolic adoption and subjective norm.
The influence of experience on willingness to fund and symbolic adoption was not significant at 12.9%. Similarly, the effect of experience on subjective norm and perceived usefulness was not significant at 35.2%. The moderation of willingness to fund and symbolic adoption (H15) was not validated in this study. This finding was contrary to that of Kim (S. H. Kim, 2008) who found that experience had a moderating effect on the relationship between company's willingness to fund and intention to use. This implies that the level of experience users have with MEAs does not play a significant role in determining their adoption of MEAs when considering the issues of the company funding the smart device. Experience also plays an insignificant role on the influence of social pressure and perceived usefulness of a MEA.
5.9 Final model and limitations
Tables 7, 8 and 10 lists the findings from the correlation tests and the results of the hypotheses which validated the relationships between the constructs. The only construct which was found not to be relevant was maturity and was therefore removed from the original model. The moderating effect of experience on subjective norm and perceived usefulness and company's willingness to fund and symbolic adoption was also not validated and therefore removed. All other relationships in the conceptual model were validated by data. The model in Figure 2 represents the final model which explains the adoption of the MEAs in this study along with their correlation coefficients.
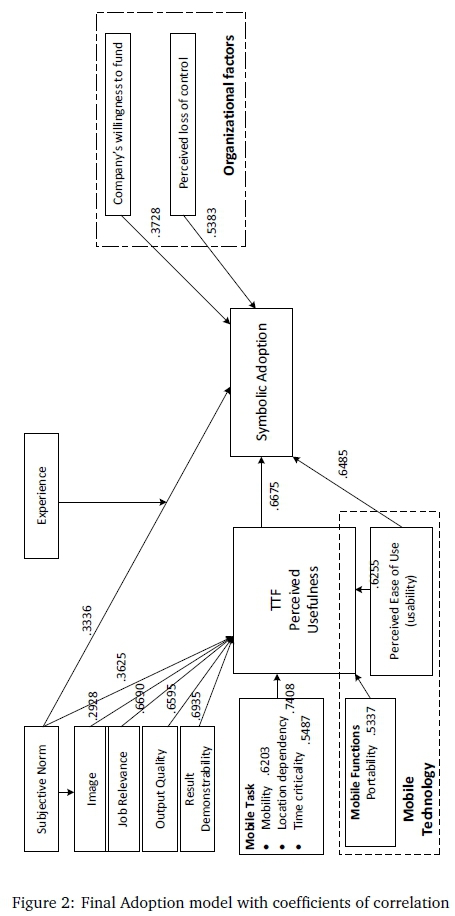
The findings from this study provide practical advice to organizations implementing MEAs. The provision of mobile devices to users (WF) impacts whether the users adopt the MEA or not. This organization decided to provide financing in the form of reimbursing the assessors for purchasing their own devices. Using the geo-sensing features (LD) of the smart device, to add functionality to the MEA, adds to the improved user adoption (SA) because of convenience and improved usefulness (PU). Adequate communication and user training impacts various factors. It improves the understanding for the user of how the MEA complements the job being done by the user thereby influencing job relevance (JR), it improves the user's experience level with MEAs which benefits adoption and it helps users understand how the MEA can benefit them which improves their perception of usefulness (PU) of the MEA and positively influences symbolic adoption.
A limitation was that data for the study was captured and is representative at a point-in-time not longitudinally and this could influence the results of experience as a moderating effect. The effect of social influence on adoption has been shown to decrease over time (Venkatesh & Davis, 2000). As users become more familiar with the technology they rely less on social influence. This study did not examine how the users' responses differed over a time period and as users became more experienced with using the MEAs.
The moderation effect of experience, as well as the relationship between maturity and perceived usefulness, was found to be different from the results found in the literature. This could be due to the small sample size of users of the MEAs in this study, and these tests would need to be carried out in a different organisation or a different industry to validate whether the results vary across industries and companies.
The method used to test the relationships between constructs in the model was correlation testing. This technique is criticized as being less accurate than structural equation modelling (SEM) for showing the relationships between variables in the entire model (Gefen, Straub, & Boudreau, 2000). SEM is commonly justified in the social sciences because of its ability to impute relationships between unobserved constructs from observable variables. The result from using SEM is a more rigorous analysis of the model (Gefen et al., 2000). The causal networks enabled by SEM characterize processes better than correlation-based models and it is claimed that SEM is better suited for theory and practice (Gefen et al., 2000). A future study could analyse this model using SEM to evaluate whether a similar results are achieved.
6 CONCLUSION
This study investigated the factors which influence the adoption of MEAs. It is important to understand these factors as MEAs become more prevalent in the organizational IT landscape and the benefits from using these MEAs are dependent on their successful adoption by users. The practical contribution of this study informs practitioners of the factors that can make a positive contribution to the adoption of MEAs and therefore should be addressed in their design and implementation. The theoretical contribution of the study was the proposal and subsequent validation of the model which details the factors and relationships between factors leading to symbolic adoption of MEAs by users. The independent variables perceived ease of use and willingness to fund account for 67% of the variation of the dependent variable symbolic adoption. Furthermore, the independent variables perceived ease of use, job relevance and location dependence account for 64% of the variation of the dependent variable perceived usefulness.
Perceived ease of use influences symbolic adoption, and it can be addressed with good design of the user interface of the MEA. This shows that there should be extra effort put into the design stage of the MEA to maximise this user experience as it heavily influences adoption and ultimately the realisation of the benefits once the MEA is adopted.
Secondly, the company's willingness to fund is worth proper consideration as it positively influences symbolic adoption. In the case of InsureUs, there is no standard policy to provide devices to users of the MEA. In the case of the Agri MEA, assessors were reimbursed for their purchase of a device but in the case of the Risk MEA, no such arrangement was made, and brokers were expected to purchase their own devices. This has a significant impact on the adoption of the MEA as demonstrated by the regression equations.
Finally, perceived usefulness strongly influences adoption and is influenced by perceived ease of use, job relevance, and location dependence. This can be influenced by ensuring that the users understand the benefits of using the MEA to themselves as well as to the organisation. The users need significant change management to understand how the MEA relates to their job function and how it can benefit them. The design of the MEA also plays an important role in that making sure the correct functionality is included in the MEA; to make it useful to the user is a determining factor for adoption. For the users of the MEA, the cognitive influencing factors of job relevance, location dependency, and result demonstrability play a significant role in the perceived usefulness of the MEA and ultimately the decision to adopt. Location dependence is also a design consideration which must be prioritised during the design stage. Ensuring that the MEA provides accurate and readily accessible data based on the location of the user ensures greater adoption of the MEA and greater adoption leads to benefits being realised. These results highlight that there are areas of design and user training that can be prioritised to improved adoption of the MEA when they are produced.
Further research can test whether this model has the same results in other industries and whether the results change over time as the users gain more experience with MEAs. In addition a deeper understanding of the characteristics of MEAs, such as mobility, portability, location dependance and time crtiticality is needed as well as the importance of these to user adoption.
References
Agarwal, R., & Prasad, J. (1997). The role of innovation characteristics and perceived voluntariness in the acceptance of information technologies. Decision sciences, 28(3), 557-582. https://doi.org/10.1111/j.1540-5915.1997.tb01322.x [ Links ]
Amoako-Gyampah, K., & Salam, A. F. (2004). An extension of the technology acceptance model in an ERP implementation environment. Information & management, 41(6), 731-745. https://doi.org/10.1016/j.im.2003.08.010 [ Links ]
Barki, H., & Hartwick, J. (2001). Interpersonal conflict and its management in information systems development. MIS quarterly, 195-228.
Basel, H., Gómez, J. M., & Kurzhöfer, J. (2013). Towards a framework for designing secure mobile enterprise applications. In MOBILITY2013: The Third International Conference on Mobile Services, Resources, and Users (pp. 90-93).
Basole, R. (2007). Strategic planning for enterprise mobility: A readiness-centric approach. In AMCIS 2007Proceedings (p. 491).
Basole, R. (2009). Visualization of interfirm relations in a converging mobile ecosystem. Journal of information technology, 24(2), 144-159. https://doi.org/10.1057/jit.2008.34 [ Links ]
Benbasat, I., & Barki, H. (2007). Quo vadis TAM? Journal of the Association for Information Systems, 8(4), 7. https://doi.org/10.17705/1jais.00126 [ Links ]
Bhattacherjee, A. (2012). Social science research: Principles, methods, and practices. Open University Press.
Chen, L.-d., & Nath, R. (2004). A framework for mobile business applications. International journal of mobile communications, 2(4), 368-381. https://doi.org/10.1504/IJMC.2004.005857 [ Links ]
Chung, S., Lee, K. Y., & Kim, K. (2014). Job performance through mobile enterprise systems: The role of organizational agility, location independence, and task characteristics. Information & management, 51 (6), 605-617. https://doi.org/10.1016/j.im.2014.05.007 [ Links ]
Clevenger, N. (2011). iPad in the enterprise: Developing and deploying business applications. John Wiley & Sons.
Davis, F. D. (1989). Perceived usefulness, perceived ease of use, and user acceptance of information technology. MIS quarterly, 13(3), 319-340. https://doi.org/10.2307/249008 [ Links ]
Davis, F. D., Bagozzi, R. P., & Warshaw, P. R. (1992). Extrinsic and intrinsic motivation to use computers in the workplace. Journal of applied social psychology, 22(14), 1111-1132. https://doi.org/10.1111/j.1559-1816.1992.tb00945.x [ Links ]
Falk, T., & Leist, S. (2014). Effects of mobile solutions for improving business processes. In Proceedings ofthe European Conference on Information Systems (ECIS), Tel Aviv, Israel.
Feilzer, M. Y. (2010). Doing mixed methods research pragmatically: Implications for the rediscovery of pragmatism as a research paradigm. Journal of mixed methods research, 4(1), 6-16. https://doi.org/10.1177/1558689809349691 [ Links ]
Fishbein, M., & Ajzen, I. (1977). Belief, attitude, intention and behavior: An introduction to theory and research.
Gable, G. G. (1994). Integrating case study and survey research methods: An example in information systems. European journal of information systems, 3(2), 112-126. https://doi.org/10.1057/ejis.1994.12 [ Links ]
Gardner, C., & Amoroso, D. L. (2004). Development of an instrument to measure the acceptance of internet technology by consumers. In Proceedings of the 37th Annual Hawaii International Conference on System Sciences, 2004 (10 pp.). https://doi.org/10.1109/HICSS.2004.1265623
Gartner. (2017). Gartner survey reveals the number of enterprise mobile apps is not accelerating. Retrieved from https://www.gartner.com/newsroom/id/3735917
Gebauer, J. (2008). User requirements of mobile technology: A summary of research results. Information knowledge systems management, 7(1, 2), 101-119. [ Links ]
Gebauer, J., Shaw, M. J., & Gribbins, M. L. (2010). Task-technology fit for mobile information systems. Journal of information technology, 25(3), 259-272. https://doi.org/10.1057/jit.2010.10 [ Links ]
Gebauer, J., Shaw, M. J., & Subramanyam, R. (2007). Once built well, they might come: An empirical study of mobile e-mail. https://doi.org/10.2139/ssrn.1282110
Gefen, D., Straub, D., & Boudreau, M.-C. (2000). Structural equation modeling and regression: Guidelines for research practice. Communications of the Association for Information Systems, 4(1), 7. https://doi.org/10.17705/1CAIS.00407 [ Links ]
Giessmann, A., Stanoevska-Slabeva, K., & Visser, B. D. (2012). Mobile enterprise applications- Current state and future directions. In 2012 45th Hawaii International Conference on System Science (HICSS) (pp. 1363-1372). IEEE.
Gliem, J. A., & Gliem, R. R. (2003). Calculating, interpreting, and reporting Cronbach's alpha reliability coefficient for Likert-type scales. In Midwest Research to Practice Conference in Adult, Continuing and Community Education.
Grover, V, & Lyytinen, K. (2015). New state of play in Information Systems Research: The Push to the Edges. MIS quarterly, 39(2), 271-296. https://doi.org/10.25300/MISQ/2015/39.2.01 [ Links ]
Gruhn, V, & Köhler, A. (2007). Analysing and enhancing business processes and IT-systems for mobile workforce automation: A framework approach. In Proceedings of the 2007 Euro American conference on Telematics and Information Systems. https://doi.org/10.1145/1352694.1352721
Hartwick, J., & Barki, H. (1994). Explaining the role of user participation in information system use. Management science, 40(4), 440-465. [ Links ]
Harvard Business Review. (2012). How mobility is changing the enterprise. Retrieved from https://illumiti.com/wp-content/uploads/2013/12/harvard-business-review-how-mobility-is-changing-the-enterprise-document301.pdf
Hasan, B., Gómez, J. M., & Kurzhöfer, J. (2013). Towards a framework for designing secure mobile enterprise applications. In MOBILITY2013: The Third International Conference on Mobile Services, Resources, and Users (pp. 90-93).
Hayes, A. F. (2012). PROCESS: A versatile computational tool for observed variable mediation, moderation, and conditional process modeling. https://doi.org/10.1287/mnsc.40.4.440
Hoehle, H., Zhang, X., & Venkatesh, V (2015). An espoused cultural perspective to understand continued intention to use mobile applications: A four-country study of mobile social media application usability. European journal of information systems, 24(3), 337-359. https://doi.org/10.1057/ejis.2014.43 [ Links ]
Hoos, E., Gröger, C., Kramer, S., & Mitschang, B. (2014). Improving business processes through mobile apps-An analysis framework to identify value-added app usage scenarios. In ICEIS (2) (pp. 71-82).
Hoos, E., Gröger, C., Kramer, S., & Mitschang, B. (2015). ValueApping: An analysis method to identify value-adding mobile enterprise apps in business processes. (pp. 222-243). Enterprise Information Systems. Springer.
Ismail, N. (2017). Mobile in the enterprise and the changing role of the CIO. Retrieved from http://www.information-age.com/mobile-enterprise-2-123468577/
Junglas, I., & Watson, R. (2003). U-commerce: A conceptual extension of e-commerce and m-commerce. ICIS 2003 Proceedings, 55.
Kaasinen, E., Roto, V, Roloff, K., Väänänen-Vainio-Mattila, K., Vainio, T., Maehr, W., ... Shrestha, S. (2009). User experience of mobile internet: Analysis and recommendations. International journal of mobile human computer interaction, 1(4). https://doi.org/10.4018/ijmhci.2009100102 [ Links ]
Kakihara, M., & S0rensen, C. (2001). Expanding the 'mobility5 concept. ACM SIGGroup bulletin, 22(3), 33-37. [ Links ]
Karahanna, E., & Agarwal, R. (2006). When the spirit is willing: Symbolic adoption and technology exploration. Unpublished manuscript, University of Georgia, Athens, GA. [ Links ]
Keller, G., & Warrack, B. (2004). Statistics for management and economics. Thomson/Brooks/Cole.
Kelman, H. C. (1958). Compliance, identification, and internalization three processes of attitude change. Journal of conflict resolution, 2(1), 51-60. https://doi.org/10.1177/002200275800200106 [ Links ]
Kim, H.-W., Chan, H. C., & Gupta, S. (2007). Value-based adoption of mobile internet: An empirical investigation. Decision support systems, 43(1), 111-126. https://doi.org/10.1016/j.dss.2005.05.009 [ Links ]
Kim, S. H. (2008). Moderating effects of job relevance and experience on mobile wireless technology acceptance: Adoption of a smartphone by individuals. Information & management, 45(6), 387-393. https://doi.org/10.1016/j.im.2008.05.002 [ Links ]
Lee, S. (2016). User behavior of mobile enterprise applications. KSII transactions on internet & information systems, 10(8). [ Links ]
Lee, T. M., & Park, C. (2008). Mobile technology usage and B2B market performance under mandatory adoption. Industrial marketing management, 37(7), 833-840. https://doi.org/10.4018/ijmhci.2009100102 [ Links ]
Legris, P., Ingham, J., & Collerette, P. (2003). Why do people use information technology? A critical review of the technology acceptance model. Information & management, 40(3), 191-204. https://doi.org/10.1016/S0378-7206(01)00143-4 [ Links ]
Malhotra, N. K., Kim, S. S., & Patil, A. (2006). Common method variance in IS research: A comparison of alternative approaches and a reanalysis of past research. Management science, 52(12), 18651883. https://doi.org/10.1287/mnsc.1060.0597 [ Links ]
Marangunic, N., & Granic, A. (2015). Technology acceptance model: A literature review from 1986 to 2013. Universal access in the information society, 14(1), 81-95. https://doi.org/10.1007/s10209-014-0348-1 [ Links ]
Marnewick, C. (2016). Benefits of information system projects: The tale of two countries. International journal of project management, 34(4), 748-760. https://doi.org/10.1016/j.ijproman.2015.03.016 [ Links ]
Moore, G. C., & Benbasat, I. (1991). Development of an instrument to measure the perceptions of adopting an information technology innovation. Information systems research, 2(3), 192-222. https://doi.org/10.1287/isre.2.3.192 [ Links ]
Nelson, R. R. (2007). IT project management: Infamous failures, classic mistakes, and best practices. MIS quarterly executive, 6(2). [ Links ]
Ovcjak, B., Hericko, M., & Polancic, G. (2015). Factors impacting the acceptance of mobile data services-A systematic literature review. Computers in human behavior, 53, 24-47. https://doi.org/10.1016/j.chb.2015.06.013 [ Links ]
Paavilainen, J. (2002). Mobile business strategies: Understanding the technologies and opportunities. Pearson Education.
Pavin, R. D. P, & Klein, A. Z. (2015). Organizational consequences of the adoption of mobile ERP systems: Case studies in Brazil. Journal of information systems and technology management, 12(2), 219-232. [ Links ]
Pfeffer, J. (1981). Power in organizations. Pitman Marshfield.
Picoto, W. N., Bélanger, F., & Palma-dos-Reis, A. (2014). An organizational perspective on m-business: usage factors and value determination. European journal of information systems, 23(5), 571-592. https://doi.org/10.1057/ejis.2014.15 [ Links ]
Picoto, W. N., Palma-dos-Reis, A., & Bélanger, F. (2010). How does mobile business create value for firms? In Mobile Business and 2010 Ninth Global Mobility Roundtable (ICMB-GMR), 2010 Ninth International Conference on (pp. 9-16). https://doi.org/10.1109/ICMB-GMR.2010.19
Rangone, A., & Renga, F. M. (2006). B2E mobile internet: An exploratory study of Italian applications. Business process management journal, 12(3),330-343. https://doi.org/10.1108/14637150610667999 [ Links ]
Roostika, R. (2011). The effect of perceived service quality and trust on loyalty: Customers' perspectives on mobile internet adoption. International journal ofinnovation, management and technology, 2(4), 286. [ Links ]
Rouibah, K. (2009). Intention to use camera mobile phone before e-shopping in the Arab world: Test of the applicability of TAM 2. In IADIS International Conference Information Systems (pp. 3-9).
Samson, T. (2013). Mobile developers See big rise in demand for enterprise apps. Last accessed 08 Dec 2019. Retrieved from https://www.infoworld.com/article/2611552/mobile-developers-see-big-rise-in-demand-for-enterprise-apps.html
Schutz, W. C. (1966). The interpersonal underworld. Science & Behavior Books.
Seddon, P B. (1997). A respecification and extension of the DeLone and McLean model of IS success. Information Systems Research, 8(3), 240-253. https://doi.org/10.1287/isre.8.3.240 [ Links ]
Seymour, L., Makanya, W., & Berrangé, S. (2007). End-users' acceptance of enterprise resource planning systems: An investigation of antecedents. In Proceedings of the 6th annual ISOnEworld conference (pp. 1-22).
Sivakumar, M., & Reddy, U. S. (2015). A short review for mobile applications of sentiment analysis on various domains. (pp. 723-726). Progress in systems engineering. https://doi.org/10.1007/978-3-319-08422-0_103
Skinner, E. A., Chapman, M., & Baltes, P B. (1988). Control, means-ends, and agency beliefs: A new conceptualization and its measurement during childhood. Journal of personality and social psychology, 54(1), 117. https://doi.org/10.1037/0022-3514.54.L117 [ Links ]
Spector, P E. (1986). Perceived control by employees: A meta-analysis of studies concerning autonomy and participation at work. Human relations, 39(11), 1005-1016. https://doi.org/10.1177/001872678603901104 [ Links ]
Statisa. (2018). Percentage of all global web pages served to mobile phones from 2009 to 2018. Last accessed 09 Dec 2019. Retrieved from https://www.statista.com/statistics/241462/global-mobile-phone-website-traffic-share/
Statista. (2018). Number of mobile app downloads worldwide in 2016, 2017 and 2021 (in billions). Last accessed 09 Dec 2019. Retrieved from https://www.statista.com/statistics/271644/worldwide-free-and-paid-mobile-app-store-downloads/
Stieglitz, S., & Brockmann, T. (2012). Increasing organizational performance by transforming into a mobile enterprise. MIS quarterly executive, 11 (4). [ Links ]
Straub, D., & Burton-Jones, A. (2007). Veni, vidi, vici: Breaking the TAM logjam. Journal of the Association for Information Systems, 8(4), 5. https://doi.org/10.17705/1jais.00124 [ Links ]
Tashakkori, A., & Teddlie, C. (1998). Mixed methodology: Combining qualitative and quantitative approaches. Sage.
Tavakol, M., & Dennick, R. (2011). Making sense of Cronbach's alpha. International journal of medical education, 2, 53. https://doi.org/10.5116/ijme.4dfb.8dfd [ Links ]
Taylor, S., & Todd, P (1995). Decomposition and crossover effects in the theory of planned behavior: A study of consumer adoption intentions. International journal of research in marketing, 12(2), 137-155. https://doi.org/10.1016/0167-8116(94)00019-K [ Links ]
Tetrick, L. E., & LaRocco, J. M. (1987). Understanding, prediction, and control as moderators of the relationships between perceived stress, satisfaction, and psychological well-being. Journal of applied psychology, 72(4), 538. https://doi.org/10.1037/0021-9010.72.4.538 [ Links ]
Valdebenito, J., & Quelopana, A. (2018). Understanding the landscape of research in Enterprise Resource Planning (ERP) systems adoption. In Proceedings of the 2018 International Conference on Computers in Management and Business (pp. 35-39). https://doi.org/10.1145/3232174.3232178
Venkatesh, V, & Davis, F. D. (2000). A theoretical extension of the technology acceptance model: Four longitudinal field studies. Management science, 46(2), 186-204. https://doi.org/10.1287/mnsc.46.2.186.11926 [ Links ]
Venkatesh, V., Morris, M. G., Davis, G. B., & Davis, F. D. (2003). User acceptance of information technology: Toward a unified view. MIS quarterly, 425-478. https://doi.org/10.2307/30036540
Venkatesh, V, Thong, J. Y., & Xu, X. (2012). Consumer acceptance and use of information technology: Extending the unified theory of acceptance and use of technology. MIS quarterly, 36(1), 157178. https://doi.org/10.2307/41410412 [ Links ]
Vuolle, M., & Käpylä, J. (2010). Theoretical evaluation models used in mobile work context. In Mobile Business and 2010 Ninth Global MobilityRoundtable (ICMB-GMR), 2010 Ninth International Conference on (pp. 425-431). https://doi.org/10.1109/ICMB-GMR.2010.46
Wang, W., & Hsieh, J. J. (2006). Beyond routine: Symbolic adoption, extended use, and emergent use of complex information systems in the mandatory organizational context. In ICIS 2006 Proceedings. Paper 48. Retrieved from https://aisel.aisnet.org/icis2006/48
White, R. W. (1959). Motivation reconsidered: The concept of competence. Psychological review, 66(5), 297. https://doi.org/10.1037/h0040934 [ Links ]
Xiao, M., Meredith, R., & Gao, S. (2017). An exploratory study investigating how and why managers use tablets to support managerial decision-making. Australasian journal of information systems, 21. https://doi.org/10.3127/ajis.v21i0.1706 [ Links ]
Yuan, Y., Archer, N., Connelly, C. E., & Zheng, W. (2010). Identifying the ideal fit between mobile work and mobile work support. Information & management, 47(3), 125-137. https://doi.org/10.1016/j.im.2009.12.004 [ Links ]
Received: 15 Mar 2019
Accepted: 16 Oct 2019
Available online: 20 Dec 2019
A APPENDIX: SURVEY AND INTERVIEW QUESTIONS
A.1 Survey
Respondents were asked to rate their agreement with the following statements in terms of 1 (strongly disagree), 2 (moderately disagree), 3 (somewhat disagree), 4 neutral (neither disagree nor agree), 5 (somewhat agree), 6 (moderately agree), 7 (strongly agree).
Respondents were asked to rate their agreement with the following statement in terms of 1 (less than 1 month), 2 (1-6 months), 3 (7-24 months), 4 (2-4 years), 5 (more than 4 years).
A.2 Interview Protocol
Section 1
1. What is your role in this project?
2. Have you created MEA before?
3. What is your role in the organisation?
4. Do you have experience with BM?
Section 2
1. How were benefits identified for this project?
2. Was a process used to manage the benefits?
3. Whose responsibility was it to identify the benefits?
4. Whose responsibility was it to track benefits?
5. Who were all the stakeholders in the BM process?
6. How actively were benefits tracked?
7. Were risks identified to benefits realisation?
8. What was done to mitigate the risks?
9. Did the stakeholder participate as was expected?
10. Who is managing the benefits after implementation of the MEA?
Section 3
1. How successful was the project in delivering the benefits?
2. Would you say this was a successful project?
3. Are the benefits linked to the organisation's strategy?
4. Was the BM process followed in this project?
5. Are the organisation's strategic goals considered when identifying MEA benefits?

