


Services on Demand
Article
 English (pdf)
 Article in xml format
 Article references
Indicators

Related links
-
 Cited by Google
 -
 Similars in Google
Share

 Permalink
South African Computer Journal
On-line version ISSN 2313-7835
Print version ISSN 1015-7999
SACJ vol.30 n.1 Grahamstown Jul. 2018
http://dx.doi.org/10.18489/sacj.v30i1.511
RESEARCH ARTICLE
Semi-automated Usability Analysis through Eye Tracking
Katherine M. MalanI; Jan H.P. EloffII; Jhani A. de BruinIII
IDepartment of Decision Sciences, University of South Africa, Preller Street, Pretoria, South Africa. malankm@unisa.ac.za
IIDepartment of Computer Science, University of Pretoria, Lynnwood Road, Pretoria, South Africa. eloff@cs.up.ac.za
IIIDepartment of Computer Science, University of Pretoria, Lynnwood Road, Pretoria, South Africa. jhani.debruin@gmail.com
ABSTRACT
Usability of software is a crucial aspect of successful applications and could give one application a competitive edge over another. Eye tracking is a popular approach to usability evaluation, but is time consuming and requires expert analysis. This paper proposes a semi-automated process for identifying usability problems in applications with a task-based focus, such as business applications, without the need for expert analysis. The approach is demonstrated on the eye tracking data from a mobile procurement application involving 33 participants. With the recent inclusion of built-in eye tracking hardware in mobile devices, the proposed approach introduces the possibility of conducting remote, large-scale usability studies for improving user experience in mobile applications.
Keywords: automated usability testing, eye tracking
1 INTRODUCTION
Software applications have become part of our daily lives and should assist us in completing tasks more efficiently and effectively. Users have access to a wide variety of applications with the same functionality and the usability could be the deciding factor between two similar applications. Usability is defined by the ISO 9241 standard as
the extent to which a product can be used by specified users to achieve specified goals with effectiveness, efficiency and satisfaction in a specified context of use. (1998)
There are a wide variety of usability evaluation methods, one of which is eye tracking analysis (Lai-Chong Law et al., 2009; Riihiaho, 2000). The link between where people are looking and their cognitive activities enables eye tracking results to provide insight into the usability of a system. Eye tracking for usability testing involves users completing a number of tasks while their eye movements are recorded. The eye tracking data is then viewed and analysed by an expert, which can be extremely time-consuming (Bednarik, 2007; Coltekin, Heil, & Garlandini, 2009; Goldberg, Stimson, & Lewenstein, 2002). With the latest development in cost-effective eye trackers (Ferhat, Vilariño, & Sánchez, 2014; Li, Babcock, & Parkhurst, 2006) and the inclusion of eye tracking technologies in mobile devices, large-scale, remote usability studies are becoming a possibility. The large resulting datasets, however, would require automated processes to support the analysis.
This article does not claim that usability analysis based on eye tracking is superior to other approaches, such as inspection methods, think-aloud testing or field observation methods. The most effective usability analysis approach would most likely be to combine a variety of different approaches. This focus of this study is to find ways of making eye tracking more accessible and practical method of usability testing.
This study proposes a method for rapidly analysing eye tracking data to identify problems in the usability of business applications, or other applications with a task-based focus. In previous work (de Bruin, Malan, & Eloff, 2013; de Bruin, Malan, Eloff, & Zielinski, 2014) metrics and visualisations were proposed for potentially identifying usability issues in applications based on eye tracking data. It was, however, not clear how these techniques could be combined into a single process or applied in practice. In addition, the previous studies were based on a very small study with only five users and so it was unclear whether the proposed techniques were feasible in larger usability studies, where eye tracking data is recorded for all users. The purpose of this article is to propose a semi-automated process for supporting non-expert usability evaluators in identifying application tasks with usability problems and highlighting areas on the user interface that could require redesign. Using the eye tracking data of 33 participants interacting with a mobile procurement application, it is shown how the proposed semi-automated approach could work in practice.
2 RELATED RESEARCH
Our eyes move continuously and recording these eye movements is known as eye tracking (Buswell, 1935; Poole & Ball, 2005; Young & Sheena, 1975). Eye tracking goes back to the 1870s, when Javal (1878) noted jerks (saccades) in eye movement during reading. Six types of eye movements have been defined, where fixations and saccades are the most frequently used (Duchowski, 2007; Young & Sheena, 1975). Fixations occur when the eyes become almost stationary and focus on an area of a visual stimuli. Most information processing occurs during fixations, which usually last between 100 and 300 milliseconds (Goldberg & Helfman, 2010; Young & Sheena, 1975). Just and Carpenter (1976) demonstrated that there is a link between a person's fixations and cognitive activities. Fixation data can provide insight into usability such as where the user expected to find information, how difficult it was for the user to extract information and how quickly the user located required elements (Ehmke & Wilson, 2007; Hurley, Ouzts, Fischer, & Gomes, 2013). The eye movements between fixation points are known as saccades and last between 10 and 100 milliseconds (Goldberg & Kotval, 1999; Jacob & Karn, 2003). The brain selectively shuts off most of the visual processing during a saccade. Thus, the brain does not register the elements over which the eyes move, but the saccadic movement still holds valuable information (Carpenter, 1988). From the saccade position and length, information can be derived such as where the user expected information to be or how much the user was searching, hence providing insight into the decision-making of the user (Ehmke & Wilson, 2007; Holland, Komogortsev, & Tamir, 2012).
Applications of eye tracking can be divided into two main categories, namely interactive and diagnostic applications (Duchowski, 2002). Interactive (active) applications enable users to interact with a machine using their eyes (Jacob, 1990; Kumar, Paepcke, & Winograd, 2007; Skovsgaard, 2011; Zhai, Morimoto, & Ihde, 1999). An example of this is the use of eye-gaze interaction on mobile phones. Diagnostic (passive) applications record eye movements and process the data to extract information. This has been used in fields such as marketing (Rayner, Rotello, Stewart, Keir, & Duffy, 2001), human behaviour studies (Hayhoe, 2000; Land, Mennie, & Rusted, 1999) and neuroscience (Ross, Olincy, Harris, Sullivan, & Radant, 2000; Tseng et al., 2013). Studies have confirmed that eye tracking data can also be used to identify usability issues (Ellis & Candrea, 1998; Russell, 2005) and analyse the usability of a system (Ehmke & Wilson, 2007; Goldberg & Kotval, 1999; Byrne, Anderson, Douglass, & Matessa, 1999; Fabo & Durikovic, 2012). Although the use of eye tracking tools and software can simplify the process of making sense of eye tracking data, it still requires expert analysis and remains a time consuming process (one minute of eye tracking data is estimated to take up to an hour to analyse by an expert (Holland et al., 2012)). In addition, the results are often qualitative and can be biased (Goldberg et al., 2002). Automation of this process can help overcome these problems.
A number of studies have attempted semi-automated analysis of eye tracking data to support usability testing (Albanesi, Gatti, Porta, & Ravarelli, 2011; Drusch, Bastien, & Paris, 2014; Eraslan, Yesilada, & Harper, 2016; Holland et al., 2012; Komogortsev, Holland, Tamir, & Mueller, 2011; Iqbal & Bailey, 2004; Santella & DeCarlo, 2004). Some approaches focus on assisting expert analysts by automatically identifying time intervals within the recordings of individual user eye movement data that should be investigated further. Iqbal and Bailey (2004) used gaze data over areas of interest to automatically identify whether the user was reading, manipulating an object, searching or doing equations. This can reduce analysis time by allowing the expert to choose which data segments to analyse, depending on the type of activity of the user. Automated detection of excessive visual search (Holland et al., 2012; Komogortsev et al., 2011) can be used to identify segments of eye tracking data, based on the assumption that excessive visual search is an indicator of flaws in usability. The purpose of these approaches is therefore to reduce analysis time by highlighting segments of recordings, so that it is no longer necessary for the expert to analyse all the individual user recordings.
An alternative approach is to aggregate eye tracking data to support analysis. Commercial eye tracking tools are available that provide a set of visualisations such as heat maps, gaze plots, clusters and bee swarms (Tobii Technology AB, 2012). These visualisations have been adapted and some custom visualisation tools have been created to fulfil a specific need, such as the clustering of gazes for identifying areas of interest (Santella & DeCarlo, 2004; Drusch et al., 2014). Visualisations in usability testing can be viewed separately from the user interface (West, Haake, Rozanski, & Kam, 2006) or superimposed onto the user interface normally (Hilbert & Redmiles, 2000). The Gaze-based Usability Inspector Tool (Albanesi et al., 2011) adds a grid-based view of aggregated data. Results include scanpath comparisons and a ranking of areas where users spent time reading, scanning or inspecting the user interface. Eraslan et al. (2016) introduced an algorithm called scanpath trend analysis for automatically aggregating eye tracking data of multiple users. The purpose was to highlight the common scanpaths between visual elements of websites, providing visualisations that can potentially be used to re-engineer web pages.
All of the approaches described above provide semi-automated solutions with the aim of reducing the time required for expert analysis. In all cases, an expert is needed to either view parts of the eye tracking recordings or to interpret the aggregated data and visualisations to identify potential problems in usability. The novelty of the proposed approach is that the data is aggregated relative to a benchmark user so that tasks that exhibit high deviations in eye tracking data from the benchmark user visual strategy can be identified. The introduction of a benchmark user removes the need for areas of interest to be mapped out by an expert analyst and for expert analysis of the aggregated data. A data-driven approach is therefore used to automatically identify tasks that are most likely to include usability issues, introducing the possibility of performing usability analysis without the need for expect analysis.
Techniques that form part of the proposed approach were previously reported in two studies, a sub-study based only on saccade data (de Bruin et al., 2013) and another sub-study based only on fixation data (de Bruin et al., 2014). In this article, the two techniques are combined into a single process that also includes automated identification of benchmark users, automated identification of problematic user tasks and users that strongly deviate from efficient visual strategies. The proposed process is applied to the eye tracking data of 33 participants using a newly developed mobile procurement application. It is shown that the process was able to automatically identify tasks that users struggled with and identify the areas on particular user interface screens that required re-design.
3 PROPOSED APPROACH
Figure 1 provides an overview of the proposed process. Given an application to be tested for usability issues, a number of users perform predefined tasks using the application while eye tracking data is captured by the system. The data is then split into subtasks based on screen change events as specified by the usability evaluator. Given the eye tracking data split into subtasks, a benchmark user is automatically identified for every subtask based on criteria specified by the usability evaluator. The criteria for specifying a benchmark user would depend on the purpose of the usability analysis. For example, if the purpose was to improve the time to complete tasks by users, then the criteria for selecting a benchmark user would be the minimum time to complete the task successfully. Using the visual strategy of the benchmark user (as captured by the eye tracking data), subtasks are automatically identified that are the most problematic in terms of the largest deviation from the strategy used by the benchmark user. The users that deviated the most are also identified in this step. The usability evaluator is able to specify parameters to affect some aspects of the automated process. The user interface screens of the problematic subtasks are then displayed to the usability evaluator. These screens are superimposed with the benchmark user's visual strategy along with aggregated information on the visual strategies used by users who deviated the most from the benchmark user. In this way the usability evaluator is able to see where the potential problems in usability lie on the user interface and which user interface components require re-design.
Note that a condition for the effectiveness of the proposed approach is the availability of eye tracking data from both experienced and inexperienced users. This is to ensure that there are sufficient candidates for benchmark user selection. However, even if data does not contain a large range in visual strategies, the process will still highlight the tasks that present relatively the highest deviation from the benchmark user.
The detail of the proposed process is discussed in the following subsections.
3.1 Identification of benchmark users per subtask
A benchmark user is a user that is regarded as the 'most successful' in achieving a task. The criteria for selecting a benchmark user are specified by the usability evaluator and could be based on indicators of success extracted from interaction data, such as the shortest amount of time spent on a task, or the lowest error rate. In this way the benchmark user selection is data-driven. The benchmark users can be different for each subtask, depending on the criteria used, but it is also possible to have the same user as the benchmark for all subtasks.
To complete a usability task successfully, a user needs to focus on certain parts of the interface to extract the information needed to deduce how to interact with the interface. Even though users might have different visual strategies for obtaining information from the user interface, some components are essential for task completion. Since the benchmark user selection is based on efficiency criteria, the benchmark user is known to have followed an efficient visual strategy. In other words, the benchmark user focussed (fixated) on all the necessary components of the user interface to complete the given task and the sequence of eye movements (saccades) was efficient between the various components. To ensure that at least one user follows an efficient strategy, a user with knowledge of the system could participate during the data collection.
3.2 Identification of deviant subtasks and users per subtask and filtering of subtasks
After benchmark users are identified for each subtask, the next step in the process is to automatically identify the subtasks with possible usability issues. This is done by quantifying the extent to which each participant deviated from the benchmark user in terms of fixations and saccades. The following sections describe the metrics used for this purpose.
3.2.1 Fixation deviation index
The fixation deviation index (FDI) (de Bruin et al., 2014) quantifies the variance of each user's fixation data from the benchmark user fixations. The first step in calculating the FDI is clustering, where the fixations of the benchmark user are used as centroids (focus points that are assumed to be significant in terms of achieving the task on the user interface). The fixation points of each participant are clustered with respect to the closest neighbouring benchmark user centroid.
In this way, the fixations of each participant are separated into clusters. For each cluster k, the spread of the fixations is calculated to obtain FDIk, a quantifiable measure of how much the participant's fixations deviated from the nearest benchmark user fixation k, defined as:
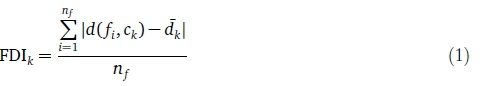
where d (fi, ck) is the Euclidean distance between fixation fiand cluster centroid ck, dkis the mean Euclidean distance of fixations in the cluster to the cluster centroid, and nfis the number of fixations in the cluster k. The FDI value for a participant completing a given subtask is defined as the average of all the cluster deviation values, FDIk, for the subtask. FDI values are real numbers > 0. If the fixations of a participant exactly match the benchmark user fixations, FDI will be zero. The more the participant fixations differ from the benchmark user fixations, the higher the FDI value.
3.2.2 Saccade deviation and length indices
The comparison between the benchmark user and participants' saccades results in three metrics: two saccade deviation indices (SDI) and a saccade length index (SLI). The SDI and SLI metrics relate to saccade count and length, which are commonly used to analyse the usability of systems (Cowen, Ball, & Delin, 2001; Drewes, 2010; Ehmke & Wilson, 2007; Holland et al., 2012).
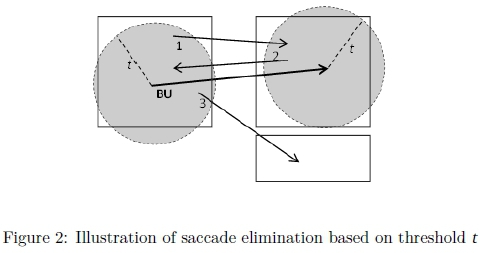
The first step of the process eliminates participant saccades that are similar to benchmark user saccades. Two saccades (perceived as vectors) are considered similar if the start and end points of the saccades are within a defined threshold (t) of each another. The ideal threshold will depend on the size of the user interface and components. Figure 2 illustrates this, where the rectangles represent components such as buttons or text boxes, the BU line indicates the benchmark user saccade and the remaining three arrows are one participant's saccades. Saccade 1 is within the threshold of the BU saccade and will be eliminated. Saccade 2 is within the threshold, but moves in the opposite direction so it is not eliminated. Saccade 3 is not within the threshold and will not be eliminated. A threshold value t of 80% of the average component size of the user interface is recommended for this process. This value can be automatically derived from the user interface of a system by programmatically querying the sizes of components.
The SDI eliminated (SDIe) metric (de Bruin et al., 2013) is defined as the percentage of a participant's saccades that align with the benchmark user saccades, within the set threshold ( t). A high SDIg indicates that the participant followed similar scanpaths to the benchmark user. The SDI remainder (SDIr) metric (de Bruin et al., 2013) is defined as the percentage of a participant's saccades that were not eliminated. A high SDIrvalue indicates that the participant followed many scanpaths that were different from the benchmark user scanpaths. In a case where the participant's scanpath was similar to the benchmark user's scanpath, the SDIe will be high and the SDIr will be low. Both saccade deviation metrics can be high if the participant deviated significantly from the benchmark user, but also followed similar paths between some of the user interface components.
The saccade length index (SLI) (de Bruin et al., 2013) quantifies by how much the eye movement of a participant deviated from that of the benchmark user and is the summation of the length of all the remaining saccades after elimination of saccades similar to the benchmark user.
3.2.3 Filtering of subtasks
Using the four metrics (FDI, SDIe, SDIr and SLI), the subtasks of the application are filtered to identify those subtasks that are the most problematic in terms of deviation from the benchmark visual strategy. The proposed filtering process is as follows:
1. The mean value of each of the four metrics over all users is calculated for each subtask.
2. For all metrics to be measures of deviation, the SDIe metric values are inverted to produce SDI-1 values. With this change, for all four measures (FDI, SDIe-1, SDIrand SLI), a lower value indicates higher similarity with the benchmark user.
3. Each mean metric value is normalised to a range between 0 and 1 (by subtracting the minimum of the mean values for that metric for all subtasks and dividing it by the range of mean values for all subtasks).
4. The total of the four normalised metrics for each subtask i is calculated, called the deviation index total for subtask s, DITs.
5. The most deviant subtasks are then defined as the subtasks s with the highest DITs values.
Given the subset of the most deviant subtasks, the total of the normalised metrics for each individual user is calculated, called the deviation index total for subtask s and user j, DITs(j). The most deviant users per subtask s are defined as the users with the highest DITs(j) values.
3.3 Visual output of benchmark and deviant visual strategies
Given the ordering of subtasks based on deviation, the purpose of the final step of the process is to present the problematic user interface screens to the usability evaluator. To illustrate where on these screens the problems could lie, the visual strategy used by the benchmark user is shown alongside the most deviant users' visual strategies. Since the benchmark user is efficient there are usually only a few fixations in the scanpath and this makes it meaningful to display all of the benchmark user saccades as a sequence of numbered fixations. However, in the case of deviant users, there would normally be too many saccades to provide a meaningful visualisation. The proposed approach for aggregating a deviant user's visual strategy for comparative visualisation is as follows:
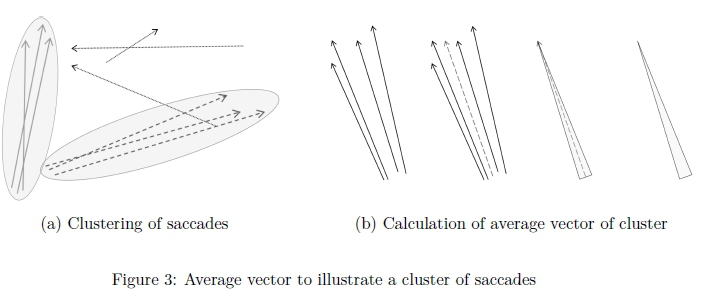
• For each user scanpath to be visualised, the saccades remaining after elimination (as described in Section 3.2.2) are clustered to derive aggregated saccades. A saccade cluster is formed when there are at least cmin(a parameter set by default to 3) saccades within a specified clustering threshold tcdistance of each other (see Figure 3(a)). These clusters therefore represent repeated (at least 3, if cminis set to 3) eye movement on the part of the deviant user in areas different from the benchmark user.
• For each saccade cluster, an average vector is calculated and is visualised as a thin triangle. Figure 3(b) illustrates how the average saccade (represented by the dashed line) is visualised as a thin triangle pointing in the direction of the average vector.
4 TESTING THE APPROACH
To illustrate how the proposed approach could work in practice, the process was applied to eye tracking data, captured while users were performing tasks on a mobile procurement application. Eye tracking equipment was used and a mobile emulator was used to run the application on the eye tracking screen. Details of the ethical clearance obtained for this research is detailed in Section 1.3.1 of the dissertation on which this work was based (de Bruin, 2014).
4.1 The application
The mobile application used in the study was developed by SAP Research for small businesses operating in emerging markets, namely Business-in-Your-Pocket (BiYP) (Cashmore, 2012). BiYP is a cloud-based smartphone application that provides small businesses with functionality such as online procurement of stock. The main menu of the BiYP application, shown in Figure 4(a), displays a list of the services provided. When 'Shop' is selected, the available wholesalers appear (Figure 4(b)) and the user can select the desired wholesaler to view the shop's catalogue (Figure 4(c)). Once a category is selected, a page of products is shown as images including the quantity ordered (Figure 4(d)). To order a product, the user selects the required product, navigates to the product details and selects a quantity (Figure 4(e)). Once the user is satisfied, the order can be confirmed and sent to the wholesaler (Figure 4(f)). The last two screens, Figures 4(g) and 4(h), provide updated information about the orders for the user from the wholesaler.
Eye tracking data was captured based on the completion of the following three tasks:
• Task 1: To order a number of specified products from a specified shop.
• Task 2: To repeat Task 1, but with different products.
• Task 3: To view the invoice for the order.
The reason for repeating the same logical task in tasks 1 and 2 was to assess how well users were able to learn how to use the application and improve in execution of task 2 relative to task 1.
4.2 Participants
A total of 33 participants from the SAP Research offices and a number of external volunteers performed the tasks while eye tracking data was captured. Full detail on the participants is documented in Section 3.6.3 of the dissertation on which this work was based (de Bruin, 2014). The majority of participants tended to use their mobile phones hourly or bi-hourly with some exceptions using their mobile phones less frequently, and most had previously used on-line shopping. The range of experience with the BiYP application varied from participants involved in the development of the application, to those with limited experience (either interacting with the system during demonstrations or watching others interacting with the system), and some (10 participants) who had never seen the application before. Although it is not standard procedure to involve developers in usability testing, the purpose of the data collection is different from a usual usability test. Including both expert and inexperienced users ensured that the sample included instances of efficient use of the application (for benchmark user selection) as well as inefficient use of the application. Problems in the usability would be highlighted by tasks that deviated more from the benchmark user than tasks that were not as problematic in terms of usability.
4.3 Eye tracking apparatus and software
The Tobii T120 eye tracker with Tobii Studio 3.2 software was used to record the eye tracking data. The T120 records gaze points of both eyes, 120 times a second using an infra-red light source and cameras that are built into a 17 inch screen. The eye tracking data was exported as fixations using the Velocity-Threshold Identification fixation classification algorithm, provided by Tobii Studio. A fixation radius of 35 pixels and a minimum fixation duration of 100 ms were specified for exporting the fixation data. The BiYP application was run in the Windows Phone 7 emulator and viewed by the users by means of the T120 screen.
5 APPLICATION OF THE PROPOSED APPROACH
This section describes each of the steps in the proposed approach (see Figure 1) as applied to the eye tracking data captured while participants interacted with the BiYP application.
5.1 Eye tracking data split into subtasks
The three tasks of the usability study were divided into ten subtasks based on the user interface screens required to achieve the task. Event data in the running application was used to separate the eye tracking data into subtask segments. Task 1 and Task 2 had the same objective and therefore involved the same subtasks, namely 1, 3, 4, 6, 7 and 8, while Task 3 required subtasks 2, 3, 5, 9 and 10. Each subtask involved a particular action on a particular user interface screen. For example, subtask 3 involved selecting a particular supplier from the list of suppliers. This subtask was required in all the main tasks (ordering from a particular supplier and viewing the invoice for an order from a supplier). The interested reader is referred to Section 5.2.1 of the dissertation on which this work was based (de Bruin, 2014) for further detail on the subtasks.
5.2 Identification of benchmark users per subtask
Four criteria were used for the benchmark user selection. Firstly, only users who completed the task successfully were considered. Secondly, the percentage of correctly recorded eye tracking data was required to be 90% or higher. The data accuracy was considered to avoid a benchmark user with a low number of fixations due to the recording of a limited number of eye movements. The third criterion was to select the user with the least number of fixations. Finally, as the fourth criteria, if the first three criteria resulted in more than one user then the participant with the shortest time-on-task, between the qualifying participants, was selected as the benchmark user.
5.3 Identification of deviant subtasks and users per subtask and filtering of subtasks
The FDI, SDI and SLI metrics were calculated for each of the ten subtasks, based on the following parameters: the elimination threshold ( t) was set to 80% of the average component size (90 pixels in this case), the clustering threshold (tc) to 70 pixels, and cminwas set to 3 to filter out the clusters with less than three saccades.
The order of the subtasks based on the mean deviation index total (from most deviant to least deviant) was determined to be: subtask 5, subtask 2, subtask 9, subtask 7, subtask 6, subtask 4, subtask 10, subtask 3, subtask 8, and subtask 1. Based on this ordering, subtasks 5 and 2 were identified as the most deviant subtasks to be analysed further for usability issues. These two subtasks were both subtasks of the third task of the application: viewing the invoice of the orders placed. Usability analysis performed by an independent expert analyst identified the third task as the task that users struggled with the most-documented in Section 3.6.5 of the dissertation on which this work was based (de Bruin, 2014)-confirming that the process identified the most problematic task.
Although not a required part of the process, the data on the metrics are presented for interest. Table 1 shows the non-normalised mean FDI, SDIe, SDIrand SLI values for all participants. The second last row of the table gives the total of the normalised deviation index values (DIT, as defined in Section 3.2.3), while the final row gives the order of the subtask from most deviant to least deviant.
To understand what the values in Table 1 mean, consider subtask 1, which was the least deviant subtask. The FDI value is 2.1, which is the second lowest value compared to the FDI values of the other subtasks. This means that the fixations of participants were, on average, fairly similar to the fixations of the benchmark user when completing subtask 1. The SDIe value for subtask 1 is 52%. This value is fairly high compared to the other subtasks, meaning that a large proportion of the saccades of participants were similar to the benchmark user, and were therefore eliminated. The low SDIr value of 9.8 indicates that only a few saccades on average were not similar to the benchmark user saccades. Finally, the SLI value of 1067 is the lowest of all subtasks and indicates that users scanned their eyes less over the interface in places where the benchmark user did not scan, than for other subtasks. In contrast, subtask 5 can be seen to have an opposite profile of metrics and was the most deviant task.
Although only two subtasks are evaluated in depth in this paper, the reader interested in further analysis on the other subtasks is referred to Chapter 5 of the dissertation on which this work was based (de Bruin, 2014).
Given the subset of deviant subtasks, the three most deviant users per subtask (with the highest DIT values) were identified as:
• Subtask 5: users 1003, 1001, and 1026.
• Subtask 2: users 1003, 1008, and 1012.
The aggregated saccade data of these users is visualised with the benchmark user data in the final step of the process.
5.4 Visual output of benchmark and deviant visual strategies
The output from the process for subtask 5 is shown in Figure 5. After a particular supplier was selected in the previous subtask (Metro Hyper - Hillfox), this subtask required the user to view a placed order by selecting the 'orders' tab at the top right of the screen (next to the 'new order' tab). Figure 5(a) shows the visual strategy used by the benchmark user. The first fixation of the benchmark user (indicated by the number 1 in a circle) was in the middle top of the screen. The benchmark user then scanned down the centre of the screen, then up to the top right (fixation 5), where the tab was successfully located for achieving the task.
Figures 5(b) to 5(d) show where else the most deviant users on this subtask were scanning for information. Each triangle represents repeated scanpaths (3 or more) close together, shown as an aggregated vector in the direction of the apex of the triangle. It can be seen that all three users scanned up and down the products for new orders and across the header. User 1003 even scanned repeatedly up to the 'orders' tab, but it was not clear that this was a 'clickable' item on the user interface. The first usability problem identified is therefore that the 'orders' tab is not sufficiently visible (too light and the word was cut-off).
The output of subtask 2, the second most deviant subtask, is shown in Figure 6. This subtask required the user to view an invoice of the previous order placed by selecting the 'Shop' option from the main menu. The benchmark user achieved the task with seven fixations, starting on the middle right, then moving up to the 'Shop' item and over the description of the 'Shop' menu item, probably reading the description. In contrast, the three most deviant users, repeatedly scanned over all of the menu items. The second usability problem identified is therefore that it is not clear that the 'Shop' item on the main menu was the route to view previous orders.
6 DISCUSSION
One of the advantages of using eye tracking for usability is the potential for automation: eye tracking data can be captured and analysed without much need for input from the user. However, the analysis of eye tracking data by a usability expert can be extremely time consuming. In addition, the process of analysing eye tracking data can be viewed as subjective, due to the reliance on value judgements from the usability expert.
The proposed approach addresses these two concerns: human expert analysis time and subjectivity. Human expert time is reduced through the automated identification of usability problems and objectivity is introduced by using a data-driven approach. Important decisions in the process are based on numerical results: from the choice of the benchmark user to the identification of the most problematic subtasks and to the areas on the interface involving excessive search of users that were less successful at achieving the subtasks than the benchmark user.
Although the approach was demonstrated on a relatively small sample of data from 33 users, it should easily scale to much larger datasets. The analysis uses simple numerical calculations based on raw fixation and saccade data and requires no analysis of video sequences. Aggregated visual output highlights where the specific issues lie on the user interface. This can all be achieved without the need for expert usability analysis.
7 CONCLUSION
The advent of affordable and embedded eye tracking devices introduces the potential to perform widespread usability studies based on eye tracking data. Analysing eye tracking data manually can, however, be very time consuming. This paper proposes an approach for automatically identifying usability problems in applications that are focused on the achievement of tasks, such as business applications. The process identifies subtasks where usability is a problem and allows the evaluator to pin-point specific issues on the user interface screens through the visual comparison between efficient and less efficient visual strategies. Central to the process is the notion of a benchmark user who's visual strategy is used as a baseline for comparison against other users' visual strategies. The proposed method was tested on data from a mobile procurement application involving 33 participants and it was shown how the method identified two important usability problems in the interface.
This paper presents an initial attempt at automating usability analysis and introduces a number of opportunities for further work. Firstly, how well the approach identifies usability issues needs to be measured by comparing the results with other techniques not based on eye tracking. Secondly, the robustness of the method needs to be verified. One possibility is to select more than one benchmark user for each task and to test whether the same results are achieved with alternative good benchmark user candidates. The effect of the parameter choices (such as the saccade elimination threshold) and other choices (such as the benchmark user selection criteria) on the results can be investigated for different scenarios. Further work is also required to test the overall approach on different platforms, such as the built-in eye tracking facilities on mobile devices.
References
Albanesi, M., Gatti, R., Porta, M., & Ravarelli, A. (2011, June). Towards Semi-Automatic Usability Analysis Through Eye Tracking. In Proceedings of the 12th International Conference on Computer Systems and Technologies (pp. 135-141). Vienna: ACM. https://doi.org/10.1145/2023607.2023631 [ Links ]
Bednarik, R. (2007). Methods to Analyze Visual Attention Strategies: Applications in the Studies of Programming (Thesis, University of Joensuu). [ Links ]
Buswell, G. (1935). How People Look at Pictures: a Study of the Psychology and Perception in Art. Oxford: University of Chicago Press. 10.3758/BF03201553 [ Links ]
Byrne, M., Anderson, J., Douglass, S., & Matessa, M. (1999, May). Eye tracking the visual search of click-down menus. In Proceedings of the SIGCHI conference on Human Factors in Computing Systems (pp. 402-409). Pittsburgh: ACM. https://doi.org/10.1145/302979.303118 [ Links ]
Carpenter, R. (1988). Movement of the Eyes (Second). Pion Ltd.
Cashmore, S. (2012, April). Adding Muscle to Mobile Apps. ITWeb Brainstorm Magazine. Last accessed 06/06/2018. Retrieved from http://www.brainstormmag.co.za/indepth/trends/10698-adding-muscle-to-mobile-apps
Coltekin, A., Heil, B., & Garlandini, S. (2009). Evaluating the effectiveness of interactive map interface designs: a case study integrating usability metrics with eye-movement analysis. Cartography and Geographic Information Science, 36(1), 5-17. https://doi.org/10.1559/152304009787340197 [ Links ]
Cowen, L., Ball, L., & Delin, J. (2001). An eye movement analysis ofwebpage usability (Dissertation, Lancaster University). [ Links ]
de Bruin, J. (2014). Automated usability analysis and visualisation ofeye tracking data (Master's thesis, University of Pretoria). URL: http://hdl.handle.net/2263/41774. [ Links ]
de Bruin, J., Malan, K., & Eloff, J. (2013, August). Saccade Deviation Indicators for Automated Eye Tracking Analysis. In Proceedings of Eye Tracking South Africa (pp. 47-54). Cape Town: ACM. https://doi.org/10.1145/2509315.2509324 [ Links ]
de Bruin, J., Malan, K., Eloff, J., & Zielinski, M. (2014). The Use of a Benchmark Fixation Deviation Index to Automate Usability Testing. In P. S. P. Gamito & P. J. Rosa (Eds.), I see me, you see me: inferring cognitive and emotional processes from gazing behavior (First, Chap. six, pp. 104-124). Lisboa: Cambridge Scholars Publishing. [ Links ]
Drewes, H. (2010). Eye Gaze Tracking for Human Computer Interaction (Thesis, Ludwig Maximilians Universität). [ Links ]
Drusch, G., Bastien, J., & Paris, S. (2014). Analysing eye-tracking data: from scanpaths and heatmaps to the dynamic visualisation of areas of interest. In T. Marek (Ed.), Proceedings of International Conference on Applied Human Factors and Ergonomics. Krakow, Poland.
Duchowski, A. (2002, November). A Breadth-first Survey of Eye Tracking Applications. Behavior Research Methods, Instruments, & Computers, 34(4), 455-470. https://doi.org/10.3758/BF03195475 [ Links ]
Duchowski, A. (2007). Eye Tracking Methodology: Theory and Practice (Second). Secaucus: SpringerVerlag. [ Links ]
Ehmke, C. & Wilson, S. (2007, September). Identifying Web Usability Problems from Eye-Tracking Data. In Proceedings of the 21st British HCI Group Annual Conference on People and Computers: HCI (pp. 119-128). Swinton: ACM. [ Links ]
Ellis, S. & Candrea, R. (1998). Windows to the Soul? What Eye Movements Tell Us About Software Usability. In Proceedings of the 7th Annual Conference of the Usability Professionals' Association (pp. 151-178). Washington DC: UPA Press. [ Links ]
Eraslan, S., Yesilada, Y., & Harper, S. (2016, November). Scanpath Trend Analysis on Web Pages: Clustering Eye Tracking Scanpaths. ACM Transactions on the Web, 10(4), 20-35. https://doi.org/10.1145/2970818 [ Links ]
Fabo, P. & Durikovic, R. (2012, July). Automated Usability Measurement of Arbitrary Desktop Application with Eyetracking. In 16th International Conference on Information Visualisation (pp. 625-629). Montpellier: IEEE. https://doi.org/10.1109/IV.2012.105 [ Links ]
Ferhat, O., Vilariño, F., & Sánchez, F. (2014). A Cheap Portable Eye-tracker Solution for Common Setups. Journal of Eye Movement Research, 7(3), 1-10. https://doi.org/10.16910/jemr.7.3.2 [ Links ]
Goldberg, J. & Helfman, J. (2010). Scanpath Clustering and Aggregation. In Proceedings of the Symposium on Eye Tracking Research & Applications (pp. 227-234). New York: ACM. https://doi.org/10.1145/1743666.1743721 [ Links ]
Goldberg, J. & Kotval, X. (1999, October). Computer Interface Evaluation using Eye Movements: Methods and Constructs. International Journal of Industrial Ergonomics, 24(6), 631-645. https://doi.org/10.1016/S0169-8141(98)00068-7 [ Links ]
Goldberg, J., Stimson, M., & Lewenstein, M. (2002). Eye Tracking in Web Search Tasks: Design Implications. In Proceedings of the Symposium on Eye Tracking Research & Applications (pp. 51-58). New Orleans: ACM. https://doi.org/10.1145/507072.507082 [ Links ]
Hayhoe, M. (2000). Vision Using Routines: A Functional Account of Vision. Visual Cognition, 7(1-3), 43-64. https://doi.org/10.1080/135062800394676 [ Links ]
Hilbert, D. & Redmiles, D. (2000, December). Extracting usability information from user interface events. ACM Computing Surveys, 32(4), 384-421. https://doi.org/10.1145/371578.371593 [ Links ]
Holland, C., Komogortsev, O., & Tamir, D. (2012). Identifying Usability Issues via Algorithmic Detection of Excessive Visual Search. In Proceedings of the SIGCHI Conference on Human Factors in Computing Systems (pp. 2943-2952). Austin: ACM. https://doi.org/10.1145/2207676.2208703 [ Links ]
Hurley, R., Ouzts, A., Fischer, J., & Gomes, T. (2013). Effects of Private and Public Label Packaging on Consumer Purchase Patterns. Packaging Technology and Science: An International Journal, 26(7), 399-412. https://doi.org/10.1002/pts.2012 [ Links ]
International Standards Organisation. (1998). ISO 9241-11:1998 Ergonomic requirements for office work with visual display terminals (VDT)s - Part 11: Guidance on usability. ISO/IEC.
Iqbal, S. & Bailey, B. (2004). Using Eye Gaze Patterns to Identify User Tasks. In The Grace Hopper Celebration of Women in Computing - Making History (pp. 1-6). Chicago: ACM. [ Links ]
Jacob, R. (1990). What You Look at is What You Get: Eye Movement-based Interaction Techniques. In Proceedings of the SIGCHI Conference on Human Factors in Computing Systems (pp. 11-18). Seattle: ACM. https://doi.org/10.1145/97243.97246 [ Links ]
Jacob, R. & Karn, K. (2003). Eye Tracking in Human-Computer Interaction and Usability Research: Ready to Deliver the Promises. In J. Hyönä, R. Radach, & H. Deubel (Eds.), In the mind's eye: cognitive and applied aspects of eye movement research (Chap. four, pp. 573-605). Amsterdam: Elsevier. [ Links ]
Javal, L. (1878). Essai sur la physiologie de la lecture. Annales d'Oculustique, 79, 97-117. [ Links ]
Just, M. & Carpenter, P. (1976, October). Eye Fixations and Cognitive Processes. Cognitive Psychology, 8(4), 441-480. https://doi.org/10.1016/0010-0285(76)90015-3 [ Links ]
Komogortsev, O., Holland, C., Tamir, D., & Mueller, C. (2011). Aiding Usability Evaluation via Detection of Excessive Visual Search. In Extended Abstracts on Human Factors in Computing Systems (pp. 1825-1830). Vancouver: ACM. https://doi.org/10.1145/1979742.1979868 [ Links ]
Kumar, M., Paepcke, A., & Winograd, T. (2007). EyePoint: Practical Pointing and Selection Using Gaze and Keyboard. In Conference on Computer-Human Interaction (pp. 1-10). San Jose: ACM. https://doi.org/10.1145/1240624.1240692 [ Links ]
Lai-Chong Law, E., Scapin, D., Cockton, G., Springett, M., Stary, C., & Winckler, M. (2009). Maturation of Usability Evaluation Methods: Retrospect and Prospect Final Reports of. European Cooperation in Science and Technology. Toulouse: IRIT Press. [ Links ]
Land, M. F., Mennie, N., & Rusted, J. (1999). The Roles of Vision and Eye Movements in the Control of Activities of Daily Living. Perception, 28(11), 1311-1328. [ Links ]
Li, D., Babcock, J., & Parkhurst, D. (2006). openEyes: a Low-cost Head-mounted Eye-tracking Solution. In Proceedings of the Symposium on Eye Tracking Research & Applications (pp. 95-100). San Diego: ACM. https://doi.org/10.1145/1117309.1117350 [ Links ]
Poole, A. & Ball, L. (2005). Eye Tracking in Human-Computer Interaction and Usability Research: Current Status and Future Prospects. In C. Ghaoui (Ed.), Encyclopedia ofhuman computer interaction (Vol. 10(5), pp. 211-219). Idea Group Inc.
Rayner, K., Rotello, C., Stewart, A., Keir, J., & Duffy, S. (2001). Integrating Text and Pictorial Information: Eye Movements when Looking at Print Advertisements. Journal of Experimental Psychology: Applied, 7(3), 219-226. https://doi.org/10.1037/1076-898X.7.3.219 [ Links ]
Riihiaho, S. (2000). Experiences with Usability Evaluation Methods (Thesis, Helsinki University of Technology). [ Links ]
Ross, R. G., Olincy, A., Harris, J. G., Sullivan, B., & Radant, A. (2000, August). Smooth Pursuit Eye Movements in Schizophrenia and Attentional Dysfunction: Adults with Schizophrenia, ADHD, and a Normal Comparison Group. Biological psychiatry, 48(3), 197-203. https://doi.org/10.1016/S0006-3223(00)00825-8 [ Links ]
Russell, M. (2005). Hotspots and Hyperlinks: Using Eye-tracking to Supplement Usability Testing. Usability News, 7(2), 1-11. [ Links ]
Santella, A. & DeCarlo, D. (2004). Robust clustering of eye movement recordings for quantification of visual interest. In Proceedings of the 2004 Symposium on Eye Tracking Research & Applications (pp. 27-34). San Antonio, Texas. https://doi.org/10.1145/968363.968368
Skovsgaard, H. (2011). Noise Challenges in Monomodal Gaze Interaction (Thesis, IT University of Copenhagen). [ Links ]
Tobii Technology AB. (2012). Tobii Studio 2.2 User Manual. Tobii Technology AB.
Tseng, P., Cameron, I., Pari, G., Reynolds, J., Munoz, D., & Itti, L. (2013, January). High-throughput Classification of Clinical Populations from Natural Viewing Eye Movements. Journal of Neurology, 260(1), 275-284. 10.1007/s00415-012-6631-2 [ Links ]
West, J., Haake, A., Rozanski, E., & Karn, K. (2006). eyePatterns: Software for Identifying Patterns and Similarities Across Fixation Sequences. In Proceedings of the Symposium on Eye Tracking Research & Applications (pp. 149-154). San Diego: ACM. https://doi.org/10.1145/1117309.1117360
Young, L. & Sheena, D. (1975). Survey of eye movement recording methods. Behavior Research Methods & Instrumentation, 7(5), 397-429. [ Links ]
Zhai, S., Morimoto, C., & Ihde, S. (1999). Manual and Gaze Input Cascaded (MAGIC) Pointing. In Proceedings of the SIGCHI Conference on Human Factors in Computing Systems (pp. 246-253). Pittsburgh: ACM. https://doi.org/10.1145/302979.303053 [ Links ]
Received: 26 June 2017
Accepted: 29 May 2018
Available online: 10 July 2018

