


Services on Demand
Article
 English (pdf)
 Article in xml format
 Article references
Indicators

Related links
-
 Cited by Google
 -
 Similars in Google
Share

 Permalink
Journal of Transport and Supply Chain Management
On-line version ISSN 2310-8789
Print version ISSN 1995-5235
JTSCM vol.17 Cape Town 2023
http://dx.doi.org/10.4102/jtscm.v17i0.870
ORIGINAL RESEARCH
Bullwhip effect: Modelling and simulation of a sinusoidal stimulus considering food waste
David Rottenegger; Marcel Öfele; Hans-Martin Braun; Stefan Braunreuther
Faculty of Mechanical and Process Engineering, Augsburg University of Applied Sciences, Augsburg, Germany
ABSTRACT
BACKGROUND: The current coronavirus disease 2019 (COVID-19) pandemic has stressed why a change towards resilient, robust and sustainable supply chains is more imperative than ever. This is especially true for supply chains of perishable foods, where issues such as the bullwhip effect cause not only economic but also environmental damage.
OBJECTIVES: The key objectives of this study are to gain a deeper insight into correlations regarding the causes of the bullwhip effect and to see how a sinusoidal stimulus is affecting the generation of food waste.
METHOD: A simplified beef food chain was modelled in Tecnomatix Plant Simulation®. As the bullwhip effect consists of a simplified parameterisation of an excitation duration (period length) and its height (amplitude), these two variables were used to generate a sinusoidal stimulus. The simulation results were statistically verified and checked for commonalities and differences with the already established scientific knowledge.
RESULTS: While the expected higher sensitivity of the front links of the supply chain to waste generation can be confirmed, the results of a long stimulation period suggest that the negative effects of the bullwhip effect do not increase indefinitely.
CONCLUSION: The analysis of the results has shown that previous theories can be transferred, but that the variation of the variables entails new insights for the interdependencies of the amplitude and period length and their influence on the output variable waste.
CONTRIBUTION: The study contributes to a more holistic understanding of the bullwhip effect and, in particular, its implications within a perishable food supply chain.
Keywords: bullwhip effect (BWE); short food supply chain; modelling and simulation; resource efficiency; sustainability; digitalisation in production.
Introduction
The coronavirus disease 2019 (COVID-19) pandemic has stressed out why robust and resilient food supply chains (FSCs) have to be enhanced to function under all circumstances to ensure the sufficient supply of affordable perishable food (European Commission 2020:2; Singh et al. 2021:2). To address this challenge in the long term and simultaneously create a more sustainable form of supply chains (SCs), a more regional approach, the so-called short food supply chain (SFSC), has become the focus of scientific research over the last two decades (Wang et al. 2021:90). Furthermore, the customers' strict quality requirements cause shorter product-lifecycle durations for most product types, including the food sector (Kloeber-Koch, Braunreuther & Reinhart 2017:360-365). Hence, the development of sustainable and resilient SFSCs is a challenge for all involved stakeholders. The vulnerability of SCs is particularly important for food supply chains, where the perishability of the products causes not only economic but also environmental damage. Furthermore, the issue of food waste in the broadest sense is also relevant to the discussion of ethical responsibility towards the global food situation. However, this topic is only briefly introduced in the literature review and is not considered in all its depth.
In February 2019, the German government presented the 'National Strategy for Food Waste Reduction', which defined four different fields of action and is seen as an important step towards a more intense collaboration of all stakeholders along the FSC, increasing awareness, improving data quality and monitoring as well as implementing prevention measures in practice (Leverenz et al. 2021:1-23). Innovative solutions for direct and efficient communication between the different levels of the SC offer big potentials for food waste reduction through, for example, demand-based order volumes, a more flexible delivery and transport topology as well as flexible price adjustments (ed. Federal Ministry of Food and Agriculture 2019). Combining SFSCs with innovative digital technologies, such as information and trading or service platforms, as well as big data analysis and artificial intelligent (AI) offers a chance to retrieve SC performance potentials very efficiently (Ran et al. 2020:2). An example for such a research venture is the government-funded (Federal Ministry for Economic Affairs and Climate Action, former Federal Ministry for Economic Affairs and Energy) 'Resource-efficient, Economic and Intelligent Foodchain (REIF)' project. The research project is aiming to identify potentials and concepts for innovative solutions based on AI to reduce food waste at every level of the FSC. Using Big Data analytics and Machine Learning on one hand, corporate processes are continuously improved and on the other hand, the bullwhip effect (BWE) is challenged through gathering and distributing aligned information at every level when needed (Resource-efficient, Economic and Intelligent Foodchain 2021).
Analysing the structure of perishable FSCs, the related state of research, developed and applied management strategies and concepts (based on modelling and simulation), a need for further research is evident, especially while considering the aspired resilience and sustainability. Furthermore, according to Durán Peña Ortiz Bas and Reyes Maldonado (2021:1), the current state of research neglects especially the level of food waste as well as the effects over several periods of time in its investigations.
The objective of this study is to provide a basic understanding of the correlation between demand quantity, stock levels and generated waste over a fixed period of time, when adequate demand forecasting is neglected. More specifically, it is measured by how strong the correlation is between the BWE - input variables (Amplitude and Period Length) - and the output variable (Waste). However, in contrast to using a punctual and sudden increase in demand as stimulus of the SC dynamics to provoke the BWE, in this article a stimulus in the form of a sinusoidal wave iterating several times is applicated. The chosen stimulation form and duration shall help in gaining further insights into the complex effects of the BWE as well as to identify differences in the implications on the individual SC levels. The focus of the analysis lies on the effect power by the input variables Amplitude and PL causing different amounts of waste along the FSC. As the amplification of the order quantities was simplified to several oscillating linear systems it is of utmost interest to see whether differences to a punctual and erratic stimulus can be identified. As the generated waste causes not only monetary but also ethical damage it has to be given special consideration in future management strategies and concepts.
Literature review
Bullwhip effect
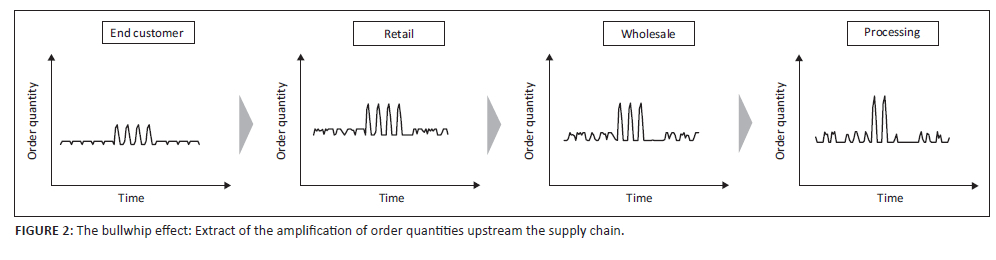
The BWE was first identified by Forrester (1958:37-66) while conducting a case study on SC management and described as the amplification of order volatility along the SC (Ran et al. 2020:13; Wang & Disney 2016:691-701). Furthermore, in Papier and Thonemann (2018:49-51) four main causes of the BWE were identified: Demand forecasting along the SC, lot sizing, rationing and price fluctuations. In addition, elements such as demand, delay, forecasting policy, ordering policy and information sharing have to be considered investigating the BWE (Ran et al. 2020:1-2; Wang & Disney 2016:691-701). In general, the BWE has a negative impact on the availability of products, generated waste and the costs in the SC because precautionary high safety stocks have to be kept in the individual stages (Papier & Thonemann 2018:49). Moreover, additional costs derive from scaling production capacities (machines, workforce, workload), poor supplier relationship or general system nervousness (Wang & Disney 2016:691-701). As only 11 of the analysed articles in the literature review by Oliveira, Lima and Montevechi (2016:173) dealt with the topic of the BWE or demand side management in general, the goal of controlling the BWE is not satisfyingly achieved so far. Furthermore, it's probable that the BWE is not a universal phenomenon as it differs because of certain constraints of each use case. Latest research states that through the help of digital technologies the BWE can actively be dampened through, for example, real-time information sharing, safe blockchain communication and the application of Internet of Things (Ran et al. 2020:2). As digital technologies are already implemented in (lean) manufacturing systems to make them more efficient (Hoellthaler, Braunreuther & Reinhart 2019:198-203), which on the other hand requires the application of multiple sensor (systems) to derive the proper data (Kloeber et al. 2017:360-365), the data basis for these innovative digital technologies is already set up.
Perishable food supply chain: Beef
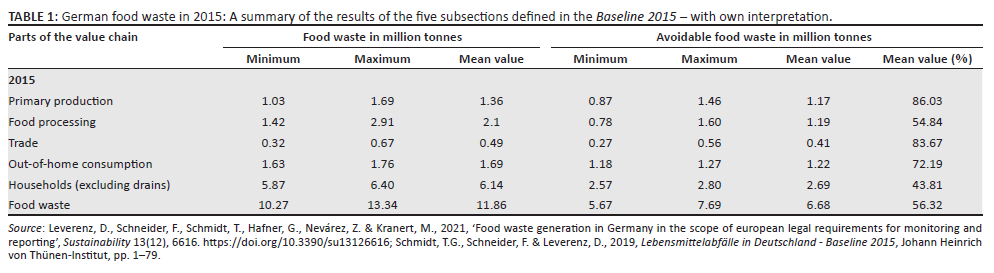
The total global production of meat products tripled from 1970 to 2009 (Draeger de Teran 2014:345) and has continued to grow until recently (ed. Food and Agriculture Organization of the United Nations 2019). Although there was a slight decline in the per capita consumption of beef and veal meat in Germany in 2021, with a total consumption of 55 kg meat per capita (9.4 kg beef and veal, 13.1 kg poultry and 31 kg pork) there is still a considerable demand (Federal Office for Agriculture and Food 2022:23). Taking a look at German food waste the Baseline 2015 (see Table 1) quotes an average of almost 12 million tonnes of food waste, of which an average of 6.7 million tonnes was declared theoretically avoidable (Hafner et al. 2012:121; Schmidt, Schneider & Leverenz 2019:10). As shown in Table 1, an estimated maximum of 2.77 million tonnes of avoidable food waste was generated in the categories Primary Production, Food Processing and Trade, which can be assigned to the FSC according to Leverenz et al. (2021:10). Thus, creating a paradox of 33 million people living in the EU who cannot afford a quality meal every 2nd day (European Commission 2020). Furthermore, it is an essential challenge to reduce food waste in order to secure the food supply situation of the ever-growing world population, as it can be directly influenced thereby (Durán Peña et al. 2021:1-2). Finally, an ethical discussion regarding a beef supply chain must also consider issues such as compulsory euthanizing animals (Hobbs 2021:191). In 2015, about 22% of all meat products in Europe were squandered, of which 12.2% have been wasted along the FSC (Royte 2016). Looking at German food waste this is equivalent to 50 000 cattle, 450 000 turkeys and 640 000 pigs needlessly slaughtered and wasted along the FSC (ed. Heinrich-Boell-Stiftung 2021:41). As already mentioned, the ethical discussion will only be considered cursorily at this point to avoid overstretching the scope of this article.
Beyond that, the global total agri-food system accounts for one-third (16.5 billion tonnes) of global Greenhouse Gas (GHG) emissions (Tubiello et al. 2021:6). Livestock farming, which includes cattle production, is one of the largest ground and resource users in the world. Pastures (for cattle) and croplands (for the production of animal feed) regarding livestock farming, without the areas for further processing centres, such as slaughterhouses or other suppliers, sum up to an area that covered one third of the total terrestrial earth surface in 2019 (Draeger de Teran 2014:345). According to Wuehle (ed. 2020:43), livestock farming, with its huge cattle and pig herds emitting huge amounts of methane, is responsible for about 18% of the total GHG emissions. This value corresponds to one fifth of all GHG emissions and is on par with the entire transportation sector.
To illustrate the environmental impact, the carbon dioxide equivalent (CO2e) is used, which is a metric measure to compare emissions from various GHGs on the basis of their global-warming potential (GWP). Thereby the amount of other gases is converted to the equivalent amount of carbon dioxide with the same GWP, for example, the GWP for carbon dioxide and methane is 1 and 25, respectively (Brander 2012). For example, sold beef in Germany has a potential GHG emission of 13 kg CO2e per kg, which is twice as high as the CO2e of pork or poultry (Foster et al. 2006:82-86; Mueller-Lindenlauf et al. 2013:15; Reinhardt, Gaertner & Wagner 2020:13). Furthermore, in an inner German comparison with fruits and vegetables such as apples (Ø 0.3 CO2e), potatoes (0.2 CO2e) or imported avocados from Peru (0.8 CO2e), the high environmental impact of beef is even more evident (Reinhardt et al. 2020:8-11). It is demonstrated that the resource requirements needed during production, transportation and sale of beef must not be wasted because of their high environmental impact.
Food waste within the SC can be avoided by optimising its general performance and bringing the entire structure to a more regional level. A more local design of SCs has already been discussed and investigated by researchers with simulation-based studies (Tundys & Wiśniewski 2020:1-17). However, the implementation of regional SCs has been the exception rather than the rule so far. An improvement of SC performance in the livestock farming sector will have significant impacts on the numerous stakeholders, the environment and the society in general. Furthermore, from the perspective of the company's corporate social responsibility (CSR) ranking, reducing GHG emissions, using land more efficiently or reducing food waste along the SC is an important concern (Manning, Baines & Chadd 2006:358-370). Although the CSR cannot be defined conclusively and unambiguously until today, it is of very high importance for companies. At the core, the CSR represents the responsibility of companies towards society, which goes beyond laws, obligations and purely economic action - however without neglecting their proper economic goals (Lischka 2019:149-157). Good CSR management has an effect on the attractiveness of the company for existing and new employees, the general reputation and protection of the brand as well as governmental funding for innovation and much more (Loew & Clausen 2010:8-10).
Supply chain simulation
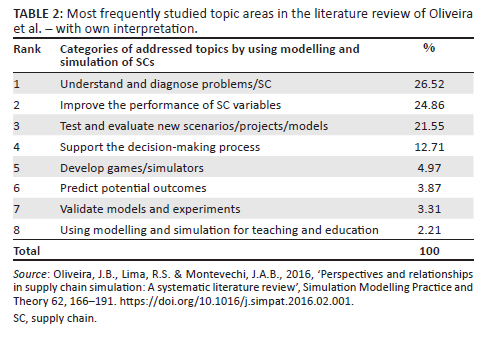
Describing realistic cases with mathematical models is problematic as the system quickly becomes very complex. Furthermore, using analytical methods to filter out the proper and important information of such models is a long-term endeavour. Therefore, researchers started using modelling and simulation to investigate, for example, SC performance or management problems, as it is the only practical option to explore such large-scale systems (Tundys & Wiśniewski 2020:9). In a systematic literature review by Oliveira et al. (2016:166-191) regarding perspectives and relationships in supply chain simulation the generic advantages of computational SC simulation are stated. Therefore, 827 published articles have been reviewed and the most frequently studied topics addressed by modelling and simulation were categorized. The top four categories, which account for 85.64% of all topics, dealt with understanding and diagnosing problems/SCs, followed by improving SC performance, testing and evaluating new scenarios/projects/models, and decision support (see Table 2). Furthermore, the simulation approach is distinguished between different types such as discrete-event simulation (DES), agent-based simulation (ABS) or continuous simulation (CS). Discrete-event simulation occurred in about 40% of all article studied and was most appropriate for testing and evaluating, improving or understanding SCs (Oliveira et al. 2016:175-179).
Respecting the remarkable findings made during this analysis the definition of a SC applied in this article follows the definition described by Oliveira et al. (2016:166): 'an aggregate set of value chains linked by inter-organisational relationships, both upstream and downstream'. The bilateral connection in up and down directions is very important to mention as it's making the SC modelling and simulation highly complex. Streams as product, cash and information can go in both directions and are influencing each other in iterative loops. The performance of FSCs can be measured not only by financial metrics but also by the just in time and the overall adequate availability of products as well as the number of wasted products.
As meat is a product with a short shelf life, a demand-oriented production with short transport routes is desirable from both an ecological and an economic perspective. A transformation from a global SC to a more regional-based SFSC, with the development of a general SC control strategy, is presented in Tundys and Wiśniewski (2020:1-17) as well as further examples can be found therein in the given literature overview. For this purpose, simulations on various short-term market changes were carried out and the impact on the SFSC as well as in particular the profitability of several producers was observed. A main conclusion of all these studies is that a lot of empirical and theoretical aspects of SFSC optimisation by computer-aided simulations couldn't be fully considered due to their high complexity. Nevertheless, there are possible indications that SFSCs do not always offer a guaranteed advantage over classical SC, as described, for example, in Santini and Stein (2020) (Tundys & Wiśniewski:8-17).
Methodology: Concept, modelling and simulation experiments
Concept
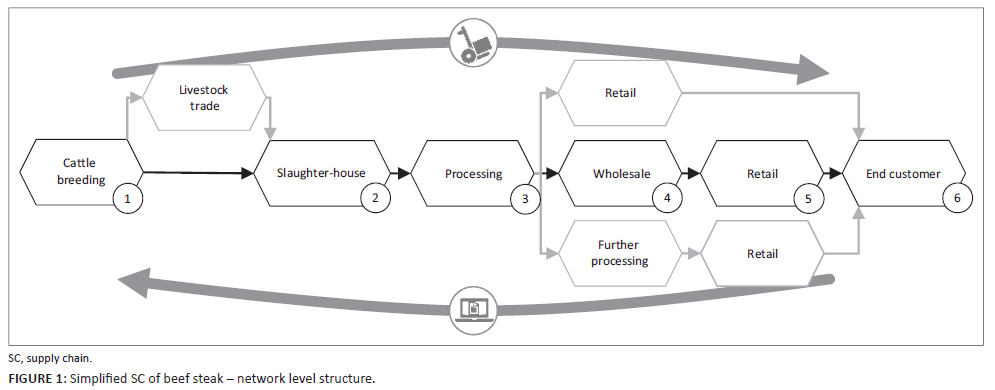
The modelled SC mimics a real-world SC of a beef steak production, which is designed based on the insights gained during discussions with relevant stakeholders from the REIF project. That way, the proper accuracy as described in Wang and Disney (2016:691-701) - while simplifying the SC as much as possible - was ensured. The SC consists of six separate network levels, which are connected in sequence: (1) cattle breeding, (2) slaughterhouse, (3) processing, (4) wholesale, (5) retail and (6) end customer (see Figure 1). For this first analysis using SC simulation only logistics and data streams (e.g. order quantities) are considered. Hence, the defined SC is convenient for gaining a basic understanding of functionalities and interrelationships of the variables defined in Table 3. The product quantity demanded by the end customer logically plays a decisive role as according to Forrester (1958:37-66), demand information is the basis for production planning and logistics (initial trigger of the SC dynamics), which is often difficult to predict because of the numerous actors involved. As a flow of information, the demand quantity streams in the opposite direction to the material flow, starting from the end customer to processing (see Figure 1 and Figure 2).
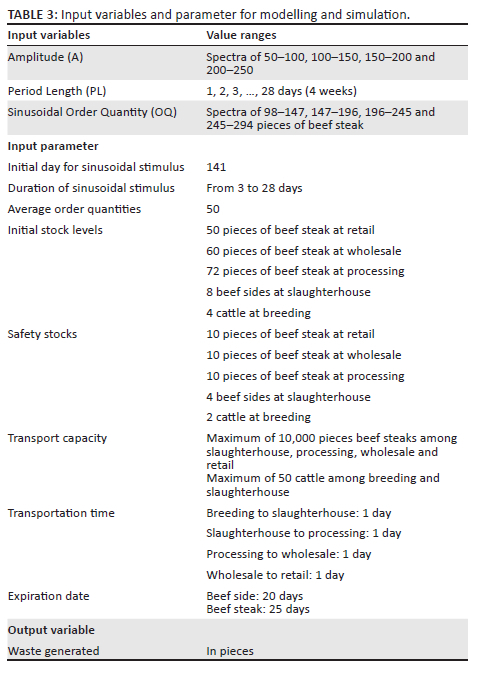
Figure 2 shows the basic logic of the modelled ordering process applying the factor 1.2 to every order downstream the SC, neglecting a proper demand forecasting and causing the described order amplification (BWE).
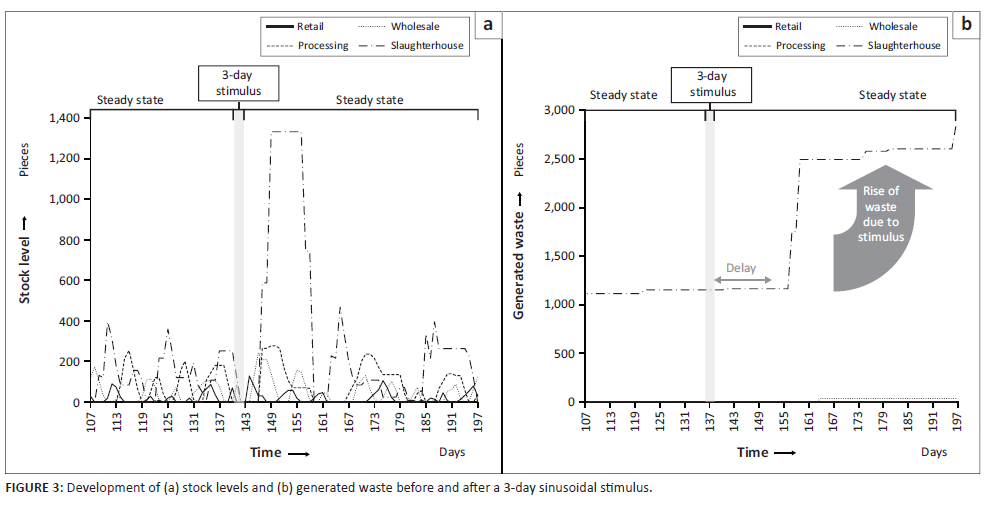
In Figure 3, it is observed that through a punctual and sudden increase in demand, in this case the first 3 days of the sinusoidal stimulus (see Figure 3), especially the slaughterhouse as a leading network in the SC is affected. According to Ran et al. (2020:2) and Lee, Padmanabhan and Whang (1997:546-558), this implication of the BWE is caused because of the distortion phenomenon, when the order information is passing downstream. The increased stock size in the slaughterhouse (see Figure 3a), induces both higher costs for inventory and a delayed generation of high amounts of waste directly after the period of the 3-day stimulus (see Figure 3b). The stock level development in the other networks at the time of and after the stimulation shows only a slight reaction to the stimulus and underlines once again the posited thesis in Ran et al. (2020:1-28) and Lee et al. (1997:546-558).
For conducting a simulation study, a proper simulation tool is key important for subsequent efficiency in model creation as well as for modelling capabilities regarding highly complex problems (VDI-Fachbereich Fabrikplanung und -betrieb 1997). As described here, the use of DES-based simulations is well suited for the replication of SCs. The model is therefore generated with the DES-driven program Tecnomatix Plant Simulation® (PS). The suitability of PS for modelling and simulation of SCs was investigated on the basis of the criteria catalogue of the VDI Guideline 3633 Sheet 4 in VDI (1997). The benefits of PS to derive simulation-based management strategies are demonstrated in Bank et al. (2019:294-299), where a PS-based simulation was used to observe the models' response to changing market conditions.
The following experiments based on a DES-based simulation with PS are designed on the partial findings made during the running project research in REIF. As shown in Figure 1, the model follows the principals of a network-level structure. The networks themselves consist of a complex structure including PS elements as objects, methods, generators, tables and variables. The processes such as slaughtering, counting goods receipt, commissioning, assigning expiration date etc., are embedded in several methods. These methods are programmed with the PS programming language SimTalk.
Modelling
Variables and parameter
Initialisation of supply chain dynamics - order quantity
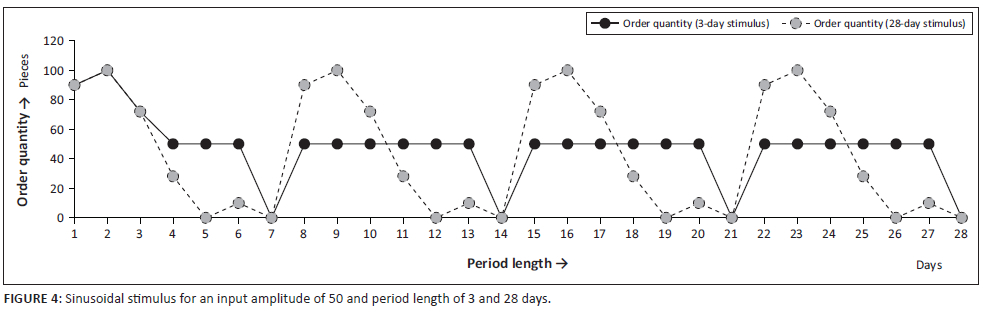
The stimulus of the model (see Figure 4), that is, the initial order process of the end customer in network (6), leads to a chain reaction upstream the model from network (6) to (1). Hereby, an initial 'ordering method' in network (6) consigns a generated value into the corresponding table in network (5). The 'ordering method' specifies an average order quantity of 50 pieces of beef steak (1 kg) for 337 days in a year (see Table 3). The variation of the order quantity OQ over a given amplitude A and a period length PL follows the sine function:

The amplitude defines the peak deviation of the sine wave, whereby it oscillates by the factor of  in the direction of Y, starting from the average order quantity (50 pieces). The period length indicates how long the stimulus is applied to the model. On Sundays no order quantity is passed through the networks, thus it is set to zero.
As described here, the BWE is usually understood as a punctual, sudden increase in demand. In reality, however, a rise in demand does not only occur on a single day, but usually fluctuates over several days to several weeks, which, for example, can be caused by weather-related factors. Furthermore, it can be understood as recurring or even periodic fluctuation in a short period of time, such as a strongly shortened seasonal or cyclical fluctuation in demand in the broadest sense, idealized as a sine wave. Of course, this does not mean periodic iterations, which are recognized by inventory management software and can thus be planned. The stimulus is on the one hand chosen, to check whether the model transmits the oscillations of the stimulus and how this affects the food waste. On the other hand, the procedure seems reasonable as varying the excitation can help to better understand and contextualise the cause and effect chains within the model and identify possible correlations.
Passing on the order quantity
The order quantity received from the subsequent network is offset against the safety stock and afterwards multiplied by the factor of 1.2. To ensure the provocation of the BWE as well as neglecting proper demand forecast, the additional 20% for each order was defined self-determined as the safety stock levels are kept at a minimum. Thus, additional conditions such as lot sizes, storage, ordering and transport costs that have an influence on the order quantity can be neglected in order to initially limit the complexity of the correlations in the model to the observed variables. However, the order quantity is set to zero using a stock levelling method, if the current stock level less than the order quantity does not fall below the safety stock level. Although if the safety stock level is undercut, the number of pieces needed to regain the safety stock level is added to the calculated order quantity. The final calculated value is then passed on to the prior network. Mathematically, this results in a linear equation for each network, which, summarized in a single linear system of equations, develops into a system capable of oscillation. The delivery of products from network to network takes place on a daily basis, that is, every 24 h.
Stock levels and generation of waste
The initially set stock levels in the individual networks are in line with the average order value of 50 pieces. Simulations have shown that there is no significant influence of the initial stock levels on the output variable waste. Therefore, this variable is not considered further in the evaluation.
In every network, the products, that is, cattle, beef sides and beef steaks are provided with an expiration date, which is controlled/checked at each storage cycle in the corresponding network. The expiration date is exceeded, if the corresponding transport time to the retail plus 7 days of remaining expiration period at the point of sale, is longer than its shelf life. The product is dumped in the network where it is currently located. All storage processes follow a first-in-first-out strategy.
Simulation experiments
All simulations, that is, experiments, were created, managed and executed by the experiment manager tool of PS. It allows a structured and automated simulation. For the variables amplitude and period length start and end values were defined as shown in Table 3, resulting in a total of 1428 simulation experiments. In each case 365 days, that is, the behaviour of the SC over 1 year was simulated. The statistical analysis was conducted using the IBM®SPSS Statistics® software.
Analysis and findings
Non-statistical analysis
Looking at the mean value of the stocks for each SC level over the course of a year (see Table 4), an increase in the stock size mean value in each network can be observed as the amplitude spectra increases. This is seen for both short (3 days) and long (28 days) period lengths of the sinusoidal stimulus. The short period length of 3 days was chosen to simulate the above-described 'classic' BWE with a punctual and erratic stimulus. As the sinusoidal order quantity described in Eqn (1) reaches its maximum after 2 days, in this way the BWE can be observed in the best possible manner. After 28 days, the order quantity decreases to 50 and the effect of the entire sinusoidal stimulus can be observed. For an in-depth understanding of the results, a simulation with amplitude and period length equal to zero was performed to see how the average stock levels and the generated waste behave in this stimulation-free scenario. The network breeding is not considered observing average stock levels and generated waste at this point, because of its complex structure of livestock farming, where a simple expiration date cannot be assigned.
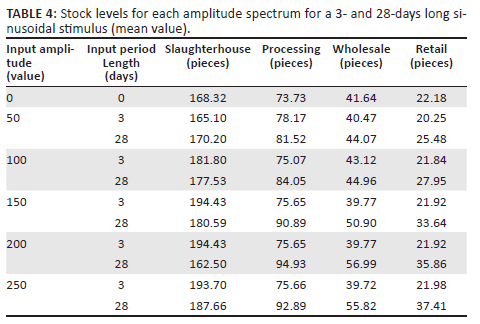
The results in Table 4 show the stated sensitivity of the leading networks is evident for a short (min.: 165.10 / max.: 194.43) as well as a longer period length (min.: 162.50 / max.: 187.66), as the slaughterhouse has by far the highest average stock levels. Furthermore, it can be seen that for a 3-day stimulus at the amplitude of 150 and 200 in the slaughterhouse and in the retail at an amplitude of 250 the stock levels reach their maximum of 194.34 and 21.98 pieces. At an amplitude of 50 the processing (78.17 pieces) and for an amplitude of 100 the wholesale (43.12 pieces) meet their peak. At this point, the amplitude seems not to have a direct positive linear effect on stock levels for short periods of the sinusoidal stimulus, as for a period length of 3 days and an increasing amplitude shows that the maximum values partly occur at lower amplitudes. However, it is interesting to see that for a period length of 28 days, all peak average stock levels occur at an amplitude of 250 (187.66, 94.93, 56.99, 37.41). However, the 4-week sine stimulation does not always cause higher average stock levels than the 3-day stimulation. In general, the difference between the average stock levels for the two different period lengths at each amplitude is not very large, with an average of 11.38 pieces. Consequently, for a period length of 28 days and an increasing amplitude, all maximum average stock levels are in the range of an amplitude of 250.
However, Table 5 shows a complex correlation of the input variables amplitude and period lengths that could be assumed so far. A period length of 3 days is causing almost no waste over all the rear networks in the SC just like the stimulation-free scenario. A little amount of waste generated at the network of the wholesale (18.26 to 18.31 pieces) is negligible in relation to the waste generated at the slaughterhouse (1690.48 to 2167.05 pieces). For a short period length at the processing no waste is generated at all, despite its proximity to the slaughterhouse.
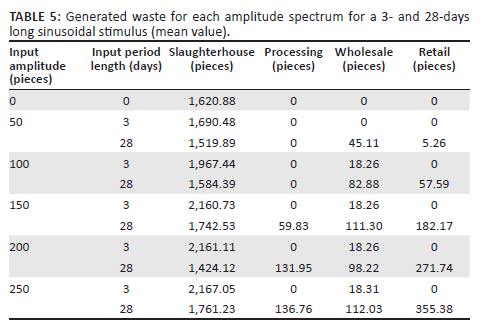
A sinusoidal stimulus of 28 days is for the first-time causing waste across all SC levels for an amplitude of 150, whereas for lower values only a slight increase of waste at the retail and wholesale can be seen. It is noteworthy that while the 4-week sinusoidal stimulus is provoking waste across the whole SC, the amount of waste generated at the slaughterhouse is on average less than that generated by a punctual erratic stimulus (3 days). This leads to the assumption that this form of stimulation causes a shift in the sensitivity of the individual networks in the SC, as well as implicating a limitation of the negative effects of the BWE.
At this point, it seems that a larger and longer sinusoidal stimulus is causing a more complex reaction of the model, strongly differing from SC level to the next level, which may have been induced by a different response of the model to different period lengths, that is, frequencies of stimulation. The sensitivity of the leading SC levels is evident while observing the average stock levels and the generated waste.
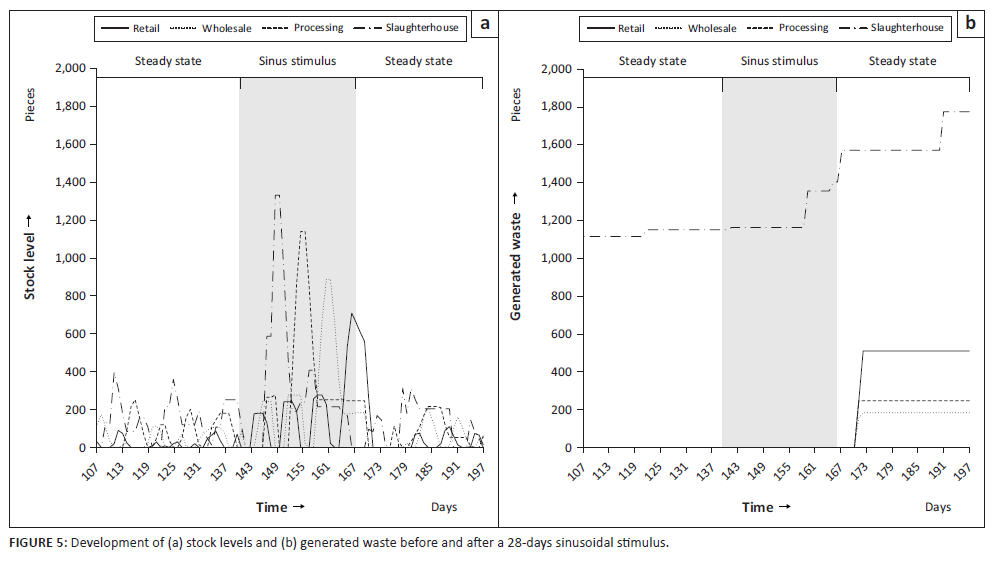
While there are no obvious insights from observing the stock levels so far, plotting their development over the time offers more possibilities for potential interpretation. Looking at the course of the stock levels and the generated waste (see Figure 5), for an input value for the amplitude of 200 and a period length of 28 days, the complexity of this form of stimulation becomes apparent. While after applying the 3-day stimulus only the foremost network was strongly affected (see Figure 3), a staggered sensitivity with decreasing strength is now evident. The stock levels jump with a time delay (approximately every 7 days, i.e. each time after the passage of a sine period), which means that the sine waves affect the SC levels, respectively, the stock levels one after the other in the direction of the end customer (see Figure 5a).
Considering the impact of the stimulus on the generated waste (see Figure 5b), there is a common abrupt increase in the retail, wholesale and processing networks. This implies that the products that arrived at the slaughterhouse at the moment of the first sine wave are gradually released to the subsequent networks during the further waves of demand. This is also supported by the fact that no abrupt increase in generated waste can be observed in the slaughterhouse at this time. The products that are not sold are then dumped in the respective networks after their 25-day shelf life has expired.
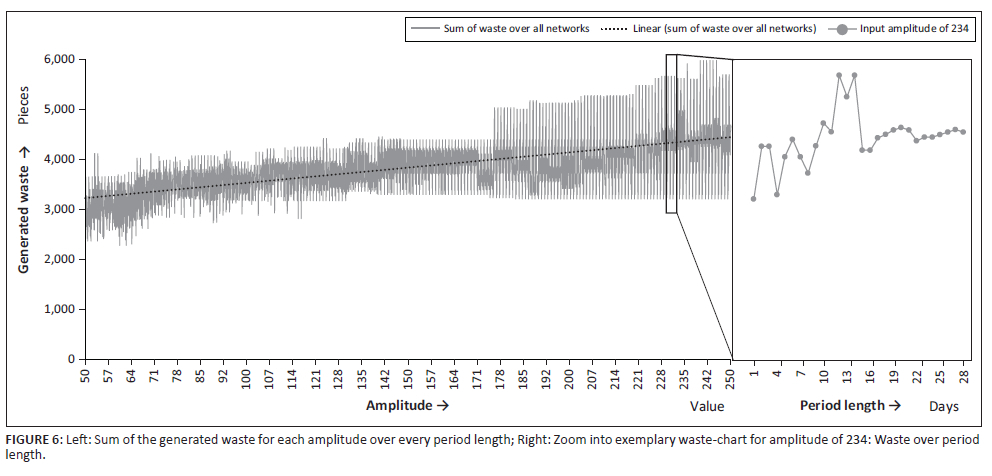
Further insights can be seen in Figure 6, which shows the sum of generated waste across all networks for each period length (1-28 days) for increasing amplitudes. As a positive linear trend can be identified, it can be assumed that a higher amplitude is causing higher amounts of waste along the SC. However, it can also be seen that, for example, an amplitude of 100 does not cause twice as much waste as an amplitude of 50. The model responds to the incremental increasing intensity of the sinusoidal stimulus, although it generates only a moderate increase in the output variable waste. For the evaluation of the actual significance of the variables amplitude and period length further statistical analysis is essential to make valid statements.
The oscillation of the waste generated (summarised over all networks) shows that the created model, with its linear process of passing order quantities, is apparently reacting pulsatory to the sinusoidal stimulus. A fast-Fourier-transformation was performed to compare the simulations results with the sinewave described in Eqn (1). It revealed that the graph of the oscillatory waste in Figure 6 does not contain any frequency components of the sinusoidal stimulus from (1). Thus, the graph of the summarized generated waste shown in Figure 6 is considered chaotic.
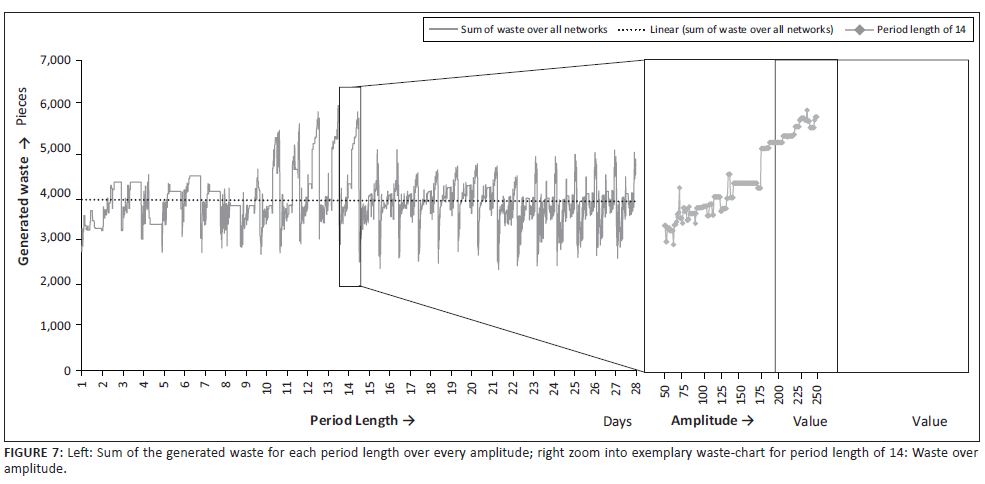
Figure 7 shows, analogous to Figure 6, the sum of the generated waste across all networks for each period length, in each case for all values of the amplitude from 50 to 250. It can be seen that a higher amplitude generates a bigger amount of waste, as for each period length (low and high) the amount of waste rises with increasing amplitude values, presented by the lower average peaks over a period length from 1 to 9 days, as well as from 15 to 28 days.
However, a linear trend line shows a minimal negative trend, which suggests that the longer the stimulus is applied to the model, the less waste is produced. This could be a first hint that the BWE has a time limit, because the model might settle into a new steady state at a certain point in time - where less waste is generated. Furthermore, this assumption is supported by the fact that all peak values of the waste occur between a period length of 10 and 14 days. Thereafter, the values continue to oscillate strongly, but around a significantly lower average value.
Statistical analysis
For a statistical analysis of the data or the selection of the suitable statistical evaluation method, the examination of some conditions is necessary. In particular, the two characteristics 'paired/unpaired' and 'parametric/non-parametric' of the sample (simulation results) have to be checked (Hazra & Gogtay 2016:251-260).
The first step was to examine whether the values in each sample are dependent on each other. If the values of one sample influence the values of another sample, the samples are interdependent - they are paired. As the experiment manager performs a reset for each variation of the amplitude or the period length, the simulations do not influence each other and are therefore considered unpaired.
As second step it was analysed whether the samples are parametric, that is, whether there is a normal distribution of the data sample or not. For a different amplitude and period length, each sample was tested for normal distribution, with an alpha of 5%, using the Epps-Pulley test. There were no uniform and unambiguous results regarding the existence of a normal distribution for all samples. For most samples, a normal distribution could be rejected; for others, it could not. As for statistical analysis, one method has to be chosen, which can be applied to equally analyse all samples, a procedure for unpaired and non-parametric samples was selected. Thus, no statistical preconditions are violated. That way, it is ensured that all results are comparable and corresponding trends can be identified. Based on the analysis of these characteristics, the Kruskal-Wallis test combined with post-hoc tests seems to be the best method of analysis (see Figure 8).
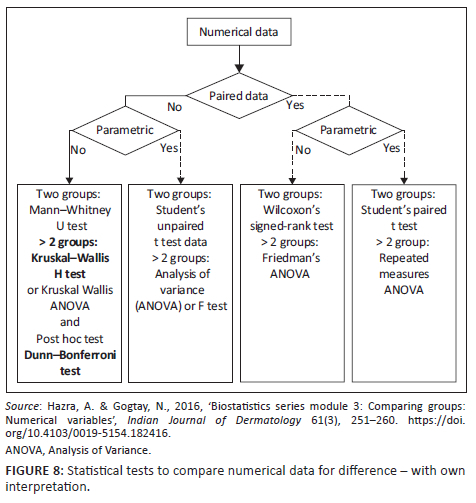
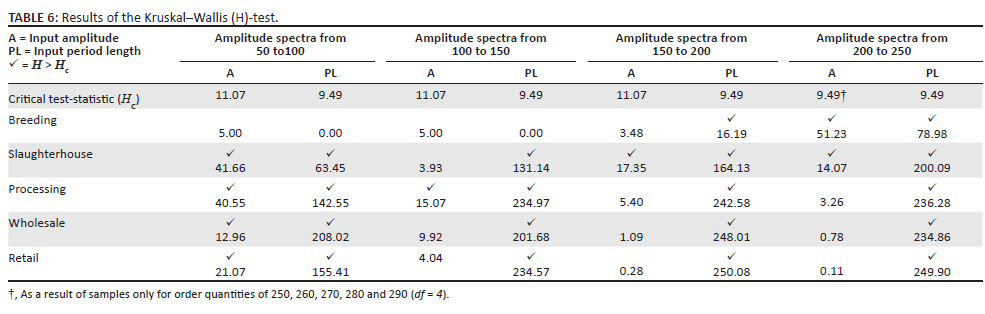
The Kruskal-Wallis test (H-test) can be regarded as a generalisation of the Mann-Whitney U test and as a non-parametric equivalent of the single-factor analysis of variance (ANOVA). The H-test is a method to check whether samples originate from the same distribution by comparing two or more independent samples for a stochastically dominance, thus a significant difference of the mean values. Therefore, with an a priori defined significance level of 5% the test statistic (H), which represents the absolute value of chi-squared (χ2), is calculated and checked if it's in excess of the critical test statistic (Hc). The critical test statistic is defined by the chi-squared distribution. This hypothesis test was performed for ad hoc and classified each data depending on the variable amplitude and period length to determine whether they have a significant influence on the output variable waste. At least one stochastically dominant sample is statistically firm if H > Hc (SFU Institut fuer Statistik 2021:68-86).
At this point, however, it cannot be determined how often or between which samples a stochastically dominance appears. To locate the significant difference a pairwise comparison is therefore conducted using the Dunn-Bonferroni test. Furthermore, with this post hoc test the power of the effect, thus dominance, can be measured. As a result of the high number of samples as well as to ensure to avoid the Type I error, when conducting multiple pairwise comparisons a simplification of the whole data set was necessary (SFU:68-86). Consequently, for the Kruskal-Wallis and the Dunn-Bonferroni tests considering the variable period length every set of samples (for each amplitude spectrum) consists of the results for a period length of 1, 7, 14, 21 and 28 days. For example, for a period length of 1 day the sample represents the waste generated for the whole amplitude spectrum, thus 51 values. Equally the analysis was conducted for the variable amplitude with a data set consisting of the results for an ordering amplitude increased in steps of 10 starting from a basis of 100, 150, 200 and 250. These samples, for example, for an amplitude of 100 show the waste generated for all period lengths from 1 to 28 days, thus 28 values. The data set for the amplitude spectrum starting from 250 consists only of four samples because the maximum of the order quantity in the simulation was 294 pieces.
Table 6 shows the results of the Kruskal-Wallis test. The effect of the variables amplitude and period length on the output variable waste are shown separately for every network of the SC. A deep understanding of correlations as well as trends across the amplitude spectra can be derived. The amplitude seems to have the most impact on the generated waste within the first amplitude spectrum, as a stochastically dominance for at least one sample in the networks slaughterhouse, processing, wholesale and retail is identified. With further rising amplitudes a shift from rear to front networks, regarding their position in the SC, affected by the variable amplitude is seen. However, the influence on the output variable in general seems to decrease strongly.
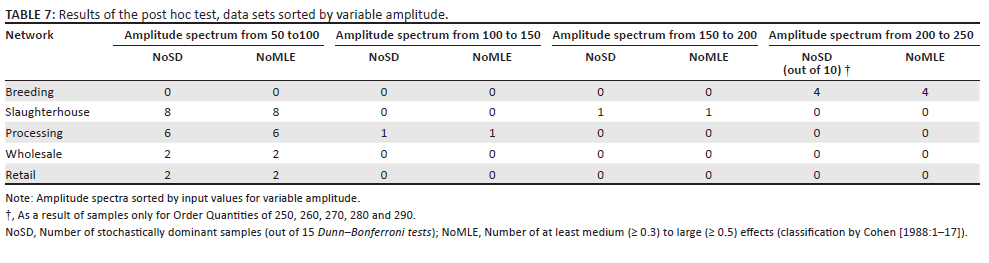
Firstly, the aim of the post hoc tests is to locate the stochastically dominance in the data set. It can be used to identify trends whether, for example, there are significant differences only between very high and low values of the variables or between all samples - in a chaotic pattern. Secondly, the exact number of significant differences is specified and furthermore, the intensity of each significant pairwise comparison is analysed, which helps to see how strong a correlation of the variables is. As the analysis where the significant stochastically dominance is located did not show any concrete pattern, they are not further considered in the evaluation of the post hoc tests.
Table 7 shows the results of the pairwise Dunn-Bonferroni tests analogue to the findings of the Kruskal-Wallis test, beside for an observed significance at the slaughterhouse for an amplitude spectrum from 200 to 250, which couldn't be confirmed with the post hoc test. It shows that the influence of the variable amplitude decreases with rising amplitude spectra. The only further statistical peculiarity observed is that the network breeding, which is not affected for amplitude spectra from 50 to 200, shows a relatively large sensitivity for a spectrum above 200.
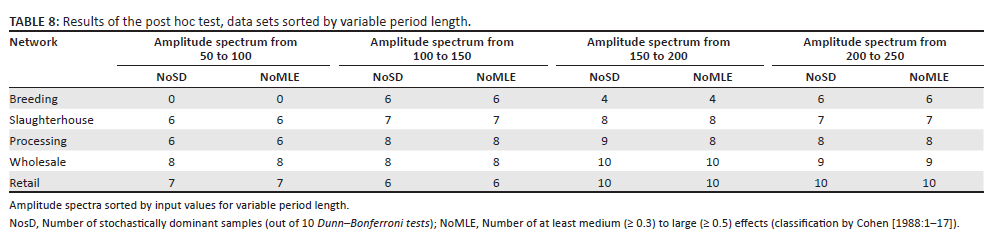
The post hoc tests for the variable period length (see Table 8) underline the findings shown in Table 6, with one exception for the network breeding at an amplitude spectrum of 100-150. With increasing amplitude spectra, the variable period length becomes more powerful to all networks, as seen by the Dunn-Bonferroni tests having at least medium to large statistical effects across all networks. Regarding the network breeding, as the leading link of the SC, for low amplitudes no impact of the period length was identified. However, for higher amplitude spectra the period length becomes more significant also for the network breeding. So far, it could be assumed that the period length has a larger effect to the output variable waste; however, to verify this assumption, further post hoc tests were carried out with other groupings, for example, starting with an amplitude of 50 increased in steps of 50 (up to 250). It was found that the number of stochastic dominant differences depends on the choice of grouping considered. The Kruskal-Wallis and the post hoc tests clearly show that both amplitude and period length influence the output variable waste. The general strength of their influence is further examined with the help of a multiple linear regression.
Regarding the theorem that first networks in the SC are more sensitive to the BWE, the results of the post hoc tests for different period lengths in Table 8 show a large sensitivity virtually across all networks, which thus would be controversial (Lee et al. 1997:546-558; Ran et al. 2020:1-28). A potential reason could be the sinusoidal stimulus of the SC dynamics instead of a punctual erratic stimulus, which provokes a complex reaction of the model.
It can be presumed that an increasing amplitude and period length have significant influence on the generation of waste, making furthermore the assumption of an interdependency between the both input variables probable. The statistically firm results are in line with the a priori-made assumptions described in Ran et al. (2020:1-28) and Lee et al. (1997:546-558). However, even though the rear networks include more stochastically dominant samples, the network slaughterhouse seems to be affected the most considering the absolute amount of waste generated (see Table 5).
The statistical analysis does not necessarily indicate if the correlation of the input variables amplitude and period length with the output variable waste is positive or negative. Therefore, to obtain a more detailed insight of the correlation of the input variables a multiple linear regression is conducted. However, as already described for the Kruskal-Wallis test, some preconditions for parametric analysis methods are violated, which is why the multiple regression can only be seen as a guide and further support for the already performed graphic and statistical interpretation. Furthermore, there is heteroskedasticity of the residuals in the multiple linear regression, which means that the variance of the residuals (of the dependent variable) is unequal. This makes the linear model for estimation less accurate. However, the increasing inequality of the residuals can probably be attributed to the fact that, on the one hand, the oscillation becomes stronger with increasing amplitude (see Figure 6) and, on the other hand, there is still a relatively strong oscillation at high period lengths (see Figure 7).
According to Frost (2018:1-35), the straight line b * xk + α thus models the expected value of the target variable  . Hence, it represents a regression line with an intercept α, a regression weight b and the freely selectable value of the amplitude or period length plotted on the x-axis xk:

The coefficient of determination (R2), which is always between 0 and 1 (0: no, 1: full prediction), indicates how well the selected independent variable (amplitude or period length) is able to predict the dependent variable. It can therefore be considered as measure of quality.
The multiple regression over the total results has shown that the amplitude has a strong positive influence on the waste with a regression weight factor of 6.09. In contrast, the period length has a negative influence with a factor of −2.84. In this analysis, with an R2 of 0.4197, a relatively good proportion of the waste can be attributed to the correlating input variables amplitude and period length. The regression follows the equation:

The equation shows that a longer period length is not responsible for a higher waste because of its estimated factor. This again confirms the hypothesis that a new steady state is reached after a certain stimulation period. For the variable amplitude a positive influence is attested, which is in accordance with the interpretations of Figure 6 and Figure 7. The strength of the influence, however, was not apparent from the statistical results of the Kruskal-Wallis test because the period length thereby was identified as the more decisive influencing factor.
Conclusion
The study contributes to a more holistic understanding of the bullwhip effect and in particular, its implications within a perishable food supply chain. More precisely, the aim was to gain insights about how the parameters amplitude and period length, which represent a parameterized bullwhip effect, correlate with each other and influence the generation of waste. The implications in general and especially on the individual SC levels are analysed and aligned with the state of research in the literature review.
They key results based on the analysis conducted and in particular Equation 3 and the regression weights described therein are:
1. The waste strongly increases with six times the amplitude of the stimulus.
2. An increasing period length calms down the generation of waste, the bullwhip effect declines. The waste decreases almost with 3 times the period length.
From the Kruskal-Wallis test, it can be derived that the variables amplitude and period length do have a significant influence on the output variable waste in almost every simulation scenario of the modelled FSC. The effects of both variables regarding stochastically dominance are indicated by the several test statistics of the pairwise Dunn-Bonferroni test. Further insights were gained by observing the results of the multiple regression. Presuming that an increasing amplitude and period length are causing higher amounts of waste, at this point it can be stated that this fits for the amplitude, however not for the period length. The analysis leads to the assumption that BWE has a time limit with regard to the generation of waste, that is, it does not increase continuously for an increasing duration of the stimulus. This assumption is further confirmed by the fact that this trend was also evident for very high amplitudes.
The BWE basically is attributed to a sudden increase in the order quantity (amplitude) over a certain period length, whereby the period length usually is very short. As the BWE has generally only been investigated for very short period lengths with a sudden increase in demand, the interdependence of the both input variables that has been demonstrated in this study requires further investigation in order to adequately take the complex interrelationships into account to derive proper SC management strategy. Furthermore, the tendential shift of sensitivity from the front to the rear networks, related to their position in the SC, opens up additional research potential.
The model in this article represents an FSC in a strongly refined form and can therefore only be regarded as a limited representation of a real-world SC. The passing on of the order quantities for the provocation of the bullwhip effect takes place by a linear connection of the networks. Other significant factors such as temporary restrictions of production capacities, supply shortages or failures, price fluctuations or rationing were not considered in this study in order to simplify the model as much as possible. This allows the correlations to be understood more easily, although these influencing factors will have to be added to the model in further development stages.
The REIF project evaluates and tests the approach of a central information platform that distributes all information about demand changes directly over all levels of the SC. Moreover, the aspired platform is going to consider more data, for example, production and price forecasting to provide fast and resilient responses to changes in demand. This approach can weaken the negative consequences of the BWE - economically and environmentally. Although in Wang and Disney (2016:691-701), it's already stated that information sharing cannot be a single approach to eliminate the BWE, an appropriate processing of data is key to conclude the first transformational steps in SC management. To evaluate this approach, it will be investigated by an evolved and adapted simulation model in a subsequent study.
Acknowledgements
Competing interests
The author(s) declare that they have no financial or personal relationship(s) that may have inappropriately influenced them in writing this article.
Authors' contributions
All authors contributed to the study conception and design. Literature review, modelling and coding and data collection were performed by D.R. The statistical analysis was conducted and discussed by D.R., M.Ö., H.B. and S.B. The first draft of the manuscript was written by D.R. All authors commented on previous versions of the manuscript. All authors read and approved the final manuscript.
Ethical considerations
This article followed all ethical standards for research without direct contact with human or animal subjects.
Funding information
The author(s) received no financial support for the research, authorship, and/or publication of this article.
Data availability
The data sets generated and analysed during this study are available from the corresponding author on reasonable request and only for scientific purposes.
Disclaimer
The views and opinions expressed in this article are those of the authors and do not necessarily reflect the official policy or position of any affiliated agency of the authors.
References
Bank, L., Roesch, M., Unterberger, E., Roth, S., Rohrer, A., Köberlein, J. et al., 2019, 'Comparison of simulation-based and optimization-based energy flexible production planning', Procedia CIRP 81, 294-299. https://doi.org/10.1016/j.procir.2019.03.051 [ Links ]
Brander, M., (2012), Greenhouse gases, CO2, CO2e, and carbon: What do all these terms mean?, Ecometrica, viewed 15 March 2022, from https://ecometrica.com/greenhouse-gases-co2-co2e-and-carbon-what-do-all-these-terms-mean/.
Cohen, J., 1988, Statistical power analysis for the behavioral sciences, 2 edn., pp. 1-17, Erlbaumpp, New York.
Draeger de Teran, T., 2014, 'Unser Planet auf dem Teller', in G. Hirschfelder, A. Ploeger, J. Rckert-John & G. Schönberger (eds.), Was der Mensch essen darf: Ökonomischer Zwang, ökologisches Gewissen und globale Konflikte, 1st edn., pp. 345-361, Springer VS, Wiesbaden.
Durán Peña, J.A., Ortiz Bas, Á. & Reyes Maldonado, N.M., 2021, 'Impact of bullwhip effect in quality and waste in perishable supply chain', Processes 9(7), 1232. https://doi.org/10.3390/pr9071232 [ Links ]
European Commission, 2020, Farm to fork strategy: For a fair, healthy and environment-tally-friendly food system, Directorate-General for Health and Food Safety, p. 2, viewed 06 February 2023, from https://eur-lex.europa.eu/resource.html?uri=cellar:ea0f9f73-9ab2-11ea-9d2d-01aa75ed71a1.0001.02/DOC_1&format=PDF.
Federal Ministry of Food and Agriculture (ed.), 2019, Nationale Strategie zur Reduzierung der Lebensmittelverschwendung, pp. 1-18, viewed 15 March 2022, from https://www.bmel.de/SharedDocs/Downloads/DE/_Ernaehrung/Lebensmittelverschwendung/ Nationale_Strategie_Lebensmittelverschwendung_2019.html.
Federal Office for Agriculture and Food (Hg.), 2022, Bericht zur Markt- und Versor-gungslage mit Fleisch, viewed 06 February 2023, from https://www.ble.de/SharedDocs/Downloads/DE/BZL/Daten-Berichte/Fleisch/2022BerichtFleisch.pdf?__blob=publicationFile&v=2.
Food and Agriculture Organization of the United Nations (ed.), 2019, Food outlook - Bian-nual report on global food markets, pp. 1-156, viewed 15 March 2022, from https://www.fao.org/documents/card/en/c/ca4526en/.
Forrester, J.W., 1958, 'Industrial dynamics: A major breakthrough for decision makers', Harvard Business Review 36(4), 37-66. https://doi.org/10.1007/978-3-642-27922-5_13 [ Links ]
Foster, C., Green, K., Bleda, M., Dewick, P., Evans, B., Flynn, A. et al., 2006, Environmental impacts of food production and consumption: Final report to the Department for Environment Food and Rural Affairs, Manchester Business School, London, pp. 1-198, viewed 15 March 2022, from https://agris.fao.org/agris-search/search.do?f=2013/GB/GB2013202500025.xml;GB2013202568.
Frost, I., 2018, Einfache lineare Regression, Springer Fachmedien Wiesbaden, pp. 1-36, Wiesbaden.
Hafner, G., Barabosz, J., Schneider, F., Lebersorger, S., Scherhaufer, S., Leverenz, D. et al., 2012, Ermittlung der weggeworfenen Lebensmittelmengen und Vorschläge zur Verminderung der Wegwerfrate bei Lebensmitteln in Deutschland, Universität Stuttgart, Institut für Siedlungswasserbau, Wassergüte- und Abfallwirtschaft, pp. 1-453, viewed 15 March 2022, from https://www.researchgate.net/publication/262728293_Ermittlung_der_weggeworfenen_Lebensmittelmengen_und _Vorschlage_zur_Verminderung_der_Wegwerfrate_bei_Lebensmitteln_in_Deutschland/references.
Hazra, A. & Gogtay, N., 2016, 'Biostatistics series module 3: Comparing groups: Numerical variables', Indian Journal of Dermatology 61(3), 251-260. https://doi.org/10.4103/0019-5154.182416 [ Links ]
Heinrich-Boell-Stiftung (ed.), (2021, January 1), Fleischatlas 2021: Daten und Fakten über Tiere als Nahrungsmittel, Heinrich-Boell-Stiftung, pp. 1-50, viewed 15 March 2022 from https://www.boell.de/sites/default/files/2021-01/Fleischatlas2021_0.pdf.
Hobbs, J.E., 2021, 'Food supply chain resilience and the COVID-19 pandemic: What have we learned?', Canadian Journal of Agricultural Economics/Revue canadienne d'agroeconomie 69(2), 189-196. https://doi.org/10.1111/cjag.12279 [ Links ]
Hoellthaler, G., Braunreuther, S. & Reinhart, G., 2019, 'Requirements for a methodology for the assessment and selection of technologies of digitalization for lean production systems', Procedia CIRP 79, 198-203. https://doi.org/10.1016/j.procir.2019.02.046 [ Links ]
Kloeber-Koch, J., Braunreuther, S. & Reinhart, G., 2017, 'Predictive production planning considering the operative risk in a manufacturing system', Procedia CIRP 63, 360-365. https://doi.org/10.1016/j.procir.2017.03.118 [ Links ]
Lee, H.L., Padmanabhan, V. & Whang, S., 1997, 'Information distortion in a supply chain: The bullwhip effect', Management Science 43(4), 546-558. https://doi.org/10.1287/mnsc.43.4.546 [ Links ]
Leverenz, D., Schneider, F., Schmidt, T., Hafner, G., Nevárez, Z. & Kranert, M., 2021, 'Food waste generation in Germany in the scope of european legal requirements for monitoring and reporting', Sustainability 13(12), 6616. https://doi.org/10.3390/su13126616 [ Links ]
Lischka, H.M., 2019, Marktorientierte Unternehmensführung und gesellschaftliche Verant-Wortung, Dissertation. Research [XXV], Springer Fachmedien Wiesbaden, pp. 1-271.
Loew, T. & Clausen, J., 2010, Wettbewerbsvorteile durch CSR. Eine Metastudie zu den Wett-bewerbsvorteilen von CSR und Empfehlungen zur Kommunikation an Unternehmen, Institute 4 Sus-tainability, Berlin, Hannover, pp. 1-37, viewed 15 March 2022, from https://www.borderstep.de/publikation/loew-t-clausen-j-2010-wettbewerbsvorteile-durch-csr-eine-metastudie-zu-den-wettbewerbsvorteilen-von-csr-und-empfehlungen-zur-kommunikation-unternehmen-berlin-hannover/.
Manning, L., Baines, R.N. & Chadd, S.A., 2006, 'Ethical modelling of the food supply chain', British Food Journal 108(5), 358-370. https://doi.org/10.1108/00070700610661330 [ Links ]
Mueller-Lindenlauf, M., Zipfel, G., Muench, J., Gärtner, S., Rettenmaier, N., Paulsch, D. et al., 2013, CO2-Fußabdruck und Umweltbilanz von Fleisch aus Baden-Württemberg: Endbericht; im Auftrag der Marketinggesellschaft Baden-Württemberg mbH (MBW), Heidelberg, pp. 1-60, viewed 15 March 2022, from https://www.ifeu.de/publikation/co2-fussabdruck-und-umweltbilanz-von-fleisch-aus-baden-wuerttemberg/.
Oliveira, J.B., Lima, R.S. & Montevechi, J.A.B., 2016, 'Perspectives and relationships in supply chain simulation: A systematic literature review', Simulation Modelling Practice and Theory 62, 166-191. https://doi.org/10.1016/j.simpat.2016.02.001 [ Links ]
Papier, F. & Thonemann, U., 2018, 'Supply chain management', in H. Tempelmeier (ed.), Begriff der Logistik, logistische Systeme und Prozesse, pp. 29-54, Springer Berlin Heidelberg, Heidelberg.
Ran, W., Wang, Y., Yang, L. & Liu, S., 2020, 'Coordination mechanism of supply chain considering the Bullwhip Effect under digital technologies', Mathematical Problems in Engineering 2020, 1-28. https://doi.org/10.1155/2020/3217927 [ Links ]
Resource-efficient, Economic and Intelligent Foodchain (REIF) - Projektueberblick, (2021), viewed 15 March 2022, from https://ki-reif.de/projektueberblick/.
Reinhardt, G., Gaertner, S. & Wagner, T., 2020, Ökologische Fußabdrücke von Lebensmitteln und Gerichten in Deutschland, pp. 1-22, viewed 15 March 2022, from https://www.ifeu.de/publikation/oekologische-fussabdruecke-von-lebensmitteln-und-gerichtenin-deutschland/.
Royte, E., (2016), How 'Ugly' fruits and vegetables can help solve world hunger, National Geographic, viewed 15 2022, from https://www.nationalgeographic.com/magazine/article/global-food-waste-statistics.
Santini, F. & Stein, A., 2021, 'The sustainability of "local" food: A review for policy-makers', Review of Agricultural, Food and Environmental Studies 103, 77-89. https://doi.org/10.1007/s41130-021-00148-w [ Links ]
Schmidt, T.G., Schneider, F. & Leverenz, D., 2019, Lebensmittelabfälle in Deutschland - Baseline 2015, Johann Heinrich von Thünen-Institut, pp. 1-79.
SFU Institut fuer Statistik, 2021, Die einfaktorielle Varianzanalyse für unabhängige Stich-proben und der Kruskal-Wallis-Test im psychotherapiewissenschaftlichen Kontext, pp. 68-86. Sigmund Freud Privatuniversitaet, Wien.
Singh, S., Kumar, R., Panchal, R. & Tiwari, M.K., 2021, 'Impact of COVID-19 on logistics systems and disruptions in food supply chain', International Journal of Production Research 59(7), 1993-2008. https://doi.org/10.1080/00207543.2020.1792000 [ Links ]
Tubiello, F.N., Karl, K., Flammini, A., Guetschow, J., Obli-Layrea, G., Conchedda, G. et al., 2021, 'Pre- and post-production processes along supply chains increasingly dominate GHG emissions from agri-food systems globally and in most countries', Earth System Science Data 14, 1-24. https://doi.org/10.5194/essd-2021-389 [ Links ]
Tundys, B. & Wiśniewski, T., 2020, 'Benefit optimization of short food supply chains for organic products: A simulation-based approach', Applied Sciences 10(8), 2783. https://doi.org/10.3390/app10082783 [ Links ]
VDI-Fachbereich Fabrikplanung und -betrieb, 1997, Selection of simulation tools - Scope of performance and distinguishing criteria, Beuth Verlag GmbH, VDI 3633 Blatt 4.
Wang, M., Kumar, V., Ruan, X., Saad, M., Garza-Reyes, J.A. & Kumar, A., 2021, 'Sustainability concerns on consumers' attitude towards short food supply chains: An empirical investigation', Operations Management Research 15, 76-92. https://doi.org/10.1007/s12063-021-00188-x [ Links ]
Wang, X. & Disney, S.M., 2016, 'The bullwhip effect: Progress, trends and directions', European Journal of Operational Research 250(3), 691-701. https://doi.org/10.1016/j.ejor.2015.07.022 [ Links ]
Wuehle, M. (Ed.), 2020, Sachbuch. Nachhaltigkeit - einfach praktisch!, 3 Auflage, Springer, pp. 1-255, Heidelberg.
 Correspondence:
David Rottenegger
david.rottenegger@hs-augsburg.de
Received: 22 Nov. 2022
Accepted: 22 Feb. 2023
Published: 30 Mar. 2023

