


Services on Demand
Article
 English (pdf)
 Article in xml format
 Article references
Indicators

Related links
-
 Cited by Google
 -
 Similars in Google
Share

 Permalink
South African Journal of Occupational Therapy
On-line version ISSN 2310-3833
Print version ISSN 0038-2337
S. Afr. j. occup. ther. vol.51 n.3 Pretoria Dec. 2021
http://dx.doi.org/10.17159/2310-3833/2021/vol51n3a2
SCIENTIFIC ARTICLES
Relevance of Norms and Psychometric Properties of Three Standardised Visual Perceptual Tests for Children Attending Mainstream Schools in Gauteng
Monique HarrisI, *; Denise FranzsenII; Patricia A. De WittIII
IBSc OT (Wits), MSc OT (Wits); Occupational Therapist, Lantern School, Krugersdorp, South Africa. http://orcid.org/0000-0002-9772-371X
IIBSc OT (Wits), MSc OT (Wits), DHT (UP) PhD (Wits). Sessional Senior Lecturer, Department of Occupational Therapy, School of Therapeutic Sciences, Faculty of Health Sciences, University of the Witwatersrand, Johannesburg, South Africa. http://orcid.org/0000-0001-8295-6329
IIIDOT (UP) MSc OT (Wits), PhD (Wits). Sessional Adjunct Professor, Department of Occupational Therapy, School of Therapeutic Sciences, Faculty of Health Sciences, University of the Witwatersrand, Johannesburg, South Africa. http://orcid.org/0000-0003-3612-0920
ABSTRACT
INTRODUCTION: Occupational therapists routinely assess children's visual perceptual and visual-motor integration skills. To determine visual perception and visual-motor integration dysfunction, occupational therapists use standardised visual perceptual assessment instruments. For accurate results, the norms used to evaluate the outcomes of the tests need to reflect the ability of the population on which they are used
This study aimed to determine the comparison of scores for a sample of 6 to 9 year old South African children attending schools in middle socio-economic urban areas, to American norms on standardised visual perceptual tests - the Test of Visual Perceptual Skills Third Edition (TVPS-3), the Developmental Test of Visual Perception - Third Edition (DTVP-3) and the Developmental Test of Visual-Motor integration - Sixth Edition (Beery VMI-6).
METHOD: A cross-sectional, quantitative design was utilised. Forty-eight children aged 6 years 0 months to 9 years 11 months participated in the study. The TVPS-3, DTVP-3 and Beery VMI-6 were administered to each participant as prescribed
RESULTS: The scores for the typical children fell within the American norms reported for all three tests. The DTVP-3, TVPS-3 and Beery VMI-6 were found to show little convergence in the scores but exhibited adequate internal consistency for the South African sample
CONCLUSION: The scores on the DTVP-3, TVPS-3 and Beery VMI-6 for South African children were similar to the American norms in identifying visual perceptual and VMI dysfunction and are suitable for use with children attending schools in a middle socio-economic urban area
Keywords: Visual perception, visual-motor integration, standardised tests, TVPS-3, DTVP-3, Beery VMI-6.
INTRODUCTION
Deficits in visual perceptual and visual-motor integration have been found to hinder a child's ability and independence in categories of occupation1,2. Various research studies have highlighted the impact of visual perception and visual-motor integration dysfunction on a child's scholastic skills, including handwriting, mathematics and reading skills, as well as executive function3,4. Visual perception and visual-motor integration dysfunction may also compromise a child's ability to complete activities of daily living, as children may find it challenging to dress independently when having to do up buttons or zips and tie shoelaces. In recreation and leisure activities a child with deficits in visual perception and visual-motor integration may find competing in games and sport and doing construction activities, such as building puzzles, difficult5.
In order to provide evidence-based measurement, paediatric occupational therapists have traditionally used a variety of norm-referenced standardised tests in their practice to evaluate and report on treatment outcomes for children with visual perception and visual-motor deficits6. The tests that are routinely used in occupational therapy to assess visual perceptual and visual-motor integration skills in school going children7-9, include the Developmental Test of Visual Perception Third Edition (DTVP-3)10, the Beery-Buktenica: Developmental Test of Visual-Motor Integration - Six Edition (Beery VMI-6)11 and the Test of Visual Perception skills -Third Edition (TVPS-3)12.
Therapy treatment goals, outcomes, and decisions about intervention in various occupational performance areas (including education) are based on all or part of the scores obtained from standardised tests. It is therefore desirable to ensure that these decisions are based on norms for visual perception and visual-motor integration skills that apply to South African children13. However, these tests have been standardised based on data from children in America to assess abilities. International research in Hong Kong, Thailand, China and Canada indicates that the use of these norms to interpret performance on the DTVP-3, Beery VMI-6 and TVPS-3 should be evaluated and cognisance taken of any differences in children in other countries or socioeconomic circumstances1,14-17. International researchers have suggested that standardised tests18, need to be validated in other settings and with different client groups before attempting to generalise the acquired results.
Published studies on the DTVP-3, Beery VMI-6, and TVPS-3 for children in South Africa are limited and restricted to specific age groups19,20 or older versions of the tests21-23. Therefore, it is not known if the present test norms for these tests are valid in identifying visual perception and visual-motor integration dysfunction for children in foundation phase education in this country. Other aspects of reliability have also not been established for these tests for South African children. This is concerning as therapists' confidence in the value of the tests to identify deficits is usually founded on the existing normative data for these tests13,14 Norm-referenced standardised tests, therefore, need to be evaluated to establish whether published norms are relevant in other specific contexts19,20,24,25.
LITERATURE REVIEW
Visual perception is considered a primary component in the development of cognition, acquiring new skills and many daily tasks5. Visual perception is assessed by considering two highly interrelated processes26, motor-reduced visual perception and motor-enhanced visual perception. Motor-reduced visual perception has been described as the capability of the brain to make meaning of and comprehend what the eyes see12. It involves the ability to perceive and notice forms, objects, colours and additional attributes, as well as the precise judgment of objects based on the length, breadth, shape and orientation in space27. Motor-enhanced visual perception is often referred to as visual-motor integration where hand movements are coordinated with eye movements in copying writing, typing and other activities requiring fine motor ability in conjunction with a visual perceptual component10.
Standardised tests, such as the TVPS-3, can be used to assess motor-reduced visual perceptual skills, while the VMI-6 includes motor-enhanced skills. The DTVP-3 has subtests, which assess both motor-reduced and motor-enhanced visual perception. Both the TVPS-3 and the DTVP-3 consist of subtests which address theoretical constructs of visual perception11. These constructs comprise the ability to: Orient the body in space and to discern the relative position of objects (spatial relations); distinguish the characteristics of different items such as colour and shape (visual discrimination); differentiate between objects in the foreground from those in the background (figure ground); recognise the entire shape when only segments of the object are presented (visual closure) and identify an object following a short time lapse (visual memory). Form constancy on the other hand, involves identifying the main features of forms even though the forms may be darker, lighter, larger, smaller, rotated, shaded or textured28. The scores for the subtests which assess these constructs are combined into overall scores for the TVPS-3 and the DTVP-3, while the VMI-6 provides one score for visual-motor integration with the possibility of adding scores from supplemental tests: a visual perception test that is motor-reduced and a motor co-ordination test that is motor-enhanced10-12. The authors of the Beery VMI-6 proposed various hypotheses to support elemental constructs; namely, chronological age, part-whole hierarchy, part-whole inter-correlations, intelligence, self-regulation and executive function as well as academic achievement, and all of these have been found to be useful predictors of scholastic performance4,29,30.
A standardised test has unvarying procedures for administration and scoring31. The use of standardised testing to assess visual perception has several advantages which include providing an objective score on which to base decisions about the need for therapy, evaluating the progress and determining the effectiveness of interventions32. However, although the results of standardised tests can be understood by a variety of professionals, these results are dependent on occupational therapists' ability to administer the test according to a prescribed procedure and their ability to interpret the findings according to the criteria described in the test manual. No deviation from these procedures should occur even when a child has difficulty understanding verbal instructions33.
Certain other factors such as fatigue, test anxiety as well as the unfamiliarity of the therapist, area and assessment materials, can also hamper a child's performance. The therapists must always be cognisant of any bias due to contextual differences in the population with whom the test is administered, as assessments developed mainly on a Caucasian class sample may not be valid when utilised with children from different cultural backgrounds32. In selecting a standardised assessment tool, occupational therapists need to examine the goal and purpose of the assessment. Assessments should either detail a learner's abilities and problem areas (descriptive measures) or predict which learners may be at risk for difficulties in the future (predictive measures). Lastly assessments should record progress learners are making over time (evaluative measures)33.
To correctly identify visual perception deficits among children, occupational therapists need to be confident that the standardised tests they use reflect the norms for the population they are assessing19,20,34. It has been proposed that the development of children from different backgrounds might take place in a different way and at a different rate; thus, the development of a child can be misinterpreted by applying strict age-related norms developed for another on all children33. In South Africa, statistics have shown that 6 out of 10 children were found to experience deprivation in terms of resources and facilitators to learning. This is supported by a study which concluded that pre-schoolers from diverse cultural groups had dissimilar VMI functioning29. Differences have been reported for the VMI-6 between the norms for children in the Canada, South Africa, India as well as China1,l7,35.
Results of research on South African children on the VMI-3 indicated scores lower than the USA norms for children from disadvantaged peri-urban areas. However significantly lower scores were only found for children in Grades 1 and 2 and not the higher grades21; as was confirmed by Coetzee29. in 2020. Another South African study published the norms of the DTVP-237 for an urban South African sample of 5-year-old pre-schoolers which indicated variation in the children's scores in relation to the norms published in the manual for children in the USA, particularly for visual closure, visual-motor speed and form constancy23. Futhermore, an additional South African study found that 5-year-old urban pre-school children had scores similar to the normative range in the manual on the DTVP-3 and VMI-6, while the scores for the TVPS-3 were lower. The figure ground subtest on the DTVP-3 and the form constancy and spatial relations subtests on the TVPS-3 had the lowest scores19.
Standardised tests thus need to have evidence of adequate validity and reliability for a given context to indicate whether appropriate and meaningful inferences can be concluded from the test scores36. While the validity of standardised tests is usually reported in the manual, indicating the extent to which an assessment battery accurately measures what it proposes to measure, the reliability or stability of scores reported may differ for various groups36. Convergent validity or the degree of correlation between tests of visual perception to establish if they measure the same constructs36 was considered in this study to establish if the three standardised tests assess similar constructs of visual perception. This study also focused on the internal consistency of the constituent items on the TVPS-3, DTVP-3, and Beery VMI-6. To establish the degree of agreement or commonality between items as a single concept or skill37, measuring the internal consistency of each test, Cronbach's alpha coefficients at or above 0.70 are satisfactory, and therapists administering standardised tests rely on these measurement properties as significant indicators of test accuracy, consistency and precision38.
Internationally, literature has addressed the validity and reliability of these standardised tests with research in Australia indicating that the DTVP-3 has adequate levels of internal consistency as well as moderate levels of convergent validity with that of the Beery VMI-614. Brown and Hockey39 supported the reliability of the TVPS-3 which was shown to have moderate convergent validity to the visual perceptual (VP) supplementary test of the 5th edition of the VMI test. McBain and Taub40 in 2019 reported, with the exception of form constancy, the motor-reduced subtests of the TVPS-3 and DTVP-3 were comparable. Occupational therapists therefore need to be knowledgeable about the origin of standardised tests, the reliability of results collected in the standardisation procedure and the validation method used to evaluate the tests41.
This study aimed to determine the relevance of the published norms in the test manuals, of the TVPS-3, DTVP-3, and the Beery VMI-6 for use with South African children by comparing the scores obtained by learners aged 6 years 0 months to 9 years 11 months attending mainstream schools, to the normative data for the USA sample. The effect of demographic variables on the test scores, the convergent validity of the three tests and the reliability of the tests in terms of the internal consistency of the constituent items, for this sample of learners, was also determined.
METHODOLOGY
Study design
A cross-sectional, quantitative design was utilised in this study.
Population and sampling
Foundation phase learners from Grade 1 to 3 between the ages of 6 years 0 months and 9 years 11 months were recruited for this study. Fee paying (quintile 4 and 5) mainstream schools in the West Rand region ofJohannesburg, Gauteng Province, located in an urban middle class setting, that fell within District 12, as determined by the Gauteng Department of Basic Education, were identified. The South African government classifies national schools into five quintiles for the allocation of financial assets42. Three of these schools were selected based on a total number of 360 potential learners in Grade 1 to 3 were identified in these schools. A sample size of approximately 48 learners was required to be representative of the 360 learners according to Cochran's sample size formula with a margin of error of 15% or alpha of 0.1543. The language of teaching and learning at all three schools were both Afrikaans and English.
For this study, a stratified sampling method of learners was used to ensure an equal distribution of learners across the four age ranges from 6 years 0 months to 9 years 11 months, with 12 learners assessed in each age group.
Measurement instruments
Developmental Test of Visual Perception - Third Edition (DTVP-3)
The DTVP-3 test battery consists of five sub-tests: two of which are motor-enhanced (eye-hand co-ordination and copying) and three which are motor-reduced (figure-ground perception, form constancy and visual closure). Test administration time is between 20 to 40 minutes10. All the subtests yield raw scores which can be changed into age equivalents, percentile ranks and scaled scores. The test battery was normed using a sample of 1,035 children in the USA10.
The reliability for the composite scores has a Cronbach's alpha of over 0.90, test-retest reliability ranging from 0.70 to 0.85 and an inter-scorer reliability that exceeded 0.9010. The validity of the DTVP-3 was proven using content-description procedures, criterion and construct identification procedures. For the content validity, selection of content, formats of the subtests and conventional items were reported based on Rasch analysis. The authors reported that the content of the DTVP-3 was substantiated by comparison to 12 test batteries that also evaluated visual perceptual abilities. Lastly, the authors made use of Differential Item Functioning (DIF) to determine that the subscale items were not prejudiced towards certain groups including gender, race, ethnicity and handedness10.
Test of Visual Perceptual Skills - Third Edition (TVPS-3)
The purpose of the TVPS-3 is to evaluate visual perceptual skills without the need for motor actions when making a response12. The TVPS-3 is divided into seven subtests. Subtests provide raw and scaled scores, including an overall score based on the sum of scaled sores. Composite scores are available for basic, sequencing and complex visual processes if the examiner wishes to use them. The administration time for the TVPS-3 is appropriately 30 minutes. The test was standardised on 2,008 children in the 38 states of the USA12.
The research on the reliability the TVPS-3 reported an internal consistency with Cronbach's alphas ranged from 0.75 to 0.88 for the subtests and 0.96 for the entire test. The test-retest reliability for the entire test is 0.97 while that for the subtests range from 0.34 to 0.81. The validity of the TVPS-3 was confirmed by content validity, criterion-related validity and construct validity. The items published in the TVPS-3 were assessed to determine the discrimination of items, as well as item bias reference12.
Beery-Buktenica: Developmental Test of Visual-Motor Integration - Sixth Edition (Beery VMI-6)
The function of the Beery VMI-6 is to evaluate the integration of visual perception with that of a motor action. The test consists of a series of geometric shapes that are copied onto a piece of paper using a pencil. The test is administered in 10 to 20 minutes for younger children who do not complete all the forms. The Beery VMI-6 has two additional supplemental non-obligatory tests for visual perception and motor coordination. The test has been revised on five occasions and standardised in America on over 11 000 children with the VMI-6 standardised on 1.737 children11.
The reliability of the Beery VMI-6 was assessed using, internal consistency, standard error of measurement, test-retest reliability and lastly the inter-scorer reliability. Rasch analysis was used in the evaluation of the content. The results showed high content reliability and person reliability with the overall group item separation being 1.00 and the overall group person separation being 0.96. The internal consistency using Cronbach's coefficient alpha was found to be 0.89 and the test-retest coefficient was reported as 0.88 and the inter-score reliability was reported as 0.9311.
The content validity of the Beery VMI-6 and its supplemental tests has been strongly substantiated. The Beery VMI-6 was correlated with the copying subtest of the Developmental Test of Visual perceptual (DTVP-2) and the Drawing subtest of the Wide Range Assessment of Visual-Motor Abilities with a moderately high result11.
Ethical considerations
Ethical clearance was obtained from the Human Ethics Research Committee at the University of the Witwatersrand (M140648). Permission for the study was received from the Gauteng Department of Education and the participating schools' principals. Information sheets were distributed to the parents/guardians. They were asked to sign an informed consent and complete a demographic form. The parents/guardians of any participant identified with a problem, were provided with feedback in the form of a report and information on services for further assessment and treatment provided. Each learner was asked to give assent to participate, before being individually assessed. The researcher used the authentic tests and scoring booklets to meet the copyright of the publishing companies.
Data collection
The assessments at the mainstream schools were conducted in the afternoon so as not to interfere with the academic programme. The testing was done in a quiet room, with each participant seated at an appropriately sized table and chair. The order in which the tests were presented was randomised to minimise the impact of test-order effect. Test order was randomised by making use of a random number generator and the order in which the tests were presented was listed in a table according to the code allocated for each participant. The tests were administered in the order dictated by this table and all completed assessments were placed in a box. The duration of all three of the assessments was approximately 60 to 90 minutes. A 5 to 10-minute break was given between the tests. The researcher followed the prescribed administration specifications of the instruments as stated in the various manuals10'11,12. The problem of inter-rater reliability was eliminated by the use of a single administrator. To ensure the confidential recording of results, the researcher scored the subtests and converted scores to scale and standard scores as well as composite quotients after the data collection period. The researcher utilised the correlating tables in each of the tests examiner's manuals to covert the raw scores of all the subtests to standard and scale scores for each of the three tests.
Data analysis
Demographic data were analysed using descriptive statistics including means and percentages. The participants' chronological age in years and months were computed and 15 days or more were rounded off to one month for consistency. This was required to determine the participants' scale and standard scores. Test raw scores were converted to mean scaled scores. Chi-squared tests were used to determine difference in the mean scores. The convergent validity of the overall and composite scores was determined using Pearson's R correlation coefficient. The Cronbach's alpha coefficient was utilised to establish the internal consistency of the constituent items of the tests. TIBCO Statistica® vl3.3 was used to analyse the data44.
RESULTS AND DISCUSSION
Demographics
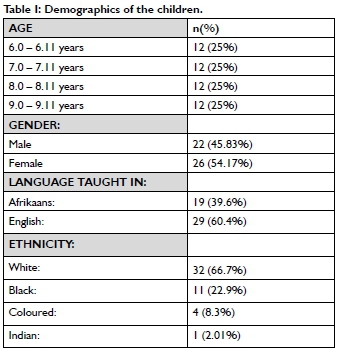
The sample consisted of 48 children between the ages of six and nine years, with 26 (54%) being female and 22 (46%) male. English was the most common language spoken by more than half the participants. A third of the participants were White (Table I, above).
The participants in this study represented various race groups but the distribution of participants was not an adequate representation of the profile of the different racial groups in the South African population. All the schools included in the study were fee paying schools, which cater for 46% of learners attending public schools in Gauteng45. In addition, schools included were located in a middle-class urban area and the results must be viewed as applicable to similar contexts in South Africa45.
Test of Visual Perceptual Skills - Third Edition (TVPS-3)
As indicated in Table II (p9) the overall mean standard score (SS) obtained by the South African children (l00.3l) were comparable to those of the American norms (l00) as reported in the manual. There was slightly less variance in the scores of the South African sample due to the small sample size and the standard deviation (SD) was l0.42 compared to the SD of 30 used for the TVPS-3 standardised test. The South African sample obtained a higher score for the spatial relations subtest (13.10) and lower scores for the visual discrimination (8.8l) and the form constancy (8.8l) subtests compared to the American subtest mean ofl0 in the manual. These scores were higher than those reported in another South African study. (Table II p 8).
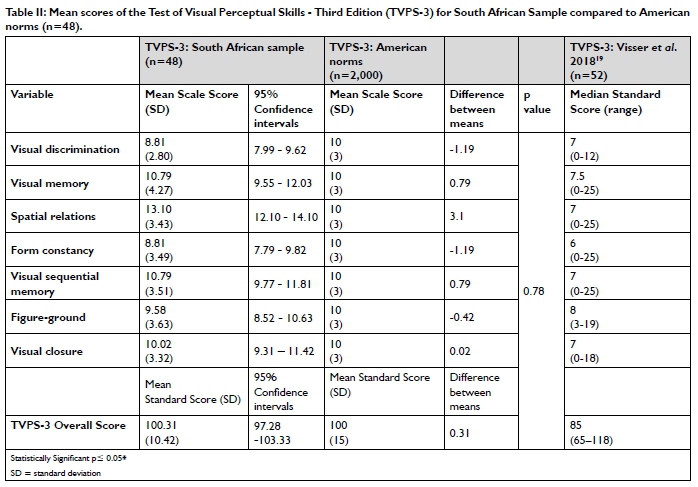
The results support the use of the USA TVPS-3 norms when assessing these South African learners aged 6 years 0 months to 9 years ll months. The TVPS-3 results indicate that there were differences in the mean scale scores of the South African participants for the spatial relations, visual discrimination, and form constancy subtests on the TVPS-3. The South African participants had higher mean scale scores on the spatial relations subtest but lower mean scale scores on the visual discrimination and form constancy sub-tests. Similar results were found in a study by Brown26 with Australian primary school learners who also obtained a higher mean scale score on the spatial relations subtest (13.24) and lower mean scale scores for visual discrimination (8.11) and visual form constancy (7.93)26. For younger preschool children in South Africa, Visser and Nel19 reported scores lower than the norms for all subtests (Table II) on the TVPS-3 including spatial relations, however in comparison to their results, which present median scores, their study also indicated below-average scores for form constancy19. These results confirm the differences reported in research for different subtests in various countries and it can be accepted that the ceilings for these subtests may not reflect the ability of the learners in South Africa. However, subtests scores recorded still fall within the normal range and do not indicate dysfunction in the South African learners.
The Developmental Test of Visual Perception - Third Edition (DTVP-3)
The scores obtained by the South African children were normally distributed except for the eye-hand co-ordination and copying subtests. The South African children obtained a higher score for the copying subtest (11.12) and lower scores for the eye-hand co-ordination (8.68) subtest compared to the American norms with a mean of 10. The composite scores of the South African children on the DTVP-3 had standard mean scores between 99.43 and 100.35 that were comparable with the American norms of 100 (Table III, p9).
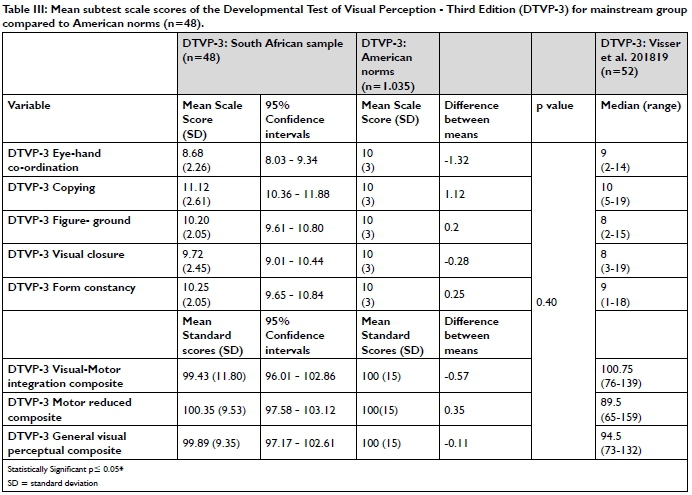
The mean scale scores of two subtests on the DTVP-3 were found to differ in the South African sample from those of the American norms: namely eye-hand co-ordination and copying. South African participants obtained a lower mean scale score for the eye-hand coordination subtest and a slightly higher mean scale score for the copying subtest, but these also fell within normal ISD of the USA norms. For younger preschool children in South Africa, Visser and Nel19 reported lower median scores for all subtests (Table III p 9) on the DTVP-3 with the exception of eye-hand coordination which they found to be similar to the American norms. They did however also report the highest median scoreI9 for the copying subtest. These results confirm that different subtests may not reflect the ability of the learners in South Africa. However, subtests scores recorded still fall within the normal range and indicate that South African learners in the sample in this study fall into a typical range for visual perception on in the DTVP-3.
The Developmental Test of Visual-Motor Integration -Six Edition (VMI-6)
The South African sample obtained a mean Standard Score of 90.47 for the Beery VMI-6 which was comparable to the mean of 100 for USA based norms. Again, there was less variance in the South African sample due to the small sample size with a SD below 30 as reported for the USA sample (Table IV p9). The results for the VMI-6 indicated that the mean scores for the South African sample are similar to the USA norms and as indicated in Table V to other South African studies.
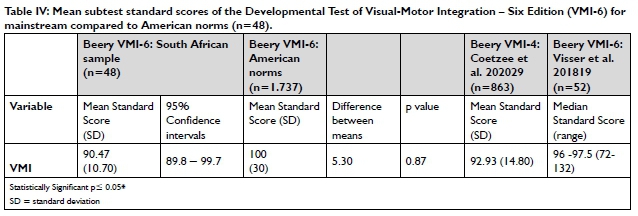
Thus, the ceilings in the manuals for the tests can be accepted as valid for this urban South African sample. When compared to other South African studies a similar standard score of 92.93 was reported by Coetzee et al29on a larger South African sample more representative of the ethnic groups in the country using the VMI-446. Their participants were Grade 3 and 4 learners (mean age 9.9 years) recruited from Quintile 1-5 schools in the North West province. They used pre-trained interpreters to give test results to the participants who did not have English as a home language29. In another study younger English and Afrikaans speaking preschool children obtained a median standard score of 96.0 and 97.5 on the VMI-6 respectively19. As with the current study their results also fell within the normative range of 85-115.
Differences in scores according to demographic factors
In this study there were no significant differences in the VMI-6 overall, and sub-test scores on the TVPS-3 and the DTVP-3 for age, gender or language. In terms of race, there were no significant differences, expect for the motor-reduced composite score on the DTVP-3 (p=0.0I2) and reflect very high scores for two participants for the visual closure and form constancy subtests which support the findings reported by Brown for a homogeneous middle-class sample in Australia14. As for other South African studies no significant differences were found for demographic factors and with the exception of the two outlying scores the mean scores fell within ±lSD of the USA norm scores. This indicates none of the learners would be identified as having dysfunction requiring intervention and the tests can be considered culture and ethnicity-free for this sample of learners. Therapists using the test should be aware of possible differences related to cut off points on the DTVP-3 visual closure and form constancy subtests.
Convergent validity of the TVPS-3, DTVP-3 and Beery VMI-6
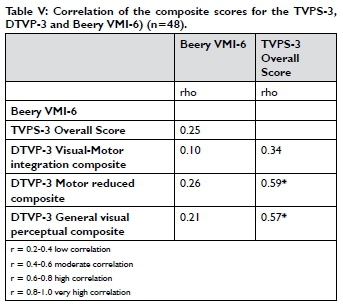
When the overall scores on the TVPS-3 and DTVP-3 were considered, a significant moderate correlation (r= 0.59) was found for the DTVP-3 motor-reduced composite and the general visual perceptual composite scores with the TVPS-3 overall score.
The correlation between the Beery VMI-6, TVPS-3 and DTVP-3 was low, as was the correlation between the DTVP-3 visual-Motor integration composite score and the TVPS-3 overall score. When correlations for the subtests were considered, these were all low except for visual closure on the TVPS-3 which had a significant moderate correlation with the visual closure subtest on the DTVP-3 (r=0.54) and the DTVP-3 motor-reduced composite (r= 0.50) and general visual perceptual composite (r= 0.49) scores (Table V above).
The convergent validity for the three tests in this study showed moderate correlation between the TVPS-3 overall score and the DTVP-3 motor reduced composite scores which supports by the findings of McBain and Taub40. This is not unexpected, as the TVPS-3 is a motor reduced test. The moderate correlation between the TVPS-3 overall score and the DTVP-3 general visual perceptual composite scores and the low correlation to the DTVP-3 visualmotor integration composite score could not be confirmed by other published studies. The findings do indicate the TVPS-3 and the DTVP-3 general visual perceptual section do measure similar constructs. When considering the subtests only the visual closure subtests of the TVPS-3 and DTVP-3 appear to measure this construct in the same way, with the scores for other similarly named tests such as figure-ground and form-constancy having a low correlation indicating different constructs appear to be measured.
No convergence was found in this study for the TVPS-3 overall scores as well as the DTVP-3 composite scores to the VMI-6. The lack of convergent validity between the TVPS-3 and the VMI-6 was not unexpected as the first assesses motor enhanced visual-motor integration and the latter motor-reduced visual perception. The results for the DTVP-3 and VMI-6 are similar to those reported in Australia by Brown14. Although theoretically the DTVP-3 visualmotor integration composite scores and the VMI-6 should measure similar constructs the lack of correlation between these tests, as indicated by Brown14 may be due to the lines the learners need to draw. These lines are continuous and in a narrow space on the DTVP-3 eye-hand coordination subscale, which may require more precision than the copying of shapes on the VMI-6. Lai and Leung47 also indicated that more visual perceptual skills may also be assessed in the DTVP-3 eye-hand coordination subtest.
It was assumed that the motor-enhanced Beery VMI-6 would not correlate with the motor-reduced component of the DTVP-3 and the results for this study confirmed those of Hammill et al.15 in the DTVP-3 manual for the DTVP-3 motor-reduced composite score and the Beery VMI 5th edition. These results differ to those of Brown14 who did report a significant moderate correlation between the Beery VMI-6 and the DTVP-3 motor-reduced composite score in an Australian sample of 6- to 8-year-old children. He attributed his findings to a lack heterogeneity in his sample, unlike the sample in the current study.
The internal consistency of the TVPS-3, DTVP-3 and Beery VMI-6
In table VI the internal consistency scores obtained for each variable were compared to those reported for each test in the test manual10,11,12. The Cronbach alpha scores for the South African children were similar to scores (0.76) in the manual for the TVPS-3, but were lower for the DTVP-3 and Beery VMI-6 (where scores over 0.80 and 0.90 were reported for both tests. (Table VI pII).

The Cronbach's alpha coefficients for this study were found to be within the acceptable ranges at greater than 0.7048, except for general visual perceptual on the DTVP-3. Various reasons are suggested for the potential discrepancies found between the Cronbach's alpha coefficients reported in the various test manuals and the Cronbach's alpha coefficients found in this study. The sample size in this study was based on a sample size of 48 participants in comparison to the thousands of children used in the standardisation of the three tests. Secondly, the variability of data should be taken into consideration. Thirdly, geographical location and ethnicity49 can affect the internal consistency of a test and the scores for certain subtests. Therefore, the verbal translation of Afrikaans instructions for the three tests could have changed the meaning of instructions influencing the internal consistency.
LIMITATIONS OF THE STUDY
This study included participants from the West Rand of Johannesburg, Gauteng. It therefore just represented one region of Johannesburg and one province in South Africa. The majority of participants in this study were from a middle-class urban area. The results can only be generalised to comparable South African populations.
The assessments took 60 to 90 minutes to complete, which may have challenged the participants' concentration ability since all three tests were done in one session. Furthermore, the tests were done after school when the participants' concentration was not always optimal.
The researcher felt even with re-explanation of some instructions that not all the participants were able to follow all the instructions. This occurred irrespective of the participants' home language and the language in which the instructions were given. As these tests were developed in the United States of America, the instructions are written in American English and some of the words in the instructions are unfamiliar to the South African learners. For example: in the TVPS-3 they referred to "designs" and in the DTVP-3 copying subtest 'figures' instead of shape/form/picture. The DTVP-3 form constancy instructions were also not very clear to participants. It asks, "Which of the drawings at the bottom are like the drawing at the top?" Even though the plural form drawings were used, participants often did not understand that there could be more than one correct answer.
It is important that a test instrument is accurately adapted or translated as it can influence the meaning and test difficulty limiting the validity50,51.
CONCLUSION
This study aimed to determine the relevance of American norms in interpreting scores on the TVPS-3, DTVP-3 and Beery VMI-6 for learners aged 6 years 0 months to 9 years II months attending schools from a middle class South African context in the Gauteng Province. The scores of the sample were compared to the normative data reported on USA samples in the test manuals.
Considering the results found in this study all three assessments of visual perception; the TVPS-3, DTVP-3 and Beery VMI-6 showed no significant differences in any of the composite scores between the American normative samples compared to a sample of South African learners. The study also considered the convergent validity of the three tests as well as the internal consistency for the sample of learners. In terms of the internal consistency, all three tests had adequate Cronbach's alpha coefficients of greater than 0.70 therefore exhibiting adequate levels of internal consistency for this sample of children. Minimal convergent validity was found between the TVPS-3, DTVP-3 and Beery VMI-6 with only moderate correlations between the subtests of visual closure and form constancy on the TVPS-3 and DTVP-3. No convergence was found between the Beery VMI-6 and the TVPS-3 and the DTVP-3 motor reduced composite scores. Therefore, if motor reduced visual perception is to be assessed, either the TVPS-3 or the DTVP-3 might be suitable. For motor enhanced visual perceptual assessment both the DTVP-3 and the Beery VMI-6 can be considered as suitable assessments.
CLINICAL RECOMMENDATIONS
The TVPS-3 assesses motor-reduced visual perceptual skills only. Even though the TVPS-3 gives a bit of background theory on visual perception, it did not provide reasoning as to how the assessment results can be related to therapeutic or scholastic purposesI2. Furthermore, the TVPS-3 also does not report how the assessment discriminates different skills52. An additional assessment needs to be conducted with this test in order to assess visual-motor integration abilities. Overall, the TVPS-3 challenged participant's concentration skills as they found the assessment very tiring and effortful12.
The DTVP-3 is able to assess both motor and visual perceptual abilities. Three composite test-scores can be obtained, namely: a visual-motor integration composite score, a motor-reduced composite score, and a visual-perceptual general composite score10. The participants were found to focus better when completing this assessment as this test alternates between motor and motor-reduced components. The DTVP-3 however, had several disadvantages. Therapists that want to make use of this assessment battery need to take note that there is no subtest to evaluate spatial perception skills as both the spatial relations and position in space subtests were omitted from the DTVP-310. Furthermore, the DTVP-3 has also been critiqued for having poor ecological validity. This is because the DTVP-3 has not considered coherent elements like human factors, the surroundings or conditions in which a person lives, and factors of activity participation10.
The Beery VMI-6 was found to be a valuable assessment battery in evaluating visual-motor integration skills11.
Since the sample in this study was chosen from a specific urban area with a middle-class income the results can only be generalised to comparable South African populations. Further research on a more representative sample of South African learners is required as socio-economic status and environmental conditions, have been shown to affect the performance on these tests.
CONFLICTS OF INTEREST
The authors declare no conflict in interest.
AUTHOR CONTRIBUTIONS
M Harris: Postgraduate student who conceptualised and completed the research, and contributed to the article. D Franzsen: Supervisor of project - data analysis and conceptualisation of results and discussion - conceptualisation and contribution to the article as well as editing of article. P de Witt: Conceptualisation and editing of the article.
REFERENCES
1. Coallier M, Rouleou N. Visual-Motor skills Performance on the Beery VMI: A Study of Canadian Kindergarten Children. The Open Journal of Occupational Therapy. 2014;2(2):1-10. doi: https://doi.org/10.15453/2168-6408.1074. [ Links ]
2. Sortor JM, Kulp MT. Are the results of the Beery-Buktenica developmental test of visual-motor integration and its subtests related to achievement test scores? Optomery and Visual Science. 2003;80(11):758-63. doi: https://doi.org/10.1097/00006324-200311000-00013. [ Links ]
3. Carlson AG, Rowe E, Curby TW. Disentangling fine motor skills' relations to academic achievement: the relative contributions of visual-spatial integration and visual-motor coordination. The Journal of Genetic Psychology. 2013;174(5):514-33. doi: https://doi.org/10.1080/00221325.2012.717122. [ Links ]
4. Kim H, Byers AI, Cameron CE, Brock LL, Cottone EA, Grissmer DW. Unique contributions of attentional control and visuomotor integration on concurrent teacher-reported classroom functioning in early elementary students. Early Childhood Research Quarterly. 2016;36(3rd Quarter ):379-90. doi: https://doi.org/10.1016/j.ecresq.2016.01.018. [ Links ]
5. Schneck CM. Occupational therapy for children. In: Case-Smith, O-Brien, editors. Occupational therapy for children. Missouri: Mosby Elsevier; 2010. p. 373. [ Links ]
6. Laverdure P, Stephenson P, McDonald M. Using the Occupational Therapy Practice Framework to Guide the evaluation process and make assessment choices in school practice. OT Practice. 2019;24(4):1-9. [ Links ]
7. Brown T, Rodger S, Brown A, Roever C. A comparison of Canadian and Australian paediatric occupational therapists. Occupational Therapy International. 2005;12(3):doi: https://doi.org/10.1002/otL2. [ Links ]
8. Burtner PA, Macmai MP Crowe TK. Survey of occupational therapy practitioners in southwestern schools: Assessment used and preparation of students for school-based practice. Physical and Occupational Therapy in Paediatrics. 2002;22(1):25-39. doi: https://doi.org/10.1080/J006v22n01_03. [ Links ]
9. van der Merwe J, Smit N, Vlok B. A survey to investigate how South African Occupational Therapists in private practice are assessing and treating poor handwriting in foundation phase learners: Part II-Treatment and evaluation practices. South African Journal of Occupational Therapy. 2011;41(3):11-7. [ Links ]
10. Hammill DD, Pearson NA, Voress JK. Developmental Test of Visual Perception-Third Edition. Texas: Pro-ed An International Publisher; 2014. [ Links ]
11. Beery KE, Beery NA. Beery VMI With Supplemental Developmental Tests of Visual Perception and Motor Coordination and Stepping Stones Age Norms From Birth to Age Six. Administration, Scoring and Teaching Manual. Bloomington, MN: Pearson; 2010. [ Links ]
12. Martin NA. Test of Visual Perceptual Skills-Third Edition Manual. Novato, CA: Academic Therapy Publications; 2006. [ Links ]
13. Brown T, Rodger S. Assessing occupation: the importance of using valid tests and measures. British Journal of Occupational Therapy. 2009;72(12):519. doi: https://doi.org/10.4276/030802209X12601857794655. [ Links ]
14. Brown T. Validity and Relaiblity of the Developmental Test of Visual Perception - Third Edition (DTVP-3). Occupational Therapy Health Care. 2016;30(3):.272-87. doi: https://doi.org/10.3109/07380577.2015.1136757. [ Links ]
15. Guntayuong C, Chinchai S, Pongsaksri M, Vittayakorn S. Determination of normative values of the Developmental Test of Visual Perception (DTVP-2) in Thai children. International Journal of Medicine and Pharmaceutical Sciences. 2013;3(2):113-26. [ Links ]
16. Hairol MI, Nordin N, P'ng J, Sharanjeet-Kaur S, Narayanasamy S, Mohd-Ali M, et al. Association between reduced visual-motor integration performance and socioeconomic factors among pre-school children in Malaysia: A cross-sectional study. PLOS ONE. 2021;16(3):e0246846. doi: https://doi.org/10.1371/journal.pone.0246846. [ Links ]
17. Tse LF, Siu AM, Li-Tsang CW. Performance on the Developmental Test of Visual-Motor Integration and its supplementary tests: Comparing Chinese and US kindergarten children. Journal of Occupational Therapy, Schools,and Early Intervention. 2017;10(4):408-19. doi: https://doi.org/10.1080/19411243.2017.1335263. [ Links ]
18. Brown T, Murdolo Y Developmental Test of Visual Perception - Third Edition (DTVP-3): A Review, Critique and Practice Implications. Journal of Occupational Therapy, Schools and Early Intervention. 2015;8(4):335-52. doi: https://doi.org/10.1080/19411243.2015.1108259. [ Links ]
19. Visser M, Nel M. Visual perception of five-year-old Afrikaans-speaking children in Bloemfontein using the Beery VMI-6, DTVP-3 and TVPS-3: A follow up study of their English-speaking counterparts in Bloemfontein. South African Journal of Occupational Therapy. 2018;48(3):31-43. doi: http://dx.doi.org/10.17159/2310-3833/2017/vo148n3a6. [ Links ]
20. Visser M, Nel R Jansen T, Kinmont L, Terblanché S, van Wyk J. Visual perception of five-year-old English-speaking children in Bloemfontein using the Beery VMI-6, DTVP-3 and TVPS-3. South African Journal of Occupational Therapy. 2017;47(2):17-26. doi: http://dx.doi.org/10.17159/231-3833/1017/v47n2a4. [ Links ]
21. Lotz L, Loxton H, Naidoo AV. Visual-motor integration functioning in a South African middle childhood sample. Journal of Child and Adolescent Mental Health. 2005;17(2):63-7. doi: https://doi.org/10.2989/17280580509486602. [ Links ]
22. Rens Z. The standardization of the Beery-Buktenica developmental test of visual-motor integration with supplemental developmental tests of visual perception and motor coordination (revised, 1997) on an Eastern Cape population aged 7 years 0 months to 7 years 3 months: University of the Witwatersrand; 2008. [ Links ]
23. Smith M, Visser MM, van Heerden R Raubenheimer J. Considerations when assessing urban South African children with the Developmental Test of Visual Perception 2nd edition (DTVP-2). South African Journal of Occupational Therapy. 2018;48(1):51-9. doi: http://dx.doi.org/10.17159/2310-3833/2017/vol48n1a9. [ Links ]
24. Cheung P, Poon M, Leung M, Wong R. The Developmental Test of Visual Perception-2 Normative Study on the Visual-Perceptual function for Children in Hong Kong. Physical and Occupational Therapy in Paediatrics. 2005;(4):29-43. doi: https://doi.org/10.1080/J006v25n04_03. [ Links ]
25. Patel A, Gajre M, Bhandarkar P Parlikar V Visual perception skill profile pattern in children with learning disorder. International Journal of Contemporary Pediatrics 2020; 7(9):1860-1863 doi: https://.org/10.18203/2349-329l.ijcp20203643. [ Links ]
26. Brown T. Are motor- free visual perceputal skill contructs predictive of visual-motor integration skill contructs? Hong-Kong Journal of Occupational Therapy. 2012;22(2):48-59. doi: https://doi.org/10.1016/j.hkjot.2012.06.003. [ Links ]
27. American Occupational Therapy Association. Occupational therapy practice framework: Domain and processes, 4th edition. American Journal of Occupational Therapy. 2020;74(Supplement_2), 7412410010p1-7412410010p87. https://doi.org/10.5014/ajot.2020.74S2001. [ Links ]
28. Gardner MF Test of Visual-perceptual Skills (non-motor) - Revised. San Francisco: Psychological and Educational publications; 1996. [ Links ]
29. Coetzee D, Pienaar AE, van Wyk Y Relationship between academic achievement, visual-motor integration, gender and socio-economic status: North-West Child Health Integrated with Learning and Development study. South African Journal of Childhood Education. 2020;10(1):1-11. doi: https://doi.org/10.4102/sajce.v10i1.646. [ Links ]
30. Verdine BN, Irwin CM, Golinkoff RM, Hirsh-Pasek K. Contributions of executive function and spatial skills to preschool mathematics achievement. Journal of Experimental Child Psychology. 2014;126(October):37-51. doi: https://doi.org/10.1016/j.jecp.2014.02.012 [ Links ]
31. Urbina S. Essentials of Psychological testing. Hoboken, NJ: Wiley; 2004. [ Links ]
32. Richardson PK. Use of standardized tests in pediatric practice. In: Case-Smith J, O'Brien J, editors. Occupational Therapy for Children. 6th ed. Maryland: Mosby, Elsevier; 20l3. p. 216-43. [ Links ]
33. Baum C, Dunn W, Law M. Measuring Occupational Performance: Supporting Best Practice In Occupational Therapy. Thorofare: Slack; 2005. [ Links ]
34. Lim C, Tan P Koh C, Koh E, Guo H, Yusoff N, et al. Beery-Buktenica Developmental Test of Visual-Motor Integration (Beery-VMI): lessons from exploration of cultural variations in visual-motor integration performance of preschoolers. Child: Care, Health and Development. 2015;41(2):213-21. doi: https://doi.org/10.1111/cch.12190. [ Links ]
35. Deepak VRS, Anbarasu D. Normative data of developmental test of visual motor integration for Chennai population. The Indian Journal of Occupational Therapy. 2020;52(3):90. doi: http://doi.org/10.4103/ijoth.ijoth_36_20. [ Links ]
36. Price PC, Jhangiani RS, Chiang I-CA. Reliability and validity of measurement. Research Methods in Psychology. 2015. doi: https://opentextbc.ca/researchmethods/chapter/reliability-and-validity-of-measurement/. [ Links ]
37. Crist P The psychometrics of standardised assessements. In: Hino-josa J, Kramer P Crist P editors. Evaluation: Obtaining and Interpreting Data. Rockville: American Occupational Therapy Association; 2010. p. 191. [ Links ]
38. Salvia J, Ysseldyke JE, Bolt S. Assessment in special and inclusive education. Boston: MA: Houghton Miffin; 2007. [ Links ]
39. Brown T, Hockey SC. The validity and reliability of Developmental Test of Visual Perception-2nd edition (DTVP-2). Physical and Occupational Therapy in Pediatrics. 2013;33(4):426-39. doi: https://doi.org/10.3109/01942638.2012.757573. [ Links ]
40. McBain M, Taub M. TVPS-3 vs. DTVP-3: A Comparison of the Non-Motor Components. American Academy of Optometry 2019. [ Links ]
41. Brown G, Rodger S, Davis A. Test of visual perceptual skills-revised: An overview and critique. Scandinavian Journal of Occupational Therapy. 2003;10(1):3-15. doi: https://doi.org/10.1080/11038120310004510. [ Links ]
42. Dass S, Rinquest A. Amended national norms and standards for school funding.Government notice no. 869. Pretoria: Government Printer: 2017. [ Links ]
43. Barlett J, Kotrlik J, Higgins C. Organizational research: Determining appropriate sample size in survey research appropriate sample size in survey research. Information technology, learning, and performance journal. 2001;19(1):43. [ Links ]
44. TIBCO® Data Science. Statistica. Statistica Tibco Software Inc. 20l8 [cited 2019 4]. May]. Available from: http://www.statsoft.com/Products/STATISTICA-Features. [ Links ]
45. Mtshali N. A little more money for no-fee schools, Johannesburg: IOL; 20l5 [cited 2020 16 March]. Available from: https://www.iol.co.za/news/south-africa/gauteng/a-little-more-money-for-no-fee-schools-. [ Links ]
46. Beery KE, Buktenica NA. The Beery-Buktenica developmental test of visualmotor integration: Administration, scoring and teaching manual, 4th ed. Parsippany: Modern Curriculum Press; 1997. [ Links ]
47. Lai MY, Leung FKS. Motor-reduced visual perceptual abilities and visual-motor integration abilities of Chinese learning children. Human Movement Science. 2012;31(5):1328-39. doi: https://doi.org/10.1016/j.humov.2011.12.003. [ Links ]
48. Tavakol M, Dennick R. Making sense of Cronbach's alpha. International Journal of Medical Education 2011; 2(1): 53. doi: https://dx.doi.org/10.5116%2Fijme.4dfb.8dfd. [ Links ]
49. Spiliotopoulou G. Relaibility reconsidered: Cronbach's alpha and paediatric assessment in occupational therapy. Australian Occupational Therapy Journal 2009; 56(3): 150-155. doi: https://doi.org/10.1111/j.1440-1630.2009.00785.x. [ Links ]
50. Methodological Advances in Cross-National Surveys of Educational Achievement. National Research Council; Board on International Comparative Studies in Education; Division of Behavioral and Social Sciences and Education; Board on Testing and Assessment; Center for Education. National Academies Press. USA, 2002. [ Links ]
51. Beauford JE, Nagashima Y Wu M-H. Using Translated Instruments In Research. Journal of College Teaching & Learning (TLC). Clute Institute; 2011 Jan 11;6(5). doi: http://dx.doi.org/10.19030/tlc.v6i5.1144. [ Links ]
52. Ackerman, P., Review of the Test of Visual Perceputal Skills - 3rd Edition. In: Spies, Carlson & Geisinger, eds. The eighteenth mental measurements yearbook. Lincoln: NE: Buros Institude of Mental Measurements, 2010 pp. 658-63. [ Links ]
* Monique Harris. Email: moniqueharris77@yahoo.com

