


Services on Demand
Article
 English (pdf)
 Article in xml format
 Article references
Indicators

Related links
-
 Cited by Google
 -
 Similars in Google
Share

 Permalink
South African Journal of Occupational Therapy
On-line version ISSN 2310-3833
Print version ISSN 0038-2337
S. Afr. j. occup. ther. vol.49 n.3 Pretoria Dec. 2019
http://dx.doi.org/10.17159/2310-3833/2019/vol49n3a4
SCIENTIFIC ARTICLES
Perceived occupational gaps among the Ugandan general population - a pilot study
Susanne GuidettiI; Matilda UtbultII; Julius KamwesigaIII; Gunilla ErikssonIV
IOT reg, PhD Karolinska Institute Senior Lecturer, Department of Neurobiology, Care Sciences and Society, Division of Occupational Therapy, Karolinska Institutet, Stockholm, Sweden. http://orcid.org/0000-0001-6878-6394
IIBSc, OT reg, (Karolinska Institutet) Occupational therapist at Stockholm County Council, Child and adolescent psychiatry (BUP) PRIMA BUP Botkyrka, Tomtbergavägen 2, 145 67 Norsborg, Sweden
IIIOT reg, PhD (Karolinska Institutet) Head of Uganda Allied Health Examinations Board, Kampala, Uganda http://orcid.org/0000-0002-4884-067X
IVOT reg, PhD (Karolinska Institutet) Affiliated researcher at Department of Neurobiology, Care Sciences and Society, Division of Occupational Therapy, Karolinska Institutet, Stockholm, Sweden and Associate Professor at Department of Neurosciences, Rehabiliation Medicine, Uppsala University, Uppsala, Sweden. http://orcid.org/0000-0002-5308-4821
ABSTRACT
PURPOSE: This study aimed at culturally adapting the Occupational Gaps Questionnaire and to describe gaps which may exist during participation in everyday occupations i.e. the discrepancy between what a person wants to do and what he or she actually does in everyday life, in a reference sample from an English-speaking population in Uganda and furthermore to explore differences in occupational gaps between the Ugandan and Swedish reference samples.
METHOD: A cross-sectional design was used and data were collected using the Occupational Gaps Questionnaire in four different districts in Uganda (n = 252). The Swedish representative sample included 771 people.
RESULTS: Occupational gaps were reported by 91% of the participants (mean=5.8; SD=3.9) in Uganda. The number of gaps per person was higher than in the Swedish sample. The most common gaps in the Ugandan sample were reported as Working (42%), Studying (37%) and Hobbies (35%) in comparison to Cleaning (29%), Sports (23%) Hobbies as well as Travelling for pleasure (20%) in the Swedish sample. Younger participants perceived significantly more gaps than older participants in both samples.
CONCLUSIONS: The majority of the participants perceived gaps, indicating that occupational gaps are perceived to a greater extent in Uganda.
Key words: Activities in daily living, participation in everyday occupations, assessment, culture, reference sample, self-report
INTRODUCTION
Participation in everyday occupations is considered to be an important goal for rehabilitation1. The focus in occupational therapy is to enable engagement and participation in occupations that have value and meaning for the individual. Participation is related to independence in daily activities, but also encompasses other important domains such as community life2 and has been found to have an important influence on health and well-being3. According to Kielhofner4, engagement in occupations is not limited to performing an activity, but also includes the subjective experience of the doing e.g. what the individual enjoys and values doing the activity and how he or she perceives the performance. According to Christiansen5, we become who we are through occupation. If occupation is key to a person's experience of identity, it is accordingly likely to be problematic when one cannot participate in the activities one wants or needs to do. Due to factors such as disability, there may be occupations that a person would like to engage in, but does not, and then an occupational gap might occur. An occupational gap is defined as a gap that occurs between what an individual wants to do and what he or she actually does6. The Occupational Gaps Questionnaire (OGQ) has been developed to measure how persons themselves perceive their participation in everyday occupations, meaning whether there is a difference in what a person wants to do and what he or she actually does in everyday life. Previous research, using the OGQ, has found a significant relationship between the extent of occupational gaps and perceived life satisfaction after an acquired brain injury7,8.
One way to better understand the findings from studies on participation in everyday occupations in different diagnostic groups could be to relate them to how reference groups from the general population report on or perceive their participation. A survey of a Swedish reference group (n=7II)9 showed that the median number of occupational gaps was three for the whole sample, with some differences depending on age - younger persons had more gaps. In comparison, research has shown that the reference group reported fewer gaps than the rehabilitation groups of people with pain and stress-related disorders10 and with strokeII .The existing information from the Swedish reference sample is continuously used for comparisons with different diagnostic groups to elucidate impact from illnesses/injuries on participation in everyday occupations.
The Swedish version of OGQ has been translated and culturally adapted into an Iranian (a Persian) version and proven to be valid for persons with acquired brain injury7. Presently, there is a lack of culturally adapted, psychometrically tested, patient-reported out-come measures for sub-Saharan African countries such as Uganda. So far, the perceived participation in everyday occupations that have been collected have not been explored in different settings, but this information is needed in the analysis of data on participation in everyday occupations collected in a study that included people who had had a stroke in Uganda12. There is no information on how participation in everyday occupations is perceived by people living in Uganda to use as a baseline for comparison with clients with various diagnoses. Therefore, the OGQ needed to go through a cultural adaptation to be used in the Ugandan context, and there was a need to conduct a study among the general population to establish a baseline. Therefore the aim of this study was to explore and describe the perceived participation in everyday occupations i.e. the discrepancy between what a person wants to do and what he or she actually does in everyday life, in a reference sample from the general English-speaking population in Uganda. Further, the occupational gaps were depicted in relation to age, sex, vocation and living environment, and the differences in occupational gaps between the reference samples in Sweden and Uganda were explored. The information gained from these two reference samples from two different cultures is of interest to understand and thereby depict cultural differences in perceived participation.
METHODS
Study context
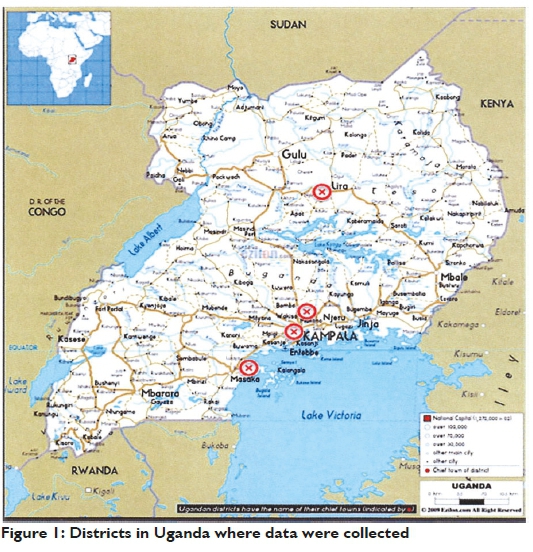
Uganda has a GDP of $1,226 per capita13, a population density of 152/km214, and an estimated total population of 34,856,813 persons according to the 2014 Uganda Bureau of Statistics, and the median age is 15 years. The population consists of many different ethnic groups that differ among themselves with regard to culture and language, according to the Uganda Bureau of Statistics, 2006. Only 16% of the Ugandan population live in urban areas15. The data in the present study were collected at eight different places in four different districts in Uganda - Kampala, Masaka and Wakiso in the Central Region, and Lira in the North Region. The geographic locations targeted for this study are shown in Figure 1 below:
Design
A cross-sectional design using a self-report questionnaire was employed for data collection.
Participants
The inclusion criteria were: 1) living in Uganda, 2) being 18 years or older, 3) literate, and 4) English-speaking. A convenience sampling method was used. Information was given both orally and in writing about the aim and methods of the study. Participation in the study was voluntary (responding to the OGQ Uganda questionnaire) and based on informed consent given verbally. Asking for written consent was due to practical reasons not asked for as data collection was conducted in busy areas such as market places.
Data collection
The data were collected between March 15 and April 24 2015, in the four different districts in Uganda shown on the map (Figure 1). The second author collected the data by approaching people in public areas. When the participants had given informed consent they received the self-report questionnaire, responded to it at the public place where they were approached by the data collector and after completion returned it to the data collector. Completion time for responding to the questionnaire was 5-7 minutes on average. Data collection was also conducted with assistance from Ugandan collaborators (students) who assisted the second author in finding participants from the rural areas. Due to a lack of logistical resources, 76% of the surveys were collected in Kampala. In order to explore the differences in occupational gaps between the reference sample data from the survey of a Swedish reference group (n = 77l) was used9.
Instrument
The Occupational Gaps Questionnaire (OGQ)9 is an instrument for measuring participation in everyday occupations, and has been found to be a valid generic instrument6,16 . The Rasch-analysis revealed that the OGQ demonstrates an acceptable person response validity and that it can separate at least two distinct groups with different levels of perceived occupational gaps, thus supporting its use as a screening tool16. The OGQ is a self-rating questionnaire consisting of 30 items (activities) in four areas: instrumental activities of daily living (IADL), leisure activities, social activities and work or work-related activi-ties9, where the individual considering each activity responds to two different yes/no questions: "Do you perform this activity?" and "Do you want to perform this activity?" If a person responds 'yes' to one of the two questions and 'no' to the other of the two questions, an occupational gap is recorded for that specific activity. There are therefore three possible outcomes for each activity: 'no gap', 'gap related to not wanting to do the activities one does ('not want to do-gaps'), and gap related to not doing the activities one wants to do (want to do-gaps). The latter two types of gaps have been treated equally in the analysis, i.e. both "not want to do-gaps" as well as "want to do-gaps" were considered as gaps, which was also the approach in previous studies9,l6, although there might be a difference in how the different types of gaps are perceived. The OGQ ends with two open questions with the objective to collect the experience of the occupational gaps perceived and which of the activities in which the person perceived a gap, was valued the most to gain information regarding the relative importance of gaps.
Cultural adaptation of the OGQ
The original Swedish OGQ questionnaire has been translated into an English version9. The English version of the OGQ was the basis for a cross-cultural adaptation to a Ugandan version (OGQ Uganda). The cultural adaptation process of the OGQ inspired by Beaton17 involved two occupational therapy student groups (n=20; n=18) and two occupational therapy teachers in Kampala who responded to the OGQ-English version. After the first student group (n=20) and the two teachers responded to the OGQ, the first and last authors sought to capture the students' and teachers' experiences of participating in everyday occupations in the Ugandan context. Cultural differences were discussed and suggestions for changes to the OGQ with the aim of designing a more culturally appropriate version, were given both orally and in writing. The discussion among the students and teachers was written down. The suggested changes were discussed between the first, third and last authors and the teachers, and this group agreed on deleting or merging items as well as adding examples and thereafter the changes were entered into the OGQ by the last author. An adapted draft version was once again responded to by a new student group (n=18) and occupational therapy teachers and discussed with these students and the two teachers in Kampala. New changes were suggested to the draft version, i.e. adding some examples and merging two items into one. The first, third and last authors agreed on making these new suggested changes and the questionnaire was revised by the last author, and the new (third) version, OGQ Uganda, was approved by the two teachers and used in the present study. The OGQ Uganda includes 22 items (shown in Table II on page 20). Some items from the English version were merged and culturally appropriate examples of activities were added. Psychometric properties of the OGQ Uganda will be examined when additional data collection with the instrument has been collected to allow for such an analysis.
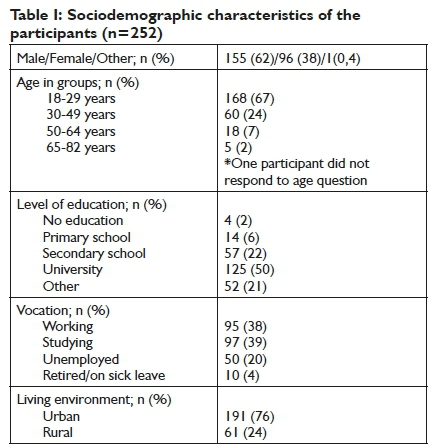
The OGQ Uganda was used for collecting the data. In addition, the participants were asked to answer sociodemographic questions, such as age, gender and vocation. The information letter to participants and the sociodemographic questions were developed in collaboration with Ugandan occupational therapists to avoid cultural clashes. The participants independently filled out the questionnaire, with the opportunity of asking questions.
Data analysis
Cross-tabulations were used to describe the sample and the presence of occupational gaps. Descriptive statistics were used to describe the characteristics of the participants in the study. Chi-square testing was used to analyse differences between groups for nominal or ordinal variables18. One-way ANOVA was used to analyse differences in the mean number of gaps depending on age18.
Ethical considerations
All participants were informed orally and in writing about the study and consented to participate. Anonymity of participants was ensured and maintained throughout. The study received ethical approval (SS 3740) from the Uganda National Council for Science and Technology (UNCST).
RESULTS
Approximately 320 persons were approached and asked for participation in the study in public places in four urban or rural areas in Uganda. A total of 252 participants were included in the study. The participants are presented in Table I. A small number of people (about 50) declined participation in the study when approached by the second author. The reasons given for not wanting to participate were usually that they were busy, waiting for someone or just leaving. Fifteen of the OGQ Uganda that were collected were too incomplete to be included in the study, mostly because only one of the two questions for each activity had been answered, making it impossible to analyse frequency of occupational gaps. The demographics of these excluded questionnaires did not differ from the rest of the sample with regard to age, gender, educational level or living environment.
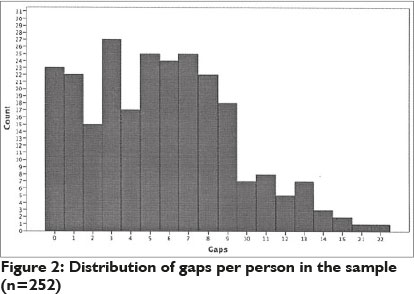
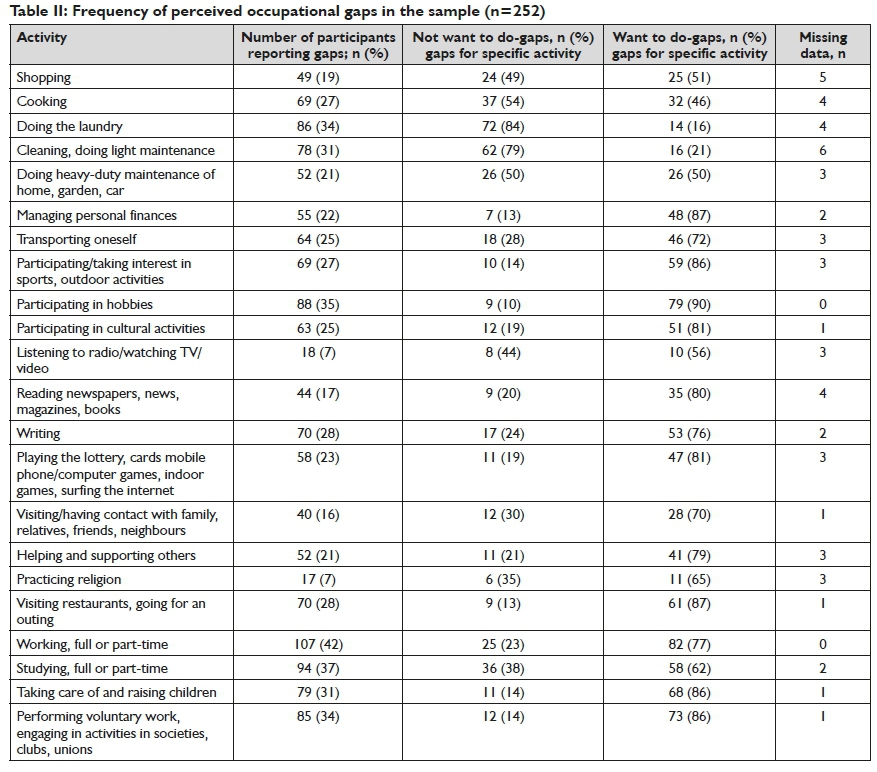
Perceived occupational gaps in the sample ranged between 0-22, and the mean number of occupational gaps was 5.8 (SD=3.9). The median number of gaps as well as the interquartile range was 5 gaps. 91% of participants perceived one or more occupational gaps. The five most common activities to have gaps in were working (42%), studying (37%), participating in hobbies (35%), doing the laundry (34%), and voluntary work (34%). Figure 2 below and Table II (page 20) present the frequency and distribution of the perceived occupational gaps in the sample.
Occupational gaps related to 'doing without wanting to do'
Thirty-two percent of the gaps reported were related to performing activities one did not want to perform (not want to do-gaps). The largest number of not want to do-gaps were doing the Laundry (29%), Cleaning (25%) and Cooking (15%).
Occupational gaps related to 'not doing the activities one wants to do'
Sixty eight percent of the gaps reported were related to not doing the activities one wants to do (want to do-gaps). The activities that had the largest number of want to do-gaps were Working (33%), Participating in hobbies (31%) and Performing voluntary work (29%).
Differences in perceived gaps depending on age
The data was sorted into four age groups - 18-29 (n=l68), 30-49 (n=60), 50-64 (n=18) and 65 years and up (n = 5). Although the participants aged over 50 were considerably fewer than the younger participants, a one-way ANOVA test showed that there was a statistically significant difference in the mean number of perceived gaps between the groups (p-value <0.001), where the younger participants had more gaps compared to the older participants. The mean number of gaps was higher for the younger groups; age group 18-29; (m=6, 25) and age group 30-49 (m=4, 75) and lower for the older participants; age group 50-64 (m=2, 94) and age group 65 and above (m=2, 2). A post-hoc test showed that the differences were statistically significant between the age groups l8-29 and 30-49 (p-value=0.045) and between the age groups 18-29 and 50-64 (p-value=0.003).
Differences in number of perceived gaps depending on sex
Chi-square testing showed that there was no significant difference in number of perceived gaps depending on sex in the sample (p-value=0.634). However, the most common activities to have gaps in had similarities but also differed between men and women. Working, Studying and Performing voluntary work were in the top five most common activities to have gaps in for both sexes. For women, the activities Doing the laundry and Taking care of and raising children, and for men, Participating in hobbies and Cooking, were also in the top five.
Differences in self-perceived gaps depending on living environment
Chi-square testing showed that there was no significant difference in the number of perceived gaps depending on living environment in the sample (p-value= 0.749). However, a non-significant difference was that the group of participants living in an urban environment had a mean of 5.82 gaps (SD=3.56), while the participants living in rural areas had a mean of 4.84 (SD=4.0l).
Differences in self-perceived gaps depending on vocation
There were few participants who reported that they were retired (n=7) or on sick leave (n=3), so for the Chi-square test of differences in number of gaps depending on vocation, those groups were combined with the group of unemployed. Chi-square testing showed that there was no significant difference (p-value 0,749) in number of gaps between those who were studying, those who were working and the group who were unemployed, retired or on sick leave. Of those participants who reported studying as their vocation, 27 % also reported that they did study, but did not want to.
Comparison of perceived occupational gaps in the Ugandan and Swedish representative samples
The Swedish sample was collected with a postal questionnaire9 and consisted of 771 participants of which 45% were women and aged between 20-85 years. In the total Swedish representative sample the median of perceived gaps was 3, with an interquartile range of 4. In the total Ugandan sample the median was 5, with an interquartile range of 5. The four most common activities with gaps in the Swedish representative sample were Cleaning (29%), Participating in sports (23%), Participating in hobbies (20%) and Travelling for pleasure (20%). In the Ugandan representative samples the most common gaps were in Working (42%), Studying (37%), Participating in hobbies (35%) and Doing the laundry (34%). Travelling for pleasure is one of the activities where the Swedish sample commonly had gaps. This item was not listed in the adapted OGQ Uganda as it was considered to be culturally inappropriate.
DISCUSSION
This study showed that a large number of participants (90%) experienced occupational gaps, and that there were differences in the number of gaps experienced depending on age, where the older participants perceived fewer gaps than the younger participants. There were few differences in reported gaps in the sample regarding sex, vocation and living environment. The mean number of occupational gaps was higher in the Ugandan sample compared with the Swedish sample. These results will be discussed below.
The most common activity to have gaps in for the whole sample was Working (42% of participants). Most of these gaps were related to wanting to work, but not doing it. Unemployment has been showed to be linked to many adverse health outcomesI9-2I, but this is not further explored in this study. The unemployment rate for the whole of Uganda was 9.2 percent in 2016/17. However, there was a big difference in unemployment rates between rural and urban areas, with a rate ofI4 % unemployed in urban areas in comparison to 6 % in rural areas according to the Uganda Bureau of Statistics 201822. Therefore, it can be discussed whether this finding might be different if more participants had been recruited in the rural areas.
The socio-demographic questions did not differentiate between different terms of employment, for example full or part time. The only options were: "Having a job (full-time/part-time)", "Studying", "Unemployed", "Retired" and "Sick leave". However, several participants marked if they worked full or part time, or commented on this to the data collector, and others wrote about not working the way that they wanted to in the qualitative questions, e.g. working part time with unsafe conditions and low salary. Differentiating between different ways of working - for example being self-employed, a housewife, being employed full time or part time - might have yielded interesting results.
The second most common activity to have gaps in was 'Studying' (37%). It is relevant to point out that the sample comprised 39% students, which might have affected the high frequency of perceived gaps in this activity. The education system in Uganda consists of primary, secondary and tertiary levels. Education at public primary and secondary schools is free23. There are also private schools with tuition fees, and many parents who can afford these choose to send their children to a private school, which might be because they believe that the education is of a higher quality23. Public tertiary education, such as university, involves fees. There is a significant difference in numbers between children who go to primary school and those who continue to secondary school. Very few young people make it to the tertiary level. UNESCO22 reported that the secondary school enrolment rate was 34% in 2007 for sub-Saharan Africa. This might be a part of the explanation behind the 'want to do-gaps', i.e. the participants who reported that they wanted to study but did not. However, 38% of the gaps were not want to do-gaps - participants who marked that they did study but did not want to. 27% of the participants who had studies as their vocation gave that answer. This could be an interesting field for future studies: the reasons for not wanting to study, and the reasons for doing it anyway.
Both working and studying are productive occupations4, and work is an important area within occupational therapy interven-tions24. Not being able or allowed to engage in wanted productive activities, such as those having occupational gaps in work or studying, affects an individual's roles, and the experience of having too few roles in everyday life can lead to problems with sense of self, meaningfulness, and structure in everyday life4.
The third most common activity to have gaps in was Participating in hobbies (35% of the participants). Of those reporting gaps in Participating in hobbies, 90% had want to do-gaps, participants who wanted to participate in hobbies, but did not. Hobbies are occupations we do for their own sake. Several studies have found associations between participation in leisure activities and positive outcomes such as self-perceived health and quality of life25-27. As one third of the English-speaking Ugandan sample had gaps and the majority of them were want to do-gaps in Participating in hobbies, one might assume that these gaps can affect the quality of life for these individuals.
There were significant differences between age groups in the sample - younger participants reported more gaps than older participants. These results correspond well with the results from the study of the Swedish general population, where the number of gaps was lower among older persons9. The most common activities to have gaps in varied between men and women, which is in line with a Canadian study on elderly persons without disability2. However, Working was a very common gap for both groups.
When comparing occupational gaps from the Ugandan sample and the Swedish sample, there were several differences. The Ugandan sample had more gaps per person (median = 5 compared to 3). The mean number of gaps in the Ugandan sample was 5.8. There are studies of Swedish patient groups where the mean number of gaps is lower than in the sample in the present study. In two studies of persons with stroke one year after onset, the mean number of gaps was 428 and 4.629, while in another study three months after onset of stroke the mean number of gaps was 7.9 while their significant others had a mean number of 3.9 gapsM . For a group of patients with musculoskeletal pain or stress-related ill health, the mean number of gaps was 8.7. The Swedish reference group in the same study had 0-I5 gaps, with a mean of 3.9310.
The results indicate that the Ugandan sample perceived more gaps than the Swedish reference sample, and even some Swedish groups with disabilities. The potential reasons for this are complex. All activities are performed in a complex environment, and the physical and socio-cultural surroundings affect the individual and their performance4. Class, gender, race, ethnicity, age and disability are examples that Sussenberger30 mentioned as socioeconomic factors that influence occupational performance and participation, with regard to productive as well as leisure activities. There is also a big difference between Swedish and Ugandan culture and the socio-economic situation varies, which might also affect the results in the studies. Culture is important for occupational therapists to take into consideration3I in order to be able to understand the client's activity patterns and preferences.
Methodological considerations and Limitations
This study provides new knowledge on perceived participation in everyday occupations in the Ugandan context. It also provided a starting point for use in health care and rehabilitation research with focus on participation after illnesses or injuries in two different cultural and socio-economic contexts. The results from the present study can further be considered in cross-cultural studies on everyday life situations for people with or without functional limitations. However, this study has several limitations with regard to external validity, i.e. generalisability, as the study sample differs in several ways from the population in Uganda. The Ugandan population is diverse regarding ethnic groups, and different ethnic groups are in the majority in different parts of the country. Because of that, data collection was performed in four different places in North and Central Uganda and in both rural and urban areas to achieve a spread of participants in various living environments. However, due to logistical limitations, most of the data was collected in urban areas. In the study sample, 76% lived in an urban environment. Only 16% of the Ugandan population live in urban areas15, so the study sample was not representative of the general population in this respect. The number of gaps in the item "Helping and supporting others" might have been higher if more people had been recruited from the rural areas as older relatives often still live out in the villages. The fact that the participants had to be literate and English-speaking also made the results in the study less generalis-able. According to the UNESCO Institute for Statistics32, literacy in the population above 15 years of age in Uganda was 76,53% in 2018, but among women over 65 years, it was only 26,31%. All these facts can impact the result in different ways, as for example the requirement of being literate and English-speaking might have resulted in a higher number of gaps in the item Studying than what might have been the case if the OGQ had been translated to the local language (Luganda). However, to get some information on the perceived participation in everyday occupations in Uganda, we considered it to be reasonable to settle with the sample from the different areas in Uganda that were easy to find and wanted to participate. This study is the first one trying to explore participation in everyday occupations in Uganda, but it shall be considered as a pilot study because of the identified limitations and further studies are needed.
One cultural clash experienced by the second author was the expectations of some participants to receive some kind of payment for their participation in the study. Participants in this study could keep the pen they used for filling in the questionnaire, but sometimes they expected more. In these situations, the data collector explained the aim and purpose of this study again. All participants were offered to have the finished report sent to them by e-mail. However, not all participants had access to the internet. This is an ethical problem, as participants who lack internet access are not able to read the results of the study.
CONCLUSION
A majority of the participants in the Ugandan sample perceived occupational gaps. Ninety-one percent of the participants perceived at least one gap, and the mean number of gaps per person was 5.8 (SD=3.9). The number of gaps per person was higher than in the Swedish representative sample, and even in some Swedish patient groups. The most common gaps were Working, Studying and Participating in hobbies. No significant difference in number of gaps regarding gender, vocation or living environment was found. However, younger participants perceived significantly more gaps compared to older participants. The results indicated that occupational gaps might be experienced to a greater extent in Uganda than in Sweden. More studies on participation in everyday occupations in Uganda are needed with a larger and more representative sample. Further, there is a need to understand the experience of having occupational gaps in Ugandan culture and to test the psychometric properties of the OGQ Uganda.
AUTHORS' CONTRIBUTION
• Susanne Guidetti contributed in the cultural adaptation of the instrument, and with support in data collection, application for ethical approval and manuscript writing.
• Matilda Utbult was instrumental in the data collection and data analysis and took part in manuscript writing.
• Julius Kamwesiga contributed to the cultural adaptation of the instrument, was instrumental in the process of applying for ethical approval, provided support during the data collection procedure and took part in the manuscript writing.
• Gunilla Eriksson developed the instrument and was responsible for the cultural adaptation of it, supported the data analysis and wrote the manuscript.
ACKNOWLEDGEMENTS
The authors would like to thank the Ugandan sample for being so willing to take part in the study, and the teachers and students on the Occupational Therapy programme for being involved in the process of developing the OGQ Uganda. This study was conducted within a project having support from the Swedish Research Council, Developmental Research [grant number 2014-28-63].
Disclosure statement
The authors report no conflicts of interest. The authors alone are responsible for the content and writing of the article.
REFERENCES
1. Law M. Participation in the occupations of everyday life. Am J Occup Ther. 2002; 56(6): 640-649. https://doi.org/10.50l4/ajot.56.6.640 [ Links ]
2. Desrosiers J, Robichaud L, Demers L, Gélinas I, Noreau L, Durand D. Comparison and correlates of participation in older adults without disabilities. Arch Gerontol Geriatr. 2009; 49 (3): 397-403. https://doi.org/10.10l6/j.archger.2008.12.006 [ Links ]
3. Law M, Steinwender S, Leclair L. Occupation, health and well-being. an J Occup Ther. 1998; 65(2): 8191 https://doi.org/10.1177/000841749806500204 [ Links ]
4. Kielhofner G. Model of Human Occupation: Theory and Application.4th Ed. Baltimore: Lippincott Williams & Wilkins; 2008. [ Links ]
5. Christiansen C H. Defining lives: Occupation as identity. An essay on competence, coherence, and the creation of meaning. Am J Occup her. 1999; 53(6): 547-558. [ Links ]
6. Eriksson G, Tham K, Borg J. Occupational gaps in everyday life l-4 years after acquired brain injury. J Rehab Med. 2006; 38(7): 159-165. https://doi.org/10.1080/165019705004l5322 [ Links ]
7. Eriksson G, Kottorp A, Borg J, Tham K. The relationship between occupational gaps in everyday life, depressive mood and life satisfaction after acquired brain injury. J Rehab Med. 2009; 41(3): 187-194. https://doi.org/10.2340/l6501977-0307 [ Links ]
8. Fallahpour M, Tham K, Joghataei MT, Eriksson G, Jonsson H. Occupational gaps in everyday life after stroke and the relation to aspects of functioning and perceived life satisfaction. OTJR. 2011; 31(4): 200-208. [ Links ]
9. Eriksson G. Occupational Gaps Questionnaire. Stockholm: Swedish Association of Occupational Therapists; 2014. https://doi.org/10.3928/15394492-20110513-01 [ Links ]
10. Eriksson T, Jonsson H, Tham K, Eriksson G. A comparison of perceived occupational gaps between people with stress-related ill health or musculoskeletal pain and a reference group. Scand J ccup Ther. 2012; 1(5): 41120. https://doi.org/10.3109/l1038l28.2011.620984 [ Links ]
11. Bergström AL, von Koch,L, Andersson M, Tham K, Eriksson G . articipation in everyday life and life satisfaction in persons with stroke and their caregivers 3-6 months after onset. J Rehab Med. 2015; 47(6): 508-515. https://doi.org/10.2340/l6501977-1964 [ Links ]
12. Kamwesiga J, Tham K, Guidetti S. Experiences of using mobile phones in everyday life among persons with stroke and their families in Uganda - a qualitative study. Disabil Rehabil. 2017; 39(5): 438-449. https://doi.org/10.3109/09638288.20l6.ll46354 [ Links ]
13. International Monetary Fund [Internet]. World Economic Outlook Database, 2014. [cited 2015 April 6].Available from: www.imf.org/external/pubs/ft/weo/2014/02/weodata/index.aspx. [ Links ]
14. Department of Economic and Social Affairs Population Division; 2008.World Population Prospects, Table A.l. 2008 revision. United Nations. [cited 2015 April 6]. Available from: www.un.org/esa/population/publications/wpp2008/wpp2008_text_Tables.pdf. [ Links ]
15. United Nations Statistics Division. World Statistics Pocketbook, 2014. United Nations: New York. [cited 2015 April 12]. Available from: http://unstats.un.org/unsd/pocketbook/WSPB2014.pdf [ Links ]
16. Eriksson G, Tham K, Kottorp A. A cross-diagnostic validation of an instrument measuring participation in everyday occupations: The Occupational Gaps Questionnaire (OGQ). Scand J Occup Ther. 2013;20(2): 152-160. https://doi.org/10.3109/l1038l28.2012.749944 [ Links ]
17. Beaton DE, Bombardier C, Guillemin F Ferraz MB. Guidelines for the process of cross-cultural adaptation of self-report measures. Spine. 2000; 25(24): 3186-3191. [ Links ]
18. Petrie A, Sabin C. Medical Statistics at a Glance.2.nd Ed. Malden, Mass: Blackwell Publ; 2005. [ Links ]
19. Jin RL, Shah CP Svoboda TJ. The impact of unemployment on health: a review of the evidence. CMAJ. 1995(5): 529-540. [ Links ]
20. Mathers C D, Schofield DJ. The health consequences of unemployment: the evidence. The Medical Journal of Australia. 1998; (4): 178-182. https://doi.org/10.5694/j.l326-5377.1998.tbl26776.x [ Links ]
21. Zagozdzon P Parszuto J, Wrotkowska M, Dydjow-Bendek D . Effect of unemployment on cardiovascular risk factors and mental health. Occup Med. 2014;64(6): 436-441.https://doi.org/10.1093/occmed/kqu044 [ Links ]
22. Uganda Bureau of Statistics 2018 Statistical Abstruact [cited 2019 November 7] Available from: https://www.ubos.org/wp-content/uploads/publications/05_2019STATISTICAL_ABSTRACT_2018.pdf [ Links ]
23. Asankha P Takashi, Y Impacts of Universal Secondary School Enrolments in Uganda. Journal of Accounting Finance and Economicsl. 2011; (1):16-30. [ Links ]
24. Fenton S, Gagnon f? Pitts D. Interventions to promote participation. Section I: work. In: Crepeau E B Cohn ES, Schell BAB,editors. Wil-lard and Spackman's Occupational Therapy 7th ed., Philadelphia: Lippincott Williams & Wilkins; 2003: 555-560. [ Links ]
25. Pressman S, Matthews K, Cohen S. Association of enjoyable leisure activities with psychological and physical well-being. Psychosomatic Medicine. 2009; 71(7): 725-32. https://doi.org/10.1097/PSY.0b0l3e318lad7978 [ Links ]
26. Nummela O, Sulander T, Rahkonen O, Uutela, A. Associations of self-rated health with different forms of leisure activities among ageing people. Int J Public Health. 2008; 53 (5): 227. [ Links ]
27. Lee JH, Lee JH, Park SH. Leisure Activity Participation as Predictor of Quality of Life in Korean Urban-dwelling Elderly. Occup Ther Int. 2014; 21(3): 124-132. https://doi.org/10.1002/oti.1371 [ Links ]
28. Eriksson G, Aasnes M, Tistad M, Guidetti S, von Koch L. Occupational Gaps in Everyday Life One Year After Stroke and the Association With Life Satisfaction and Impact of Stroke. Top Stroke Rehabil. 2012; 19(3): 244-255. https://doi.org/10.l310/tsr1903-244 [ Links ]
29. Bergström A, Guidetti S, Tistad M, von Koch L, Tham K, Eriksson G. Perceived occupational gaps one year after stroke - an explorative study. J Rehabil Med. 2012; 44(1): 36-42. https://doi.org/10.2340/l6501977-0892 [ Links ]
30. Sussenberger B. Socioeconomic factors and their influence on occupational performance. In: Crepeau EB, Cohn ES, Schell BAB, editors. Willard and Spackman's Occupational Therapy 7th ed., Philadelphia: Lippincott Williams & Wilkins; 2003: 97-110. [ Links ]
31. McGruder J. Culture, race, ethnicity, and other forms of human diversity in occupational therapy. In: Crepeau EB, Cohn ES, Schell BAB, editors, Willard and Spackman's Occupational Therapy 7th ed., Philadelphia: Lippincott Williams & Wilkins; 2003: 81-96. [ Links ]
32. Unesco Institute of Statistics. Education 2030 in Africa. Country profiles: Uganda. [cited 2019 November 9]. Available from: UNESCO Institute for Statistics. Profiles:https://www.sdg4education2030.org/unesco-institute-statistics-0 [ Links ]
 Correspondence:
Gunilla Eriksson
Email: Gunilla.eriksson@ki.se

