


Services on Demand
Article
 English (pdf)
 Article in xml format
 Article references
Indicators

Related links
-
 Cited by Google
 -
 Similars in Google
Share

 Permalink
South African Journal of Occupational Therapy
On-line version ISSN 2310-3833
Print version ISSN 0038-2337
S. Afr. j. occup. ther. vol.48 n.1 Pretoria Apr. 2018
http://dx.doi.org/10.17159/2310-3833/2017/vol48n1a8
SCIENTIFIC ARTICLES
Psychometric evaluation of the Quick Screening Procedure for referral to Occupational Therapy (QSPOT) for five year olds with and without barriers to learning
Lauren Jeannie VialI; Denise FranzsenII
IBSC OT (Wits), MSc OT (Wits). Postgraduate Student, Department of Occupational Therapy, School of Therapeutic Sciences, Faculty of Health Sciences, University of Witwatersrand; Private practitioner, Kempton Park, Gauteng
IIBSC OT (Wits), MSc OT (Wits), PhD (Wits) DHT (Pret). Senior Lecturer, Department of Occupational Therapy, School of Therapeutic Sciences, Faculty of Health Sciences, University of Witwatersrand
ABSTRACT
INTRODUCTION: Adjustments made to the Quick Screening Procedure for Referral to Occupational Therapy (QSPOT) required further validation of the test. This test which was developed in South Africa, is used to screen motor, praxis and sensory-perceptual performance skills related to intrinsic barriers to learning in 4 to 6 year old children.
METHOD: The aim of this study was to determine the known group discriminant validity and internal consistency of the QSPOT in identifying intrinsic barriers to learning in 5 year olds. The concurrent criterion validity of the QSPOT compared to the Movement ABC - 2nd Edition (MABC-2), and the Developmental Test of Visual-Motor Integration - 6th Edition (DtVMI-6) (Visual Motor Integration and Visual Perception subtests) as well as the accuracy of these tests were established. Seventy seven learners in mainstream schools and Learners with Special Education Needs (LSEN) schools were assessed with all three tests.
RESULTS/FINDINGS: In terms of accuracy acceptable specificity was found for the QSPOT; however, sensitivity was not at an adequate level and lower than for the MABC-2 and the DTVMI-VMI. Adequate concurrent criterion validity was found between the QSPOT Total Score and the MABC-2 Total Score, as well as between the QSPOT and the DTVMI-VMI for Age-band 1 (5 years 0 months to 5 years 5 months), but not for Age-band 2 (5 years 6 months to 5 years 11 months.
CONCLUSION: The QSPOT accurately identifies learners without barriers to learning, but may under-identify those with barriers to learning. Concurrent criterion validity of the QSPOT to the DTVMI-VMI and MABC-2 indicate that similar motor, praxis and sensory-perceptual performance skills deficits are identified within Age-band 1 but not for Age-band 2. In light of these findings revision of scoring and cut off criteria should be reviewed for certain items.
Key words: Intrinsic barriers to learning, motor and praxis performance skills, sensory-perceptual performance skills, screening, screening procedures, sensitivity, specificity, concurrent criterion validity.
INTRODUCTION
In 2009, the West Rand Occupational Therapists in Private Practice in Gauteng, South Africa, undertook to develop a screen assessment of intrinsic barriers to learning, related to client factors, motor and praxis performance skills, and sensory-perceptual performance skills for Grade 0 learners that could be administered and applied in the South African context. The Quick Screening Procedure for Referral to Occupational Therapy1,2 (QSPOT) was developed to screen learners between the ages of 4 years 0 months and 5 years 11 months. The QSPOT has undergone several changes dividing each age into two six-month age-bands with altered or added scoring for various tasks3, thus requiring further investigation for standardisation purposes. This paper reports on investigation for standardisation purposes for children 5 years 0 months to 5 years 5 months and 5 years 6 months to 5 years 11 months.
LITERATURE REVIEW
Barriers to learning are any number of hindrances that prevent a child from performing effectively in the educational occupational performance area4. The barriers may be internal or external, often only becoming apparent when learners show an inability to cope with or derive benefit from the learning process, which ultimately leads to school failure4,5. It is recognised that early and accurate detection of varying areas and levels of dysfunction within the learner, that hinder educational performance, is required to address barriers to learning timeously4,6.
To prevent delay in the identification of intrinsic barriers to learning, the South African Department of Education (DoE) has placed emphasis on the accurate assessment of appropriate performance skills of all learners in Grade 0 and Grade 157. The National Strategy on Screening, Identification, Assessment and Support (SIAS)7published by the DoE in 2008, provides guidelines for the screening, identification, formal assessment, and referral for appropriate intervention of learners with barriers to learning. According to this document7, all learners should be screened by early childhood development practitioners and health services before starting school, with at risk learners requiring further screening during the admission stages of Grade 0 and Grade 1. The DoE has authorised the use of mainly teacher-produced and teacher-completed checklists7, while the role of health practitioners, including occupational therapists, in screening within the SIAS process is unclear.
Research supports the use of assessment tools which are compiled by a panel of experts in the area of child development, many of which are completed by other individuals such as teachers and parents8-10. It is recognised that healthcare providers such as occupational therapists should be involved in the screening for barriers to learning before school-going age7,11, if not also at the Grade 0 and Grade 1 admission stage. This is in line with the scope of occupational therapy in educational performance, which includes the assessment of pre-academic areas of functioning such as motor and praxis, and sensory-perceptual performance skills. These skills include those involved in positioning the body, arms and hands to manipulate pencils and scissors as well as the directional changes in movement needed to copy shapes or cut on a line12-14. Muscle tone, eye-hand coordination and spatial skills are examples of client factors12 that are observed by occupational therapists in these tasks. Several standardised assessments15-17 are used by occupational therapists for the early identification of these pre-academic barriers to learning, but short valid screen assessments are needed for the screening children before more expensive extensive testing is done to identify specific problems.
Screen assessments contain a useful combination of various skills within a few items18, which should be familiar and culturally sensitive to the learners6,19. The screening results should indicate the necessity and type of comprehensive evaluation that is warranted6,11,20, thus ensuring the appropriate referral of only those learners who do require more in-depth assessment5,7. The validity, reliability, sensitivity and specificity of screen assessments need to be ensured in order for them to be considered evidence-based tools6,11,19. The investigations are not only to investigate the instrument's effectiveness, but also ensure that the occupational therapists using the test utilise and interpret its results appropriately, and the results are valid and reliable in identifying barriers to learning21.
PURPOSE OF THE STUDY
As part of a larger study, the purpose of this study was to determine the psychometric properties of the QSPOT for children aged 5 years to 5 years 11 months. This article reports on the accuracy of the QSPOT, the Movement Assessment Battery for Children - 2ndEdition (MABC-2) and the Beery-Buktenica Developmental Test of Visual-Motor Integration-6th Edition (DTVMI), for the visual-motor (DTVMI-VMI) and visual perception (DTVMI-VP) subtests as well as the and concurrent criterion validity between the QSPOT and the other two tests. Known group or discriminant validity was established for the QSPOT as well as the reliability in terms of internal consistency.
METHOD
This study used a quantitative non-experimental22, cross-sectional23, correlational22 research design. The sample consisted of learners between the age of 5 years and 5 years 11 months with and without barriers to learning. Once ethical clearance had been obtained from the Human Research Ethics Committee at the University of the Witwatersrand (MI207II), and approval of the study had been obtained from the Gauteng Department of Education (GDE), mainstream schools and schools for Learners with Special Educational Needs (LSEN) were approached in the Johannesburg area of Gauteng, to recruit a sample of learners. Permission was obtained from seven mainstream schools and eight LSEN schools who indicated that they had learners who suited the inclusion criteria, and permission to conduct the assessments was granted by the school principals. The mainstream participants were taken from a variety of independent and public suburban schools whereas only middle to upper class suburban schools were used to obtain participants for the LSEN sample.
A ratio of ten participants per item on the QSPOT was used to determine a sample size of 50 participants without barriers to learning attending mainstream schools, and 50 learners with barriers to learning attending LSEN schools. Learners were divided into two six-month age-bands as required by the QSPOT2,3, namely 5 years 0 months to 5 years 5 months (Age-band I), and 5 years 6 months to 5 years II months (Age-band 2).
Mainstream learners with a reported history of previous investigations and interventions for intrinsic barriers to learning were excluded, while learners at LSEN schools were included if they had definite or provisional diagnoses which resulted in intrinsic barriers to learning. Stratified sampling was used to ensure an equal number of male and female learners24 in each group.
Parent information sheets, informed consent forms and background questionnaires were distributed by the teachers in the mainstream schools to the parents of 67 learners for recruitment into the study. Informed consent was received for 50 learners; however, two were excluded due to illness and injury occurring between the test administrations, so the sample size was 48.
To recruit the LSEN group, 50 parent information sheets, informed consent forms and background questionnaires were given by the teachers to the parents of the learners selected for the study. Informed consent was obtained for 43 learners. The learners were recruited from a combination of LSEN and remedial schools, and learners who were in remedial classes in mainstream schools, due to a shortage of learners who met the inclusion criteria for the LSEN sample in LSEN schools alone. Some learners with physical impairments and intellectual impairments were therefore also recruited as learners presented with diagnoses or provisional diagnoses of Autism Spectrum Disorders (ASD), possible intellectual disabilities, hearing and speech impairment, ADHD and remedial difficulties. Four of these learners were subsequently eliminated due to difficulties in completing all the test items and 10 learners were excluded due to being in the incorrect age-group or withdrawal and refusal to participate. The remaining 29 learners were assessed for the study so the total sample consisted of 77 learners.
Instruments used
Quick Screening Procedure for Referral to Occupational Therapy (QSPOT)
The QSPOT has been designed to screen learners between the age of 4 years 0 months to 5 years II months for the presence of intrinsic barriers to learning1,3. The test meets the guidelines for the development of screening procedures, namely that they should be user-friendly with a short administration time6,11,19,20 and no lengthy standardised testing20. The QSPOT is a criterion-referenced test as learners are not compared to a normal sample, but are instead marked according to whether they are able to perform the specific skills or not21,25.
The QSPOT includes items which are divided into four tasks. Task I: Draw-a-person (DAP) / Visual Motor Integration (VMI), Task 2: Cutting, Task 3: Balance, Task 4: Catching. The tasks, which may contain one or more activity items, are used to screen body awareness, fine motor skills and visual motor perception. Task I: DAP/VMI is in the form of pencil-and-paper activities, namely drawing a person and copying shapes (horizontal and vertical lines, a cross, circle, square, triangle, a diagonal cross within a rectangle, and a diamond) from stimulus cards, followed by an added item in which the learner names the shapes. Task 2: Cutting contains a single activity item for cutting. Gross motor skills are screened using Task 3: Balance with a single activity item for static balance, and an additional descriptor for static balance with eyes closed, and Task 4: Catching, with a single activity item for catching1,3. Administration time is approximately I5 to 20 minutes3.
Each activity item has a number of descriptors or observations that are observed and scored while the learner completes the activity. One point is scored against each descriptor that was not achieved during the performance of the activity item and these scores are totalledI. Guidelines as to when to score against the descriptors are provided in the manual1. If the learner achieves the behaviour in the descriptor this is not scored so the QSPOT scores indicate areas of concern only.
Norms which should be achieved in each activity item for ages 3 years, 4 years, 5 years and 6 years are also provided on the score sheet. Failure to achieve the appropriate age norm for the activity item results in a three-point weighting being added to the corresponding total score recorded on the descriptors1, 2. A subtotal for each task item is obtained by adding the scores for descriptors and the three-point weighting if applicable. The subtotals of the tasks are added to provide a Total Score1,2.
In an initial pilot study in 2009, the content validity and some aspects of construct validity for the QSPOT2 was determined on a sample of 118 randomly-selected learners between the ages of 5 years 0 months and 5 years 11 months using the Rasch Analysis26. The results of the analysis showed, as expected, that a large majority of the learners scored in the normal range of functioning. The results also suggested that the QSPOT was able to discriminate between learners with barriers to learning, from those who are typically developing in terms of their learning and performance in the classroom2.
The Movement Assessment Battery for Children - 2ndEdition (MABC-2)8
For the purposes of determining the concurrent validity of the QSPOT in this study, only the motor skill test of the MABC-2 was used, which consisted of the Manual Dexterity Component, the Balance Component, and the Aiming and Catching Component. The MABC-2 was standardized on a sample of 1,172 children aged between 3 years 0 months to 16 years 11 months from the United Kingdom, which was stratified for gender, race, geographical location and level of parental education. Adequate reliability and validity are reported in the manual8. The MABC-2 has been found to have adequate cross-cultural validity for international populations8,27, and precise measurement capabilities28. It has also been widely used and cited in research studies conducted internationally27-29 and locally in South Africa30, including those that evaluate other checklists that identify deficits in motor skills9,30.
The Beery-Buktenica Developmental Test of Visual-Motor Integration - 6th Edition (DTVMI-VMI/VP)
The DTVMI-VMI31 assessment is a gold-standard for the assessment of visual-motor integration function. It is recognised as having adequate cross-cultural validity31-33, including predictive validity of academic performance in black South African learners from higher and lower socioeconomic backgrounds32. It has been historically used in research within South Africa33-36 and internationally37-39.
The test has been found to have adequate specificity (86%), but unacceptable sensitivity in identifying handwriting difficulties37. Adequate concurrent validity has been found with other tests assessing VMI31. Adequate relationships have also been found between the DTVMI-VMI, and the writing of individual letters38, copying sums and a written passage34, and educational performance areas of mathematics, reading and writing34.
Data collection procedures
Two research assistants were recruited to administer the MABC-2 and the DTVMI to participants, so that the researcher could be blinded to the learners' performance on those tests. The research assistants were occupational therapists with five and more years of experience in paediatrics, who either had further post-graduate training or experience in working as a tutor for a local university. Both research assistants were involved in assessing the learners in the mainstream group, while one aided in the data collection for the LSEN group. The research assistants were unfamiliar with and therefore practiced the administration of the MABC-2. For this reason the interrater reliability between the researcher and the two research assistants for a mainstream learner was determined and found to be 83% and 92%. The interrater reliability coefficient for the researcher and the research assistant who assisted with the LSEN group was 75% when assessing an LSEN learner which was higher than that required by Peersman et al (70%) when evaluating a motor skill checklist.
Since both research assistants were familiar with DTVMI, which has a reported interrater reliability of 93% for the DTVMI-VMI and 98% for the DTVMI-VP31 and the DTVMI-VMI was scored by the researcher, it was not necessary to established the interrater reliability of this test for the research assistants.
Verbal assent forms were completed by the teacher who witnessed each learner's assent to participate in both sets of assessments. The order in which the assessments would be administered to the participants was determined by using random number generation. The researcher and research assistant assessed learners concurrently in separate rooms when schools could accommodate them. When schools did not have sufficient space for this, the QSPOT was administered by the researcher on one day, while the MABC-2 and DTVMI-VMI/VP tests were administered by the research assistants on another day. There was no more than a three-day gap between the two assessment sessions in the mainstream group, and no more than a four-day gap existed between assessments in the LSEN group.
The researcher could not be blinded for all the assessments, as the research assistants were not available to complete all the MABC-2 and DTVMI assessments for the entire sample, and some of these assessments therefore had to be administered by the researcher. To reduce researcher bias, the researcher did not review any results from assessments before continuing with the outstanding assessments on the following day, and the researcher consistently scored each item of the standardised tests and the QSPOT according to their manual instructions.
Only the researcher scored the QSPOT, and she consulted with one of the authors of the QSPOT in order to ensure that the items for Task 1: DAP/VMI and Task 2: Cutting were being scored correctly. The research assistants scored the MABC-2 assessments as requested, as well as the DTVMI-VMI/VP subtests, and concerns in the scoring were discussed and corrections were made where necessary.
Data analysis
The assessment data were captured onto Microsoft Excel Spreadsheets. STATISTICA v 12.526 software was used to obtain descriptive statistical data for the total sample of learners and for the mainstream and LSEN groups respectively, and for the two age-bands. The medians, and lower and upper quartiles were also considered due to the ordinal nature of the data, and due to the data not being normally distributed. The levels of the negative skewness found were inclined towards 1.00 SD below that expected in the normal distribution on Task 1: DAP/VMI (-1.06; Lilliefors p < 0.01), Task 4: Catching (-1.65; Lilliefors p < 0.01) and the Total Score (-1.09; Lilliefors p < 0.01).
Sensitivity and specificity for the QSPOT as well as the reference tests, namely the MABC-28 and the DTVMI31, were calculated using a z score cut-off of -1.00 SD and less in the mainstream and LSEN groups using MedCalc® Statistical Software40. The z scores on the QSPOT were reversed to account for the fact that a lower score on this asssessment indicates better performance1. The value of 70% to indicate acceptable levels of sensitivity and specificity41 was used in this study. The values should be treated with caution as the prevalence of participants with intrinsic barriers to learning (n=29; 38%) is higher than the prevalence in South Africa, and the positive and negative predictive values could therefore not be included40.
To indicate discriminant validity, non-parametric statistics in the form of a Mann Whitney U test were used to determine statistical differences between the mainstream and LSEN groups. To determine concurrent criterion validity, the z scores for the QSPOT were correlated with the z scores from the MABC-2 and DTVMI-VMI/VP for all groups (n=77) and for each age-band using Spearman's Rank Order coefficients. Correlations of 0.60 and above are considered to be strong according to Kielhofner42, and were thus used to indicate acceptable validity in this study. The internal consistency of the QSPOT for this sample was determined using Cronbach's alpha.
RESULTS
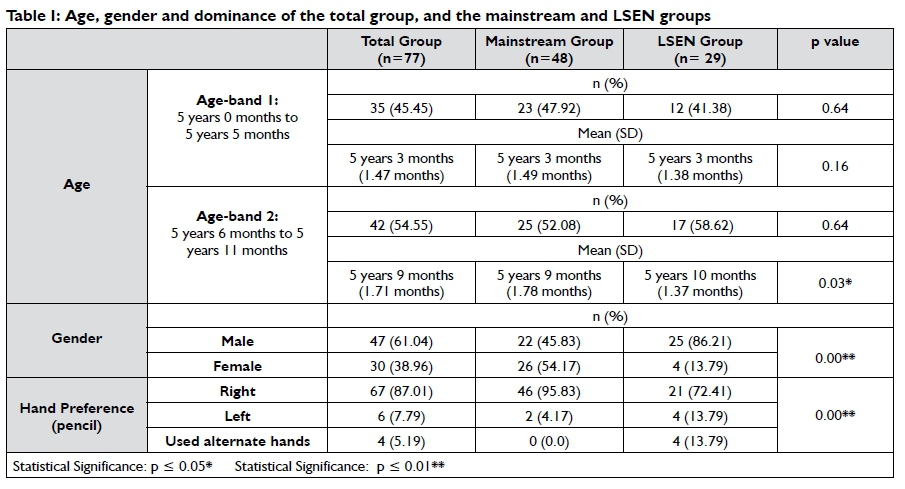
The total sample (n=77) consisted of 47 boys (61%) and 30 girls (39%). Age-band 1 consisted of 35 participants (45%) and Age-band 2 consisted of 42 participants (55%). The mean age of Age-band 1 was 5 years 3 months and the mean age of Age-band 2 was 5 years 9 months (Table I). The racial distribution was not stratified according to national statistics as the final sample consisted of 36 black (47%), 34 white (44%) and 7 Indian participants (9%). The mainstream and LSEN groups were comparable in terms of race as no statistical differences between the groups were noted. In the mainstream group, 96% of the participants had attended nursery school prior to starting formal education.
The only significant differences for a demographic variable between the mainstream group and the LSEN group were for gender (p=0.00), due to the fact that more boys were assessed (86%) in the LSEN group and age in Age-band 2. The Age-band 2 participants in the LSEN group were significantly older than those in the mainstream group (p=0.03) (Table I). Ninety-six percent of the mainstream participants used their right hands consistently to draw and cut out, while 72% of participants in the LSEN group used their right hand for drawing (Table I), and only 69% used their right hand for cutting. Participants who used both hands during the tasks, or who swapped hands between tasks, were only found in the LSEN group.
Accuracy - sensitivity and specificity
When considering the sensitivity and specificity of the MABC-2 for the total group (n = 77), good to acceptable specificity values above 70% were found for the Manual Dexterity Component, the Balance Component, the Aiming and Catching Component, and the Total Score. The DTVMI also presented with good specificity above 80% for the DTVMI-VMI and the DTVMI-VP (Table II on page 44).
Similar results were found specificity for all the items on the QSPOT with the specificity of Task 1: VMI, Task 2: Cutting, Task 3: Balance, Task 4: Catching, and the Total Score all being over 90% (Table II). This indicates with the negative likelihood ratios which were below 1.00 that the tests and test components identified the majority of participants without intrinsic barriers correctly. In contrast, unacceptable sensitivity was found for all components of the MABC-2, and the DTVMI-VMI and DTVMI-VP and all four task scores and Total Score of the QSPOT indicating that that some participants with difficulties may have been missed43,44.
Overall, on the QSPOT, between 94% to 100% of participants without dysfunction were identified with no intrinsic barriers to learning. Although the positive likelihood ratios over 1.00 indicate that the majority of those identified with barriers to learning on the tests should be assessed further. Only 35% to 59% of the participants with intrinsic barriers to learning were identified as having dysfunction using this test. These results were in line with the accuracy of the two standardised tests used in the study and the low sensitivity may be attributed to not all participants in the LSEN group having deficits related to body awareness, fine and gross motor skills and visual motor skills.
Known groups discriminant validity
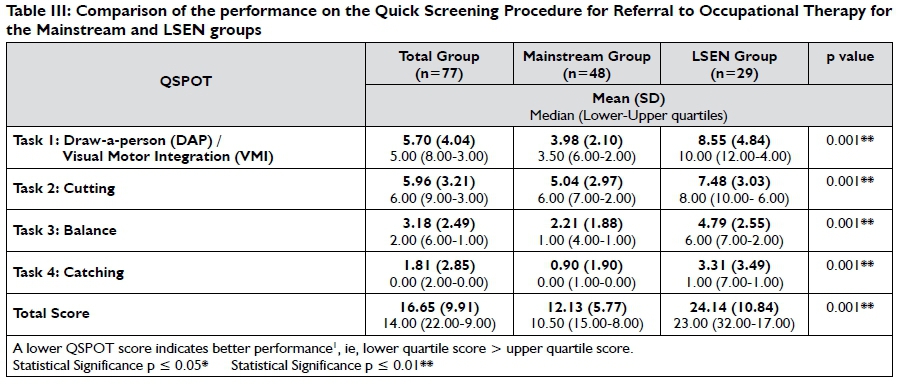
Known groups validity assesses the ability of a test to discriminate between two groups that are known to differ according to a specific variable45. There were highly significant statistical differences (p = 0.001) between the performance of the mainstream and LSEN groups on all four tasks and the Total Score of the QSPOT using the Mann Whitney U test (Table III on page 44). Therefore, the QSPOT was able to discriminate between the participants with dysfunction from those who were expected to perform appropriately within this sample.
Concurrent Criterion validity
Quick Screening Procedure for Referral to Occupational Therapy and the Movement ABC-2
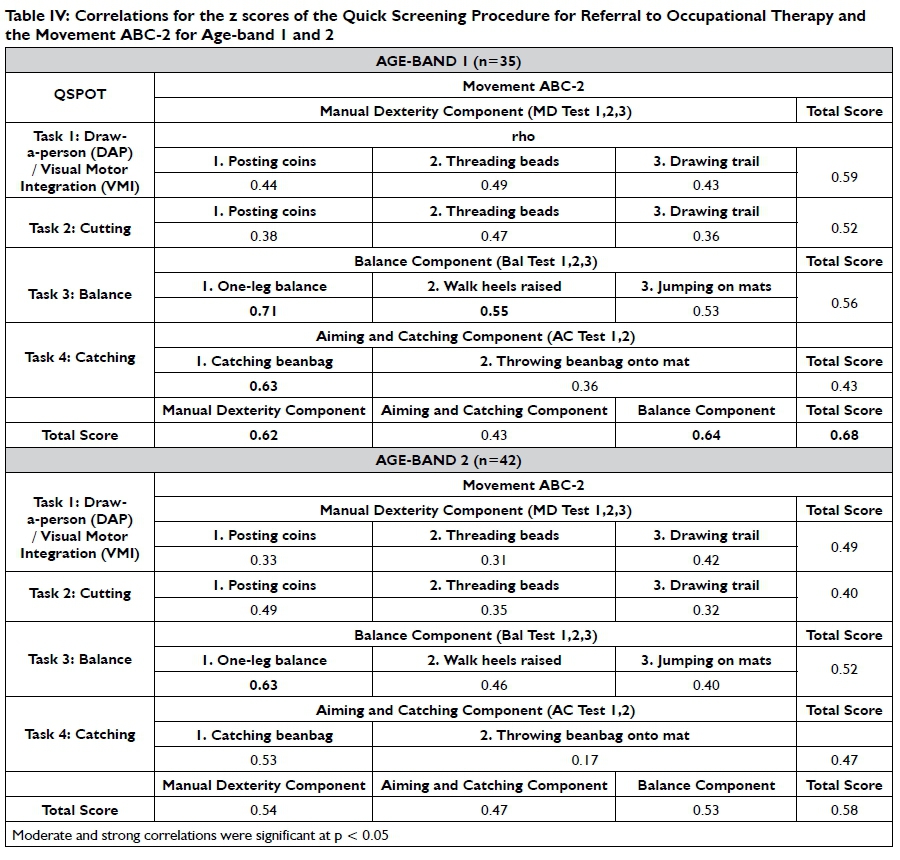
A strong correlation was found between the QSPOT Total Score and the MABC-2 Total Score (r=0.68) and the manual dexterity and balance components for Age-band 1 with only a moderate correlation (r=0.58) for all these components for Age-band 2. This indicates that the tests do measure similar components of fine and gross motor skills with the concurrent validity being better for Age-band 1.
Moderate correlations were found between the QSPOT-1 fine motor tasks (DAP/VMI) and the respective MABC-2 Manual Dexterity Component tasks which, involve unilateral and bilateral manual dexterity as well as drawing, for Age-band 1. A moderate correlation was found between Task 2: Cutting and the bilateral MABC-2 manual dexterity item of threading beads. Correlations between Task 2: Cutting and the remaining items of the MABC-2 Manual Dexterity Component were weak.
For Age-band 2 only moderate correlations were found for Task 1: DAP/VMI and the MABC-2 Manual Dexterity drawing trail, both of which involve drawing and VMI. A moderate correlation was found between Task 2: Cutting and the unilateral MABC-2 manual dexterity item of posting coins. Correlations between the two QSPOT fine motor tasks and the remaining items of the MABC-2 Manual Dexterity Component were weak (Table IV on page 45).
A strong correlation was found between the QSPOT Task 3: Balance and the MABC-2 one-leg balance item for both Age-bands (r=0.69). The correlation for the QSPOT Task 3: Balance and the MABC-2 one-leg balance item was strong, while only moderate correlations were found for the MABC-2 walking with heels raised and MABC-2 jumping on mats items. The correlation for the QSPOT Task 4: Catching and the MABC-2 catching task was strong, while the correlation for the MABC-2 throwing item was weak
Quick Screening Procedure for Referral to Occupational Therapy and the Developmental Test of Visual-Motor Integration
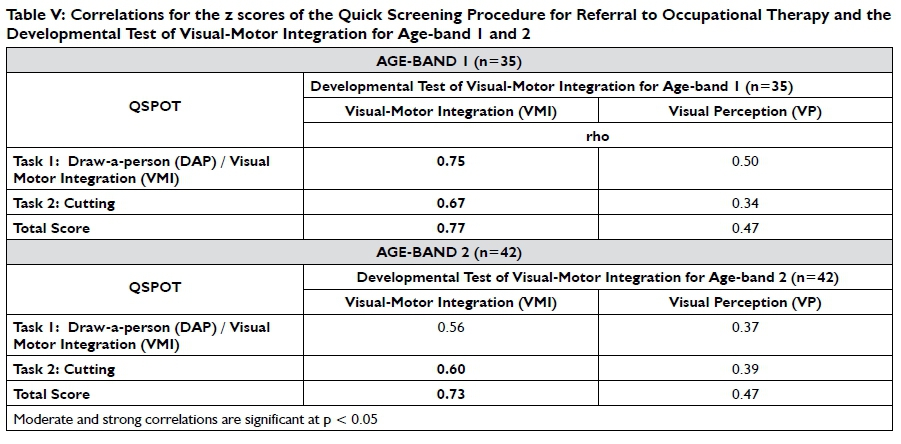
For Age-band I, strong correlations were found between the DTVMI-VMI and the QSPOT Task I: DAP/VMI with a lower moderate correlation for Age-band 2. A strong correlation was found between the DTVMI-VMI and QSPOT Task 2: Cutting for Age-band 1 and Age-band 2 (Table V on page 46).
Overall, the concurrent criterion validity between the QSPOT, and the MABC-2 and DTVMI-VMI/VP was lower for Age-band 2 compared to Age-band 1 with a weak correlation between the QSPOT Task 1: DAP/VMI and DTVMI- VP for Age-band 2, while that for Age-band 1 was moderate. The QSPOT Task 2: Cutting correlated weakly with the DTVMI- VP for both Age-bands indicating little relationship between cutting and visual perception.
Reliability
The Cronbach's alpha value for the QSPOT total test is 0.78, which shows acceptable internal consistency for the test using the total group. The QSPOT Task 1: DAP/VMI had the lowest internal consistency with an alpha value of 0.66. The other three tasks all had alpha values over 0. 7 which places them in an acceptable range45.
DISCUSSION
More boys were assessed in the LSEN group in this research study (Table I), resulting in support of the well-documented gender discrepancy in the population identified intrinsic barriers to learning. Two-thirds of children with learning disabilities across racial and ethnic groups are male46, and numerous studies on handwiring difficulties37, disorders in sensory integration47, Autism48, intellectual disabilities27,49, ADHD50 and DCD27, have also reported study samples that comprised of 60% boys or more.
More than 90% of the mainstream group showed a preference for their right hand, which is similar to the findings of de Milander et al51 for a sample of South African children. The higher percentage of participants with unestablished hand perference and left-handedness in the LSEN group which is congruent with reported intrinsic barriers to learning such as dyslexia52 and fine motor dysfunction52,53. Although de Milander et al51 found a 90% preference for the right foot in South African preschool children, 69% of the participants in this study stood on their left leg in the QSPORT Task3: Balance on-leg standing activity item with eyes open. This was supported by Peters54, who found that the supporting lower limb is often the non-preferred limb, and Forseth & Sigmundsson55 noted that typically developing children performed better on the non-preferred (left) leg in one-leg standing.
Based on a prevalence of approximately 38% for intrinsic barriers to learning due to the high number of participants with intrinsic barriers to learning in this study, low and unacceptable sensitivity scores were obtained for the QSPOT, MABC-2 and the DTVMI.
Less than 70 % of learners with intrinsic barriers to learning were identified by the MABC-2 and DTVMI, with less than 60 % of learners with intrinsic barriers to learning being identified with deficits related to fine and gross motor and visual-perceptual performance skills on the QSPOT (Table II).
This is a limitation of the study as participants recruited with different diagnoses may not present with the barriers to learning assessed by these tests. This is supported by the literature which indicates that skills may be affected in varying combinations and degrees depending on the learner's diagnosis or condition. For example, fine motor and gross motor dysfunction may appear singly or in combination, with greater dysfunction in either one, in some specific learning disabilities56,57, compared to children with intellectual disabilities who have been found to have greater fine motor impairment49, while children with sensory-integrative dyspraxia display motor and praxis, as well as sensory-perceptual performance skill deficits56,58.
This distribution of barriers to learning were evident in the LSEN group as indicated by the accuracy of all three tests, which were similar so it can be assumed that the QSPOT can be used to correctly screen learners without deficits related to body awareness, fine and gross motor skills and visual motor skills as a lack of these deficits was confirmed by the MABC-2 and DTVMI scores. The tests do not identify intrinsic barriers to learning in those in which these specific performance skills are not problematic. Also based on the nomogram for Bayes' theorem59,60; the positive likelihood ratio for the QSPOT Total Score (Table II) indicate that those learners who are identified with possible barriers to learning have a 90% probability of being at risk of having those difficulties, and they would therefore require further assessment to confirm the results.
Of the three tests, the sensitivity of the MABC-2 Total Score (59%), which was higher than the score of 41% reported in the study by Schoemaker et al29 and this test identified more participants with dysfunction than the DTVMI-VP (48%), the QSPOT Total Score (38%) and the DTVMI-VMI (31%). Therefore, it would appear that the QSPOT is screening for deficits in line with the DTVMI-VMI/VP and that the MABC-2 is sensitive to deficits not identified on the QSPOT, particularly more complex gross motor skills.
Overall, the specificity scores for all three tests with regard to fine and gross motor skills were above the minimum that is considered acceptable in research41,61, The QSPOT Total Score and the DTVMI-VMI identified more than 90% of participants without dysfunction in performance skills correctly while this was just above 80% for the DTVMI-VP and the MABC-2 Total Score (Table II). Other research indicates that , although the findings of specificity for the MABC-2 Total Score in this study were not as high as those found by Venter et al (97%)30, the specificity score for the MABC-2 Balance Component in this study was similar to that of 88% found by Venter et al30 on a South African sample of learners without intellectual or neuromotor dysfunction, which may indicate stability of the score in the South African context in eliminating dysfunction in balance.
Overall, the results indicate that the QSPOT, MABC-2 and DTVMI performed much better in ruling out dysfunction accurately with regard to the types of skills that these instruments are designed to assess. The negative likelihood ratios of less than 1.00 indicated that only 20% to 30% of learners without intrinsic barriers to learning assessed on the QSPOT have a probability of having difficulties in the motor and praxis and sensory-perceptual performance skills, despite achieving an adequate score.
However the discriminant validity results indicate that the mean and median scores for the QSPOT Task Scores and Total Score are highly significantly different for the mainstream and LSEN groups (Table III). The QSPOT was therefore able to discriminate the groups for intrinsic barriers to learning, indicating adequate known group validity. Therefore, all tasks and activity items on the QSPOT should be retained.
The lower mean scores on Task 3: Balance and Task 4: Catching indicate that the sample of participants in both groups had fewer deficits in their gross motor skills overall, compared to fine motor skills (Table III). However, this bias may also have resulted from teachers selecting participants based on the fine motor performance that is required for academic activities in the classroom, as well as possible difficulties in identifying deficits in gross motor skills that are not generally noted in the classroom29. This finding is supported by van Jaarsveld et al62, who found that South African learners from middle- to upper-class backgrounds (aged from 6 years 0 months to 8 years 0 months) performed better on static and dynamic balance, as well as bilateral coordination than American children.
When determining whether the QSPOT, MABC-2 and DTVMI-VMI/VP assess similar constructs in motor and praxis, and sensory-perceptual performance skills in 5 year old learners, the QSPOT Total Score showed a strong correlation with the DTVMI-VMI for both age-bands (Table V). A strong correlation to the MABC-2 Total Score was also obtained for Age-band I (Table IV), but this was not the case for Age-band 2, signifying lower concurrent criterion validity for the QSPOT for motor skills as assessed by the MABC-2 for Age-band 2. When considering the QSPOT Total Score and the MABC-2 Total Score, the coefficient of determination23 showed that 46% of the score on one test can be explained by the other test for Age-band I, compared to only 34% for Age-band 2. There was no difference in the coefficient of determination23 which was 22% for Age-bands I and 2 when the QSPOT Total Score and the DTVMI-VP For the DTVMI-VMI the coefficient of determination23with the QSPOT Total Score was 59% for Age-band I and 53% for Age band 2 indicating more than the score on one test can be explained by the other test.
Each item on the MABC-2 Manual Dexterity Component, when correlated with the QSPOT pencil-and-paper tasks, yielded moderate correlations for Age-band I, and slightly lower correlations for Age-band 2. Overall, the moderate and weak correlation results for fine motor skills indicate that different constructs of fine motor skills are being assessed. The QSPOT activity items of the DAP and copying shapes are fundamentally different from the MABC-2 drawing trail, as the DAP and VMI activity items require constructional praxis, due to the need to draw and assemble forms63.
The correlations found between the QSPOT Task I: DAP/VMI, and the MABC-2 posting coins and drawing trail items were lower for both age-bands than those cited in the MABC-2 manual8 for a DAP test and the same manual dexterity items of the MABC-2 (r=0.66). This could have been due to differences in scoring between the tests, and the inclusion of two different pencil-and-paper items within one task score on the QSPOT.
The moderate relationship between cutting on the QSPOT and the MABC-2 threading beads activity item in Age-band I, and the MABC-2 posting coins activity item in Age-band 2, was not unexpected as threading beads, cutting, and posting coins all require varying degrees of static-manipulative bilateral hand use and are also learned skills, with cutting being a more complex learned skill which requires more practice and consolidation of a variety of skills to achieve competence64. The correlations may have been affected by the fact that qualitative observations are not taken into account when scoring the MABC-2, but which do form part of the scoring in the QSPOT1,2; however, the scoring of both quantitative and qualitative information is considered a strength for accurate assessment25.
Strong correlations were obtained between the static balance items of the MABC-2 and QSPOT in both Age-band I and Age-band 2, In comparison, only obtained moderate correlations the MABC-2 activity items of walking with heels raised and jumping on mats, which are dynamic balance activities, were obtained with QSPOT Task 3: Balance, as this task does not assess dynamic balance. This may indicate a gap in the screening of balance in the QSPOT and indicates that Task 3: Balance may require the addition of a dynamic balance activity for Age-band 2, especially since various assessments8,16,65 that test gross motor skills in children, include both static and dynamic activities.
Fundamental differences in the structure and scoring of the Task 3: Balance and the MABC-2 one-leg balance item may have further affected the concurrent criterion validity for Age-band 2. Firstly, there are differences in the way in which a 5 year old is to position their arms in the respective tasks (on the hips during the QSPOT one-leg standing balance activity item1, compared to hanging freely for the MABC-28). Secondly, the MABC-28 allows for the assessment of each leg twice, thus enabling the learner's best performance to be measured. Thirdly, the cut off score of a minimum of ten seconds to pass the one-leg standing balance in the QSPOT was not different for Age-band I and Age-band 2 whereas eight seconds is sufficient to obtain an average score in the MABC-2 for this age band8. Therefore the time requirements for this activity need to be reviewed and the cut off requirements adjusted.
When considering the second type of gross motor skill assessed by the QSPOT, namely catching skills, the QSPOT only focuses on catching and not throwing which was reflected in the moderate and weak correlations with the MABC-2 for aiming and catching for Age-band I and Age-band 2 respectively. The correlation for catching skills was strong for Age-band I, but moderate for Age-band 2 (Table IV). Several differences in the manner in which catching skills are assessed by the MABC-2 and the QSPOT may have affected the results, such as the difference in distance between the learner and the assessor (two metres apart in the QSPOT1,2, compared to I.8 metres apart in a demarcated space for the MABC-28). Secondly, the minimum of four catches out of ten to obtain an average score in the MABC-28 is different to the minimum of six catches required in the QSPOT1,2. Thirdly, the MABC-28 has strict criteria for what constitutes an adequate catch in the hand, compared to the QSPOT1,2 which recognizes that some 5 year olds may still catch with their hands against their chests. The need to adjust the cut off requirements for the QSPOT as well as some descriptors to recognise relevant developmental levels is therefore recommended. Finally, the difference in the use of qualitative observations in scoring between the two instruments may have also affected the results.
As expected, a strong correlation was indeed obtained between the pencil-and-paper tasks of the QSPOT and the DTVMI-VMI for Age-band I (Table V), and the correlation obtained was the same as that between the DTVP-2 and the DTVMI-VMI (r=0.75) that is reported in the DTVMI manual^. Therefore, the concurrent criterion validity of the QSPOT for visual-motor sensory-perceptual performance skills, such as that used in drawing a person and copying shapes, was adequate and above the minimum prescribed for the purpose of this study. The strong correlation obtained between Task I: DAP/VMI and the DTVMI-VMI supported the study by Lotz et al35 that found significant moderate correlations between the DTVMI-VMI and the Good-Enough Harris Test in 6 to I3 year old South African children. The compatibility of the QSPOT DAP and VMI activity items, as constructional praxis activities, is important if the DAP and copying aspects will continue to be combined into a single task in future editions.
When considering Age-band 2; however, only a moderate correlation was found between Task I: DAP/VMI and the DTVMI-VMI in this research study (Table V). This may have been affected by the scoring of qualitative observations1,2, and a lack of strict measuring criteria, such as the use of a ruler and protractor in order to pass or fail an attempt to copy a figure, which would be unrealistic in a screen assessment such as the QSPOT.
Strong correlations between the Task 2: Cutting and the DTVMI-VMI were also obtained for both Age-band I and 2 (Table V), which is likely due to the fact that cutting requires integration of eye-hand coordination, bilateral coordination and manual dexterity64 "schema": ("https://github.com/citation-style-language/schema/raw/master/csl-citation.json"), as well as VMI, since VMI is essentially the simultaneous use of visual perception, finger movements and eye-hand coordination31. Therefore, the findings confirm that the drawing and cutting tasks on the QSPOT assess perceptual-motor skills such as that of the DTVMI-VMI, even though 60% of the mainstream participants failed the QSPOT cutting activity item. This again indicates the need to review the cut offs and criteria set for scoring the cutting item on the QSPOT.
The relationship between the fine motor skill tasks on the QSPOT with visual perception as tested by the DTVMI-VP was inadequate (Table V). This is possibly due to the only related criterion of naming shapes, which involves a learner discriminating the qualitative aspects of the shape (visual discrimination and form constancy) which are visual processing performance skills66, followed by attaching a name to the shape (basic shape concept16) which is a higher-cognitive client factor according to the OTPF II12. Overall, it is likely that the DTVMI-VP was not the most suitable test to compare to the pencil-and-paper and cutting tasks of the QSPOT, due to the fact that sensory-perceptual, visual perceptual, and motor processes are all used in those tasks, and not only visual perception16,66.
The internal consistency (Cronbach's alpha = 0.78) of the QSPOT for the total sample was adequate, and above the minimum which is commonly accepted in research67,68, and in studies conducted on screen assessments for children9,27. The findings indicated that the tasks are inter-related, but are not necessarily unidimensional67, which was expected as the QSPOT assesses various skills that can be grouped into constructs such as gross and fine motor skills, or visual-motor skills. The lower internal consistency for QSPOT Task 1: DAP/VMI may indicate differences in the aspects of the skills required for drawing a person and drawing shapes but it was close to 0.7 and no change in this item is suggested. When considering the guidelines given by Cortina67, the QSPOT (with an average inter-item correlation of r=0.48, and an overall Cronbach's alpha of 0.78), performed well with regard to this type of reliability. The findings also indicated that further psychometric research should be completed before using the total score of the QSPOT.
CONCLUSION
The QSPOT was found to be more accurate in identifying learners without dysfunction, than those with dysfunction. The higher specificity and lower sensitivity overall may be a serious disadvantage of the QSPOT in the current study, and this needs to be further researched on a more defined sample to ensure the test does not miss those learners who do present with the specific intrinsic barriers to learning screened by the test. The test does however discriminate between those identified with and without barriers to learning.
The findings also showed higher concurrent criterion validity of the QSPOT, and the MABC-2 and DTVMI-VMI for Age-band 1 compared to Age-band 2, particularly with regard to balance and catching. Higher concurrent criterion validity was also found for the QSPOT and DTVMI-VMI, especially for Age-band 1. This indicates the need to evaluate cut offs points and criteria for scoring for Age-band 2 in particular as these were not congruent with those in the MABC-2 in particular.
It should be understood that only 22% of visual perception as assessed by the DTVMI-VP is represented in the activities in the QSPOT and that this should be indicated as a limitation of the screen assessment or activities should be adjusted to deal with this gap. The findings indicated that the items of the QSPOT identify other gross and fine motor skills and visual-motor skill deficits in children between 5 years 0 months and 5 years 1 months and it is suggested that all the tasks and activities in the QSPOT be retained.
LIMITATIONS OF THE STUDY
A limited number of learners with intrinsic barriers to learning in motor and praxis, and sensory-perceptual performance skills were available for the study which may have impacted the sensitivity results. The sample of learners used in this study cannot be considered to be representative of the South African population at large, due to the fact that the sample was not racially stratified and that most of the schools were in middle to upper class suburban areas, with only one school in a low socio-economic area. The sample of participants was also small, and many items reflected abnormal distributions, and thus interpretation must be done with care, even though non-parametric data analysis was used
ACKNOWLEDGEMENTS
Sincere thanks go to the: Faculty of Health Sciences, University of the Witwatersrand and Professor Patricia de Witt and the Department of Occupational Therapy, University of the Witwatersrand, for the research grants provided; the research assistants; and the principals of the schools, the parents and the learners for their participation in the study.
REFERENCES
1. West Rand Group of Private Practitioners. Quick Screening Procedure for Referral to Occupational Therapy. Johannesburg: West Rand Private Practitioners Group, 2009. Presented at: Occupational Therapy Screening Procedure, Workshop; 2011 May 27; Gauteng. [ Links ]
2. Quick Screening Procedure for Referral to Occupational Therapy (Revised record form). West Rand Private Practitioners Group; 2012 [cited 2013 Aug 10]. [ Links ]
3. van Helsdingen J, Janse van Rensburg E, Jooste E, Verkerk J. Research protocol: Development of a national uniform screening procedure for referral to occupational therapy for children aged 4-5 years [unpublished research protocol]. 2012: 1-29. [ Links ]
4. South Africa. Department of Education Directorate: Inclusive Education. Conceptual and operational guidelines for the implementation of inclusive education: Special schools as resource centres. 2005 [cited 2012 Mar 10]. Available from: http://www.education.gov.za/LinkClick.aspx?fileticket=wHOV7lRtQlA%3D. [ Links ]
5. South Africa. Education White Paper 6. Special needs education: Building an inclusive education and training system 2001. Pretoria: Department of Education; 2001 [cited 2012 Mar 3]. Available from: http://www.education.gov.za/LinkClick.aspx?fileticket=gVFccZLi/tI= . [ Links ]
6. Early Head Start National Resource Center (Washington, DC). Technical assistance: Paper no. 4. Developmental screening, assessment, and evaluation: Key elements for individualizing curricula in Early Head Start programs. 2000 [cited 2015 Jun 14]; 1-24. Available from: http://eclkc.ohs.acf.hhs.gov/hslc/hs/resources/eclkcbook-store/pdfs/finaltap%5B1%5D.pdf. [ Links ]
7. Department of Education. Education Directorate: Inclusive Education. National strategy on screening, identification, assessment and support: School pack - SIAS book 2008. Pretoria: Department of Education; 2008 [cited 2012 Mar 3]. Available from: www.thutong.doe.gov.za/resourcedownload.aspx?id=35979. [ Links ]
8. Henderson SE, Sugden DA, Barnett AL. Movement Assessment Battery for Children. 2nd ed. London: Pearson Education, 2007. [ Links ]
9. Peersman W, Carton W, Cambier D, De Maeseneer and van Waelvelde H. Psychometric properties of a motor skill checklist for 3- to 5-year-old children. Child: Care, health and development. 2012; 38(3): 350-357. [ Links ]
10. Richmond J, Holland K. The relationship between a teacher check list and standardised tests for visual perception skills: A South African remedial primary school perspective. South African Journal of Occupational Therapy. 2010; 40(3): 9-16. [ Links ]
11. American Academy of Pediatrics. Identifying infants and young children with developmental disorders in the medical home: An algorithm for developmental surveillance and screening. Pediatrics, 2006; 118(1): 405-20. [ Links ]
12. Occupational therapy practice framework: Domain and process. 2nd ed. The American Journal of Occupational Therapy. 2008; 62(6): 625-83. [ Links ]
13. Case-Smith J, Rogers J. School-based occupational therapy. In: Case-Smith J, editor. Occupational therapy for children. 5th ed. St. Louis: Elsevier, 2005:795-824. [ Links ]
14. Fisher A. Overview of performance skills and client factors. In: McHugh Pendleton H, Schultz-Krohn W, editors. Pedretti's occupational therapy practice skills for physical dysfunction. 6th ed. St. Louis: Mosby, 2006:372-86. [ Links ]
15. Ratcliffe I, Franzsen D, Bischof F. Development of a task-based bilateral fine motor skill assessment for Grade 0 children in South Africa. South African Journal of Occupational Therapy. 2013; 43(1): 9-15. [ Links ]
16. van Jaarsveld A, Janse van Rensburg E. The Wall Model of Occupational Performance (WOP) for Children. Department of Occupational Therapy, University of the Free State; 2009. Introductory Workshop. Presented at Prospectus Novus School; 2010 Jan: 22-23; Gauteng. [ Links ]
17. Cook RA, Agenbag C, Malengret L, McDougall B, Visser S, Ziervogel L. Clinical Observations of Gross Motor Items. 2nd ed. Hatfield: South African Institute for Sensory Integration, 2004. [ Links ]
18. Stewart KB. Purposes, processes and methods of evaluation. In: Case-Smith J, editor. Occupational therapy for children. 5th ed. St. Louis: Elsevier, 2005:218-45. [ Links ]
19. Jackson S, Korey-Hirko S, Goss S. Developmental Screening Instruments for Preschool Programs. State Support Team Region 8 & Kent State University; 2008 [cited 2015 Jun 14]; 1-11. Available from: http://www.personal.kent.edu/~sljackso/documents/Developmen-tal%20Screening%20Instruments%20for%20Young%20Children.pdf. [ Links ]
20. Occupational Therapy Association of South Africa 'Guidelines Concerning Screening Procedures in Mainstream Schools.' Occupational Therapy AAssociation of South Africa. 2006 [cited 2012 Mar 10]. Available from: http://www.otasa.org.za/documents/Guidelines_Screening_Procedures_Main_ Stream_Schools_27I02006.pdf. [ Links ]
21. Richardson PK. Use of standardized tests in pediatric practice. In: Case-Smith J, editor. Occupational therapy for children. 5th ed. St. Louis: Elsevier; 2005:246-75. [ Links ]
22. Bailey DM. Research for the health professional: A practical guide. 2nd ed. Philadelphia: FA. Davis Company,1997. [ Links ]
23. Dawson B, Trapp RG. Basic & clinical biostatistics. 4th ed. New York: The McGraw-Hill Companies; 2004. [ Links ]
24. Education Statistics in South Africa 2011. Pretoria: Department of Basic Education, Republic of South Africa; 2013 [cited 2014 Feb 11]. Available from: http://www.education.gov.za/LinkClick.aspx7fileticket=94l8jjiYeME %3D&tabid=462&mid=1326. [ Links ]
25. Laver Fawcett AJ. Principles of assessment and outcome measurement for occupational therapists and physiotherapists: theory, skills and application. West Sussex: John Wiley & Sons; 2007. [ Links ]
26. STATISTICA for Windows. Version 12.5. Tulsa: StatSoft, Inc; 2014 [accessed 2014 Oct 31]. [ Links ]
27. Wuang Y-P, Su J-H, Su C-Y. Reliability and responsiveness of the Movement /Assessment Battery for Children-Second Edition Test in children with developmental coordination disorder. Developmental Medicine and Child Neurology. 2012; 54(2): 160-5. [ Links ]
28. Wuang Y-P, Su C-Y, Huang M-H. Psychometric comparisons of three measures for assessing motor functions in preschoolers with intellectual disabilities. Journal of Intellectual Disability. 2012; 56(6): 567-78. [ Links ]
29. Schoemaker MM, Niemeijer AS, Flapper BC, Smits-Engelsman BC. Validity and reliability of the Movement Assessment Battery for Children-2 Checklist for children with and without motor impairments. Developmental Medicine and Child Neurology. 2012; 54(4): 368-75. [ Links ]
30. Venter A, Pienaar AE, Coetzee D. Suitability of the 'Little DCDQ' for the identification of DCD in a selected group of 3-5-year-old South African children. Early Child Development and Care. 2015; 185: 1359-71. [ Links ]
31. Beery KE, Beery NA. The Beery-Buktenica Developmental Test of Visual-Motor Integration (Beery VMI). 6th ed. Bloomington: PsychCorp; 2010. [ Links ]
32. Venter A, Bham A. The usefulness of commercially available 'culture fair' tests in the assessment of educational success in Grade I black pupils in South Africa - an explorative study. Journal of Child and Adolescent Mental Health. 2003; 15((1): 33-7. [ Links ]
33. van Jaarsveld A, Vermaak M, van Rooyen C. The developmental status of street children in Potchefstroom, South Africa. South African Journal of Occupational Therapy. 2011; 41(1): 5-9. [ Links ]
34. Pienaar AE, Barhorst R, Twisk JW. Relationships between academic performance, SES school type and perceptual-motor skills in first grade South African learners: NW-CHILD study. Child: Care, health and development. 2014; 40(3): 370-8. [ Links ]
35. Lotz L, Loxton H, Naidoo AV. Visual-motor integration functioning in a South African middle childhood sample. Journal of Child and Adolescent Mental Health. 2005; 17(2): 63-7. [ Links ]
36. Dunn M, Loxton H, Naidoo A. Correlations of scores on the Developmental Test of Visual-Motor Integration and Copying Test in a South African multi-ethnic preschool sample. Perceptual and Motor Skills. 2006; 103(3): 951-8. [ Links ]
37. Goyen T-A, Duff S. Discriminant validity of the Developmental Test of Visual-Motor Integration in relation to children with handwriting dysfunction. Australian Occupational Therapy Journal. 2005; 52(2): 109-15. [ Links ]
38. Daly CJ, Kelley GT, Krauss A. Brief Report - Relationship between visual-motor integration and handwriting skills of children in kindergarten: A modified replication study. The American Journal of Occupational Therapy. 2003; 57(4): 459-62. [ Links ]
39. Barnhardt C, Borsting E, Deland P Pham N, Vu T. Relationship between visual-motor integration and spatial organization of written language and math. Optometry and Vision Science. 2005; 82(2): 138-43. [ Links ]
40. MedCalc(R) easy-to-use statistical software Version 15.2.2. MedCalc Software bvba: c2015 [updated 2015 Feb 27; accessed 2015 Apr I6]. Available from: https://www.medcalc.org/calc/diagnostic_test.php. [ Links ]
41. Gwynne K, Blick B. Motor Performance Checklist for 5 year olds: A tool for identifying children at risk of developmental co-ordination disorder. Journal of Paediatrics and Child Health. 2004; 40(7): 369-73. [ Links ]
42. Methods of analysis: from univariate to multivariate statistics. In: Kielhofner G. Research in occupational therapy: methods of inquiry for enhancing practice. Philadelphia: F.A. Davis Company; 2006:262-5. [ Links ]
43. Akobeng AK. Understanding diagnostic tests 2: likelihood ratios, pre- and post-test probabilities and their use in clinical practice. Acta Paediatrica. 2006; 96(4): 487-91. [ Links ]
44. Deeks JJ, Altman DG. Statistics notes: Diagnostic tests 4: Likelihood ratios. The British Medical Journal. 2004; 329(7458): 168-9. [ Links ]
45. Roach KE. Measurement of Health Outcomes: Reliability, Validity and Responsiveness. Journal of Prosthetics and Orthotics. 2006; 18(1): 8-12. [ Links ]
46. Cortiella C, Horowitz SH. The state of learning disabilities: Facts, trends and emerging issues. 3rd ed. New York: National Center for Learning Disabilities, Inc.; 2014 [cited 2015 Oct 28]. p. 1-5,7-17,25-27. Available from: https://www.ncld.org/wp-content/uploads/2014/II/2014-State-of-LD.pdf. [ Links ]
47. van Jaarsveld A. Patterns of sensory integration dysfunction in children from South Africa. South African Journal of Occupational Therapy. 2014; 44(2): 2-6. [ Links ]
48. Jasmin E, Couture M, McKinley P, Reid G, Fombonne E, Gisel E. Sensori-motor and daily living skills of preschool children with autism spectrum disorders. Journal of Autism and Developmental Disorders. 2009; 39(2): 231-41. [ Links ]
49. Wuang Y-P Wang C-C, Huang M-H, Su C-Y Profiles and cognitive predictors of motor functions among early school-age children with mild intellectual disabilities. Journal of Intellectual Disability Research. 2008; 52(12): 1048-60. [ Links ]
50. Meyer A, Sagvolden T. Fine motor skills in South African children with symptoms of ADHD: Influence of subtype, gender, age, and hand dominance. Behavioral and Brain Functions. 2006; 2: 33. [ Links ]
51. de Milander M, Kingwill C, Wolmarans S, Venter A. Dominant preference and school readiness among grade I learners in Bloemfontein. South African Journal of Child Health. 2014; 8(4): 153-156. [ Links ]
52. Steenhuis RE, Bryden MP, Schroeder DH. Gender, laterality, learning difficulties and health problems. Neuropsychologia. 1993; 31(11): 1243-54. [ Links ]
53. Cairney J, Schmidt LA, Veldhuizen S, Kurdyak P Hay J, Faught BE. Left-handedness and developmental coordination disorder. The Canadian Journal of Psychiatry. 2008; 53(10): 696-9. [ Links ]
54. Peters M. Footedness: AAsymmetries in foot preference and skill and neuropsychological assessment of foot movement. Psychological Bulletin. 1988; 103(2): 179-92. [ Links ]
55. Forseth AK, Sigmundsson H. Static balance in children with hand-eye co-ordination problems. Child: Care, health and development. 2003; 29(6): 569-79. [ Links ]
56. Learning Disabilities Association of America. Types of learning disabilities. c2015 [cited 2015 Mar 24]. Available from: http://www.ldaamerica.org/types-of-learning-disabilities/. [ Links ]
57. Neurodevelopmental disorders. In: Diagnostic and statistical manual of mental disorders. 5th ed. Arlington: American Psychiatric Association Publishing; 2013 [cited 2015 Jul 21]. Available from: http://dx.doi.org/I0.II76/appi.books.9780890425596.dsm01. [ Links ]
58. Reeves GD, Cermak SA. Chapter 3: Disorders of praxis. In: Bundy AC, Lane SJ, Murray EA, editors. Sensory integration: theory and practice. 2nd ed. Philadelphia: F.A. Davis Company, 2002:71-100. [ Links ]
59. Fagan TJ. Letter to the editor: Nomogram for Bayes theorem. New England Journal of Medicine. 1975; 293(5): 257. [ Links ]
60. Campo M, Shiyko MP, Lichtman SW. Sensitivity and specificity: A review of related statistics and controversies in the context of physical therapist education. Journal of Physical Therapy Education.2010; 24(3): 69-78. [ Links ]
61. Thordardottir E, Kehayia E, Mazer B, Lessard N, Majnemer A, Sutton A, Trudeau N, Chilingaryan G. Sensitivity and specificity of French language and processing measures for the identification of primary language impairment at age 5. Journal of Speech, Language, and Hearing Research. 2011; 54(2): 580-97. [ Links ]
62. van Jaarsveld A, Mailloux Z, Herzberg DS. The use of the Sensory Integration and Praxis tests with South African children. South African Journal of Occupational Therapy. 2012; 42(3): 12-8. [ Links ]
63. Henderson A, Pehoski C, Murray E. Visual-spatial abilities. In: Bundy AC, Lane SJ, Murray EA. Sensory integration: theory and practice. 2nd ed. Philadelphia: F.A. Davis Company; 2002:123-40. [ Links ]
64. Ratcliffe I. Concha M, Franzsen D. Analysis of cutting skills in four to six year olds attending nursery schools in Johannesburg, South African Journal of Occupational Therapy. 2007 37(1) 4-9 [ Links ]
65. Folio MR, Fewell RR. Peabody Developmental Motor Scales. 2nd ed. Austin: PRO-ED; 2000. [ Links ]
66. Schnek CM. Visual perception. In: Case-Smith J, editor. Occupational therapy for children. 5th ed. St. Louis: Elsevier; 2005:412-46. [ Links ]
67. Cortina JM. What is coefficient alpha? An examination of theory and applications. Journal of Applied Psychology. 1993; 78(1): 98-104. [ Links ]
68. Terwee CB, Bot SD, de Boer MR, van der Windt DA, Knol DL, Dekker J, Bouter LM, de Vet HC. Quality criteria were proposed for measurement properties of health status questionnaires. Journal of Clinical Epidemiology. 2007; 60(1): 34-42. [ Links ]
 Correspondence:
Lauren Vial
lauren.vial@gmail.com

