


Services on Demand
Article
 English (pdf)
 Article in xml format
 Article references
Indicators

Related links
-
 Cited by Google
 -
 Similars in Google
Share

 Permalink
R&D Journal
On-line version ISSN 2309-8988
Print version ISSN 0257-9669
R&D j. (Matieland, Online) vol.39 Stellenbosch, Cape Town 2023
http://dx.doi.org/10.17159/2309-8988/2023/v39a5
An FEA Investigation of the Vibration Response of the BEATS Detector Stage
F MokoenaI; M BhamjeeII; SH ConnellIII; P Van VaerenberghIV; G IoriV; A KaprolatVI
IDepartment of Mechanical Engineering Science, Faculty of Engineering and the Built Environment, University of Johannesburg, Auckland Park, Kingsway Campus, 2006, South Africa, fortunemokoena4@gmail.comIISAIMechE member. Department of Mechanical Engineering Science, Faculty of Engineering and the Built Environment, University of Johannesburg, Auckland Park, Kingsway Campus, 2006, South Africa, († Now at IBM Research - Africa), mbhamjee@uj.ac.za, Muaaz.Bhamjee@ibm.com
IIISimon Connell Department of Mechanical Engineering Science, Faculty of Engineering and the Built Environment, University of Johannesburg, Auckland Park Kingsway Campus, 2006, South Africa, shconnell@uj.ac.za. Corresponding Author
IVEuropean Synchrotron Radiation Facility - ESRF, Grenoble, France, vanvaer@esrf.fr
VSynchrotron Light for Experimental Science and Applications in the Middle East - SESAME, Allan, Jordan, Gianluca.Iori@sesame.org.jo
VIEuropean Synchrotron Radiation Facility - ESRF, Grenoble, France, axel.kaprolat@esrf.fr
ABSTRACT
The Synchrotron-light for Experimental Science and Application in the Middle East (SESAME) facility is in the process of designing, procuring, and installing a new beamline for tomography (BEATS). The BEATS experimental hutch, hosting sample and detectors, will be located 43 m away from the undulator in the synchrotron ring. Noise in the form of vibration originating from different sources transferred to the detector stage can be a source of poor image quality thus it is important that the detector stage is analysed for its vibration transmission properties. In this study, the result of a three-dimensional random vibration analysis using Finite Element Analysis (FEA) for the detector stage is presented which leads to an estimate of the severity of the vibrations. The random vibration source is that of the ground which was measured exactly where the detector stage will be mounted. The random vibration analysis is conducted in two stages; the modal frequencies of the structure are calculated, thereafter, the random vibration analysis is conducted and the response power spectrum density (PSD) of the structure is calculated along with the root mean square (RMS) displacement values. Since the beamline BEATS is under installation, an existing structure installed at beamline ID28 of the European Synchrotron Radiation Facility (ESRF) was used to validate the model. The model used on the ID28 structure deviated from the experimental results on modal analysis by 2% - 4% on random vibration analysis. This suggested that the model is valid. The analysis as applied to the BEATS detector stage design predicts that the RMS displacement values are less than the pixel size of the detector which is 1 μm. Thus, the structure is sufficiently engineered to moderate the floor vibrations.
Additional keywords: Synchrotron, Light Source, SESAME, X-ray Tomography, X-ray Beam Line, X-ray experiment station, Vibration Analysis in design.
1 Introduction
The Synchrotron-light for Experimental Science and Application in the Middle East (SESAME) has added to its portfolio of instruments a beamline for tomography that will provide micrometre-resolution radiography and tomography applications to users from different communities such as archaeology, health, material sciences and geology [1]. The equipment of the beamline should be designed such that they are able to support X-ray light production as well as experiment execution. It is important that the designed equipment is analysed for its vibration performance.
Within a synchrotron environment, the mechanical stability of the photon source as well as the beamline equipment is of paramount importance to ensure successful experiments involving high spatial resolution [2]. With the detector stage being at the end of the beamline, it needs to be designed such that it is rigid enough and dampens rather than amplifies the excitation forces from the floor on which it is mounted.
The aim of this study was to prove that the detector stage will be sufficiently stable to ensure that floor vibration will not have a negative impact on the measurements. A Gaussian distribution random vibration system is considered and due to this, the Root Mean Square (RMS) displacement value of the detector stage should be at least 6 times (±3 deviations from the mean) smaller than the minimum pixel size of the beamline imaging system (~1 μm). This is done by characterising the vibration of the ID28 back scattering monochromator structure using Finite Element Analysis (FEA), specifically modal analysis and random vibration analysis in Ansys Mechanical 2020 R2 and bench marking the model predictions against experimental data. The technique applied to ID28 is then used to develop an FEA model for the Beamline for Tomography at SESAME(BEATS) detector stage design to analyse the vibrational data of the structure.
The main objective of analysing a random process is to determine the likelihood of finding extreme displacement values [3]. Normally, random vibration analysis is characterised by a Power Spectrum Density (PSD), which is an effective way of describing random vibration over a frequency range [3]. The floor displacement PSD can be an excitation force applied to a structure and a response displacement PSD is given by the structure. From the displacement PSD, the parameter of interest is usually the (RMS) displacement value, which is calculated by taking the integral of the displacement PSD function. The RMS displacement value indicates the instantaneous severity of vibration [3].
2 Experimental Setup
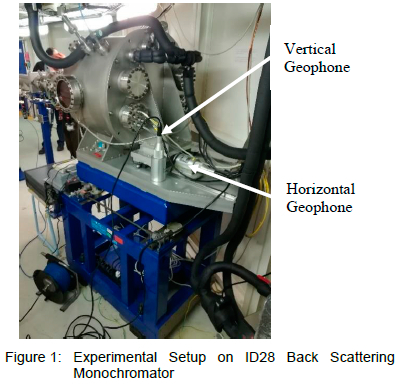
Real data of the vibrations of the BEATS detector stage was not available for validation. Therefore, an existing backscattering monochromator from the European Synchrotron Radiation Facility (ESRF) in the ID28 beamline is used to benchmark the simulation technique applied to analyse the BEATS detector stage. The floor vibration of ID28 is measured in the optical hutch floor as well as the response of the back scattering monochromator support structure [4]. The experimental setup is illustrated by figure 1. Vibrations along the X and Z axes were recorded with two geophones.
2.1 ID28 Test Setup
Experimental data was captured using two geophones, with one measuring horizontal displacement and the other measuring vertical displacement as indicated in figure 1. The geophones used are L-4C models with 83.5 V/m/s sensitivity and a moving mass of 1 kg. The movement of the floor and the ID28 equipment was measured in the time domain and later converted to the frequency domain by applying the Fast Fourier Transform (FFT).
2.2 Measurement Points
The displacement measuring points were chosen such that they provide movement response of the whole structures. The placement of the geophones is indicted by figure 1 and for the movement of the floor, the geophones were placed on the floor of the ID28 beamline. The layout of the ID28 beamline is shown in figure 2.

2.3 Independent and Dependent Variables
The independent variable that was controlled during the experiment is the frequency. The frequency was varied to find the displacement in the X, Y and Z direction. The dependent variable in the case of this study is the displacement. The displacement of the floor and ID28 optical hutch equipment but more specifically for this study, is the back scattering monochromator.
3 Experimental Results
Once the experiment was concluded, the modal frequencies of the structure were extracted. From the response in figure 3, where X, Y and Z are the monochromator measured response and X floor, Y floor and Z floor are the measured floor movements. X is along the beam; Y is perpendicular to the beam and Z is vertical. The first five modal frequencies of the monochromator were identified as 18 Hz, 19 Hz, 25 Hz, 28 Hz and 45 Hz. There is a peak around 5 Hz in figure 3. However, it is important to note that this is a random vibration spectrum, so it is possible that at the time of capturing the spectrum there was a high excitation from the ground. But considering that the input will always be amplified by the structure, it is expected that the response of the structure will also have a peak, but this does not mean that it is a modal frequency.
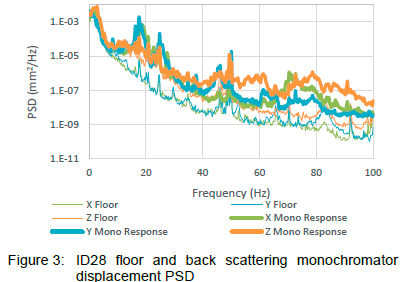
The 3D input PSD of the floor as well as the monochromator 3D response PSD were physically measured.
The RMS values (which indicate the instantaneous severity of vibration) were calculated using the trapezoidal rule for integration. The RMS displacement values for the floor in the X, Y and Z direction are 101 nm, 77 nm and 127 nm respectively. The RMS displacement values in the X, Y and Z direction for the back scattering monochromator are 117 nm, 96 nm and 137 nm respectively.
4 Finite Element Analysis Model
4.1 Governing Equations
Before a random vibration analysis can be done, the natural frequency as well as the mode shapes of the structure must be computed [6]. The frequency at which a structure will naturally vibrate is referred to as the natural frequency [7]. To compute the natural frequency of the structure, the equation of motion is used in a matrix form:

In the equation, [M] is the matrix for the mass of the system, [C] being the damping matrix and [K]is the stiffness matrix of the structure, and {q} being the external excitations. If the structure is assumed to have no damping and has no external force being applied to it, then equation 1 becomes the following:

Simple harmonic motion can be assumed; thus, the final equation is as follows:

where λrepresents the angular frequency squared. By applying an inverse iteration method to equation 3, an eigen problem was solved to calculate the natural frequency and mode shapes of the structure [8]. To find the response random acceleration of the system, the spectral approach is applied. The equation of motion is still the same as equation 1.
The relationship between a random input spectrum and the response spectrum of a linear system can also be deduced by the following [9]:

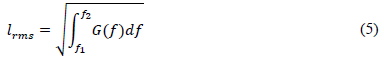
Where Gu(f) is the output spectrum, Gl(f) being the input spectrum and H(f) the transfer function. The RMS displacement value (input and output) is calculated by taking the integral of the function denoted as follows [9]:
4.2 Model
The model to be analysed is shown in figure 4. To save computational time, the following simplifications were made to the model:
• Removing items that will not influence the results of the calculation.
• Removing small holes to simplify the mesh.
• Simulating the X-ray beam optical components within the vacuum chamber as a point mass.
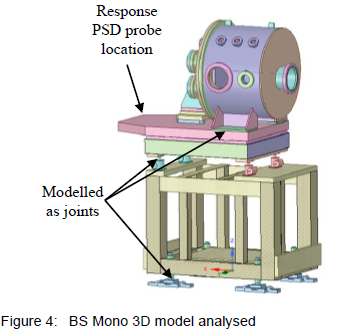
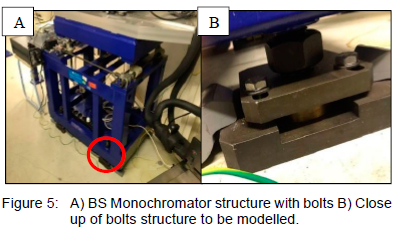
Modal analysis and random vibration analysis were carried out using Ansys Mechanical 2020 R2. Where the structure is joined with bolts, the bolts were modelled as a general joint that can move in the X, Y and Z direction. The joint stiffness of the bolts was calculated as per the approach in [10]. The actual support structure of the BS Monochromator is shown in figure 5.
To perform the calculation, the following information is required:
• Bolt washer face
• Washer thickness
• Thickness of the materials that is being joined by the bolt
• Bolt shank diameter
• Effective grip length of the bolt
• Threaded length of the bolt
• Modulus of elasticity of the bolt
• Modulus of elasticities of the materials that are being joined.
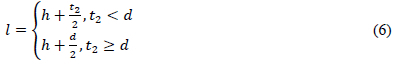
Some of the information mentioned above was calculated depending on the nature of the bolts and the situation in which they are placed in the assembly. The calculation of the joint stiffness is summarised below. The grip length is first calculated:
For (a): l = the thickness of the material that is between the bolt and the nut:
For (b):
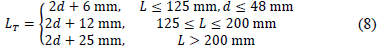
Once the grip length is established, the fastener length is rounded up using a table found in [10]:

The threaded length of the bolt is standardised and can be deduced based on the grip length of the bolt which was calculated in the previous equation as follows:
The length of the unthreaded portion in the grip is calculated as follows: ld = L - LT. The length of the threaded portion in the grip is calculated as follows: lt = l - ld. The area of the unthreaded portion is calculated as follows: Ad = 2/4 The area of the threaded portion At is found in table 8-1 or 8-2 from [11]. From all this information, the fastener stiffness is calculated as:

The first part of the calculation consists of establishing the stiffness of the bolt alone using the bolts indicated in figure 5 as an example. To calculate the total spring constant of the joint, the first value to be established is the bolt length which is normally a standard value. The bolt joint scenario is illustrated in Figure 5B. The bolt is of size M8 and the thickness of the assembly is 21.75 mm, thus, the minimum bolt length should be 21.75 mm. From [10], the standard bolt length is 25 mm and, the standard washer thick-ness for the bolt is found to be 1.75 mm.
The values required to calculate the bolt joint assembly are summarized below along with the reference tables from [10]:
• Washer Thickness - 1.75 mm
• Bolt actual Length - 25 mm
• Area of bolt threaded area - 36.6 mm2
• Bolt modulus of elasticity - 97 GPa
The mesh used for the analysis on the ID28 monochromator is a combination of a cartesian mesh as well as a tetrahedral mesh as indicated in figure 6. All small components of the assembly, such as bolts and nuts, have been removed. Small holes were filled, and the crystal assembly and several components have been modelled as a point mass. Given the small size of items and holes removed compared to the over-all size of the assembly, the assumptions are not expected to alter or invalidate the results of the modal analysis. In addition, this resulted in a mesh with a relatively small number of cells required for computation and in a simplified yet representative model. A mesh independence study was conducted. The Grid Convergence Index (GCI) approach as per [12] was used for the mesh independence study. The parameters that were chosen for the mesh independence study is the first modal frequency as well as the maximum deformation noted on the first modal frequency. The results of the study are summarised in tables 1 and 2.
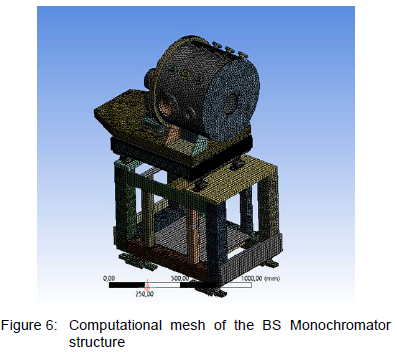
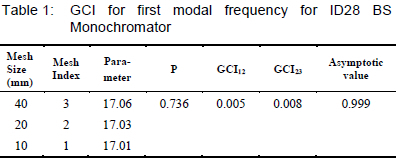
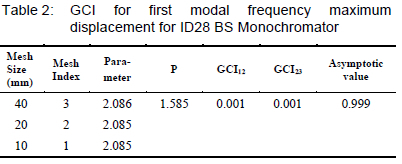
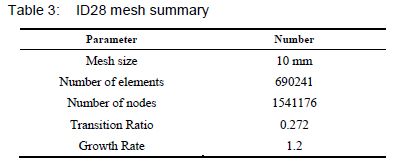
From the mesh independence study, it is concluded that when a 10 mm mesh size is used, the effects on the results of the analysis are negligible, thus, mesh independent. Thus, a 10 mm mesh size was used for the rest of the analysis as per table 3.
5 Model Results and Benchmarking
5.1 ID28 Back Scattering Monochromator FEA
The modal frequencies of the model were extracted and from figure 7, the first five modal frequencies were identified to be 17 Hz, 18 Hz, 26 Hz, 27 Hz and 46 Hz. In addition, a moderate peak can be appreciated around 5 Hz. However, it is important to note that this is a random vibration spectrum, so it is possible that at the time of capturing the spectrum there was a spike from the ground. Considering that the input will always be amplified by the structure, it is expected that the response of the structure will also have a peak, but this does not necessarily mean that it is a modal frequency. Furthermore, the ESRF is situated in a high-activity urban area, between two rivers and adjacent motorways. This makes the ESRF beamlines susceptible to vibration resonance at low frequencies.
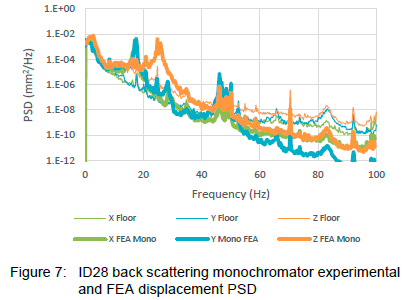
The criteria for benchmarking the FEA model were based solely on the modal frequency as well as the RMS displacement value of the response PSD which were found to be on average 4% for the modal frequencies and 2% for the response PSD.
Mode switching is likely to occur because the PSD response is measured only on one node of the FEA model as opposed to the whole structure which is what was done in the experiment. This is also explained in the BEATS detector stage response where mode 2 and 3 are not present in the response PSD because the mode deformation is not part of the location where the response PSD is being monitored.
From the data that is summarised in figure 7, the trapezoidal rule is applied for the FEA response data for the monochromator to calculate the RMS values in the X, Y and Z direction. These were calculated to be 116 nm, 93 nm and 140 nm in the X, Y and Z direction, respectively.
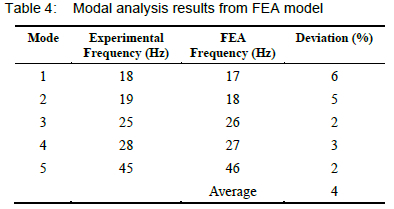
Benchmarking of the model is a two-step process. The first part is validating the model based on modal frequencies, i.e. the modal frequencies predicted by the vibration analysis via FEA model must coincide with the real values of the ID28 device. The second part of validation is on the response displacement RMS values of the structure from the experimental data and the FEA results. The comparison of measured and calculated modal frequency is summarized in table 4. The first five modal frequencies predicted by the FEA model are in good agreement with experimental frequencies, showing an average deviation of 4%.
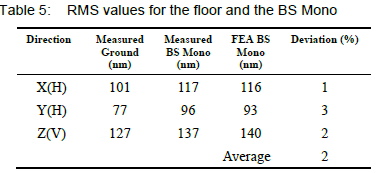
The experimental PSD of the ID28 floor was applied as input to the structure in the analysis to simulate the monochromator response. The RMS results of the FEA were compared to the measured monochromator results in table 5. The average deviation on the RMS results between the measured response of the monochromator and the FEA response is 2%.
The result of this comparison proves that the meth-od to model the vibrational properties of the ID28 back scattering monochromator is accurate and it can be applied to the BEATS detector stage design.
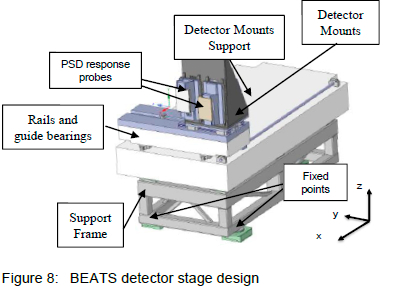
5.2 BEATS Detector Stage FEA
The final design of the BEATS detector stage is illustrated in figure 8. After validation, the same technique that was applied to the ID28 back scattering monochromator is applied to the BEATS detector stage. All parts which are being joined using bolts were modelled as joints with stiffness calculated in accordance with the procedure laid out in [11]. Virtual PSD response probes are applied to the mounting position of the detectors on the stage (figure 8).
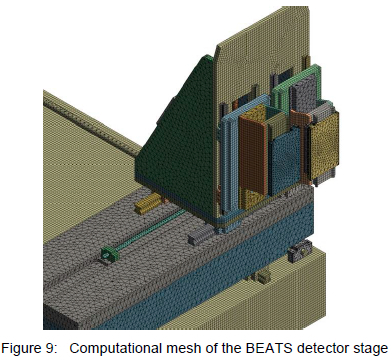
5.2.1 Meshing
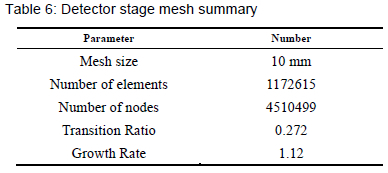
The mesh applied to conduct the analysis of the BEATS detector stage is a tetrahedral mesh. The mesh of the structure is shown in figure 9 with the statistics of the mesh are given in table 6.
The approach taken to study the mesh sensitivity is the Grid Convergence Index (GCI) which is given in [12]. The GCI study for the BEATS detector stage is conducted using two parameters, the first modal frequency and the maximum deformation on the first modal frequency. The results of the GCI study for first modal frequency and the first modal frequency maximum deformation are summarised in tables 7 and 8 respectively.
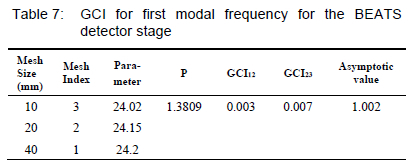
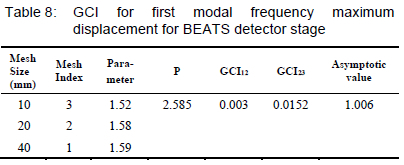
From the CGI, the analysis indicates asymptotic convergence is established and any further refinement to the mesh size will not have any considerable im-pact on the results. Therefore, a mesh size of 10 mm is sufficient for the analysis.
5.2.2 Material Properties
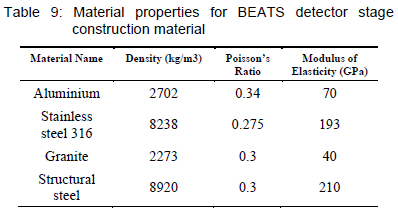
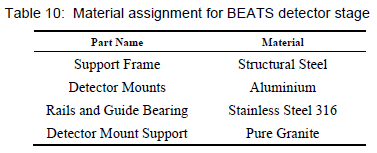
The material properties for the BEATS detector stage construction material are summarised in table 9 and the material assignment to the various parts of the detector stage is given in table 10.
During the modal analysis, 6 modes were extracted and used in the further step of random vibration analysis. The first 6 modal results for the BEATS detector stage are 24 Hz, 35 Hz, 35 Hz, 41 Hz, 62 Hz and 69 Hz. The modal shapes, directions of deformation and natural frequency of each mode are illustrated in figure 10.
5.2.3 Results
Once the modal analysis was concluded, random vibration analysis was conducted using an experimental measurement of the 3D displacement PSD of the SESAME floor conducted as illustrated in figure 11 [4].
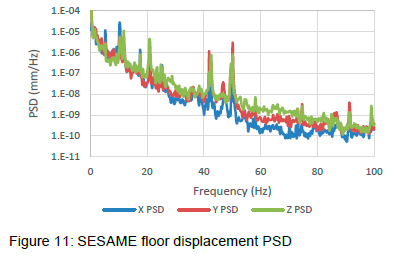
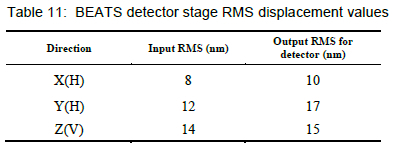
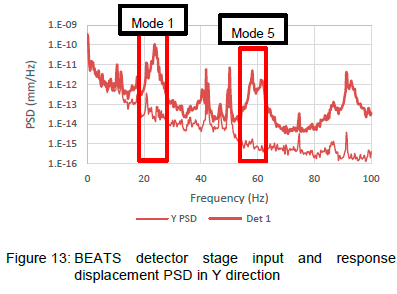
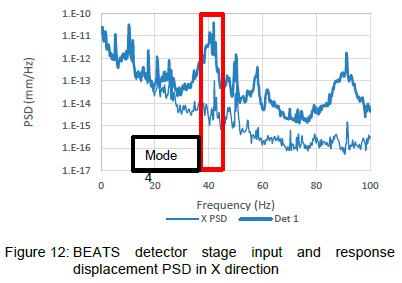
The random input load from the floor as applied to the fixed points of the structure is indicated in figure 11. The displacement PSD response of the structure as measured at the mounting position of detector 1 in the X, Y and Z direction and are shown in figures 12, 13 and 14 respectively along with the modes marked out. The location of one of the two detectors (Det) is considered and the RMS displacements are summarized in table 11.
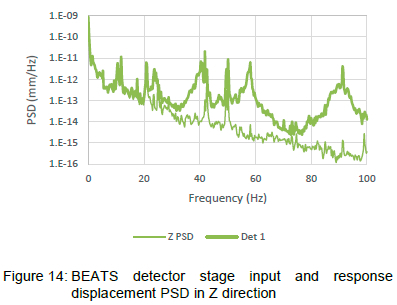
6 Discussion
A successful study of the vibration performance of the BEATS detector stage is described. From the random vibration response spectrum in figure 12, it is important to note that mode 2 and 3 do not appear. This is due to the location of measurement of the displacement PSD. In mode 2 and 3, only the threaded rod that strokes the detectors in the X direction de-forms as can be seen in figure 15. However, since the response is being measured at the location of one of the detectors, the contribution of mode 2 and 3 will not appear in the response. This is also mentioned in Random Vibration-Mechanical, Structural and Earth-quake Applications [11]. When large structures vibrate, vibration levels and intensity at various locations along the structure will vary [11]. Another limitation from the study is the possibility of mode switching where torsional and bending deformations are combined in one mode. To validate the model to include mode switching, it would require extensive experimentation which the authors were not in reach of at the time of the study. Such experimental work would require placement of vertical and horizontal geo-phones in more locations to capture the response PSD the superimpose them into one to account for deformations in different directions of the same structure. Such work would be important to fully characterise the response PSD of the structure for more accurate models, thus, it is proposed for future work.
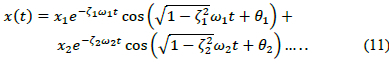
The displacement response of a system at a specific location can be represented by a Fourier series.

With x1 being the amplitude of the specific frequency ω1 and phase θ1. If the decay of the energy with time e-is included in the equation, the displacement response becomes [11]:
To measure the vibration at different locations, mode shape is an important part in modal analysis [11]. The mode shape is a vector unlike natural frequency and damping, which are scalars. Due to that, if the vibration is supposed to be measured at n locations but on the same structure, the equation for response becomes of each location is as follows [11]:
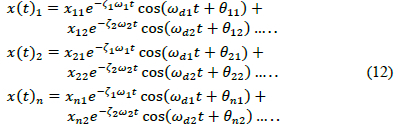
With being the damped natural frequency. If the system is linear, the transfer function is the ratio between the output and the input measured at certain locations as a function of frequency and the damping ratio [11]. Thus, the response displacement PSD of the BEATS detector stage has a missing component as the deformation at mode 2 and 3 were not included in the calculation. The same notion is noted on the ID28 response PSD. The transfer function is only calculated on one measured location as illustrated in figure 8. To have a full response, the support frame response should also be measured and included in the transfer function. The approximation of the joints and joint stiffnesses using [10] as a reference also contributes to the difference in the response PSD.
The low frequencies measured and modelled appear to correspond with the first natural frequencies of vibration of a slender steel bar, specifically the threaded rod.
However, due to the complexity of the structure and loading, this would not be evident a priori. Thus, modelling the structural and loading complexity and validation was necessary.
7 Conclusion
The main aim of this investigation was to determine the vibration performance of the BEATS detector stage by calculating the RMS displacement values using FEA to ensure that the structure will be stable enough to withstand vibration from the ground. The approach taken was to collect experimental data from an already existing structure and benchmark the FEA model to that data. Once the FEA model was validated it was applied to the BEATS detector stage design.
The ID28 model modal analysis results deviated from the experimental results by 4% and the random vibration analysis deviated by 2%. This indicated that the technique that was applied to modelling the back scattering monochromator was effective and could be used on the BEATS detector stage design as well. The technique applied to the ID28 model was carried through and applied to the BEATS detector stage. The RMS values for the BEATS detector stage were found to be 9.65 nm, 16.95 nm and 15.48 nm in the x, y and z directions respectively which is lower than the design parameter of ( 1 μm). It can be concluded that the structure will not transmit the vibrations from the ground with any amplification.
This approach can be used to model random vibrations in future detector stage designs. It is recommended, for future work, that the random vibration response of the BEATS detector stage is measured upon completion of construction and compared to the model data to further improve the FEA model. Due to limitations in the experimental method, validation of the joint stiffness calculation and inclusion of the effect of mode switching in the model was outside the scope of this study. Thus, areas of future work are of the validation of the joint stiffness calculation and its effectiveness on the overall modal analysis as well as the inclusion of the effect of mode switching in the model and the validation thereof.
Furthermore, equipped with the knowledge of hindsight, a further avenue for future investigation would be to ascertain why the low frequencies are dominated by the threaded rod.
Acknowledgements
The authors would like to acknowledge the support, guidance and expertise that were offered by Philipp Brumund, Marc Lesourd and Prof Daniel Madyira.
References
[1] G. Iori, M. AL-Najdawi, M. Shehab, A. Lausi, I. Cudin, M. Altíssimo, T. Kołodziej, P. Van Vaerenbergh, J. Reyes-Herrera and A. Kaprolat. Design and Ray-Tracing of the BEATS beamline of SESAME. 11th Int. Conf. on Mechanical Engineering Design of Synchrotron Equipment and Instrumentation (MEDSI'20), Chicago, IL, USA, July 2021, paper WEPA10.
[2] L. Zhang. Vibration at the ESRF. Proc. European Particle Accelerator Conference (EPAC96), Sitges, Spain, June 1996, pp. 1359-1361.
[3] Natural Frequency, physicsclassroom.com. URL: https://www.physicsclassroom.com/class/sound/Lesson-4/Natural-Frequency.
[4] M. Lesourd. Private communication, November 2020.
[5] M. Lesourd. ID28 Stability Tests. ESRF, France, Internal Report, Nov, 2020.
[6] C. Lalanne. Random Vibration. Chichester, UK: John Wiley & Sons, 2014. [ Links ]
[7] C. Lalanne. Mechanical Vibration and Shock Analysis, Random Vibration. Hoboken: Wiley, 2014. [ Links ]
[8] J. Wu, G. Yu, Y. Gao, and L. Wang, Mechatronics Modelling and Vibration Analysis of a 2-DOF Parallel Manipulator in a 5-DOF Hybrid Machine Tool. Mechanism and Machine Theory, 121:430-445, 2018. [ Links ]
[9] J. Wijker. Miles' Equation in Random Vibrations. Springer, 2018.
[10] R. Budynas and J. Nisbet. Shigley's Mechanical Engineering Design, 9th ed, McGraw Hill, New York, 2011.
[11] Z. Liang and G. C. Lee. Random Vibration. CRC Press, 2015.
[12] P. J. Roache. Perspective: A Method for Uniform Reporting of Grid Refinement Studies. Journal of Fluids Engineering, 116(3):405-413, 1994.
Received 10 January 2023
Revised form 2 November 2023
Accepted 27 November 2023
1 With permission: P van Vaerenbergh, ESRF.

