


Services on Demand
Article
 English (pdf)
 Article in xml format
 Article references
Indicators

Related links
-
 Cited by Google
 -
 Similars in Google
Share

 Permalink
R&D Journal
On-line version ISSN 2309-8988
Print version ISSN 0257-9669
R&D j. (Matieland, Online) vol.38 Stellenbosch, Cape Town 2022
http://dx.doi.org/10.17159/2309-8988/2022/v38a3
Characterisation of a Standard Fan Test Facility to Accommodate Reflection of Sound During Noise Measurements
C. du PlessisI; S.J. Van der SpuyII; H.C.R. ReuterIII
IPostdoctoral researcher. Department of Mechanical and Mechatronic Engineering, Stellenbosch University, South Africa. E-mail: clariceduplessis@gmail.com
IISAIMechE Member, Professor. Department of Mechanical and Mechatronic Engineering, Stellenbosch University, South Africa. E-mail: sjvdspuy@sun.ac.za
IIIExtraordinary Professor. Department of Mechanical and Mechatronic Engineering, Stellenbosch University, South Africa. E-mail: hreuter@sun.ac.za
ABSTRACT
Axial flow fans are fundamental to air-cooled condensers. While they provide the air flow for heat transfer, they also generate noise, which is a growing environmental concern. Sound reflections are characterised in an existing fan performance test facility, which does not conform to fan noise measurement standards. Corrections to the measured SPL spectrum is deduced along with the uncertainty in noise measurements. Corrections are compared to a reflection correction standard relating to buildings. This methodology can be repeated for other fan test facilities which do not comply with noise measurement standards.
Additional keywords: Fan noise, sound reflection.
Nomenclature
Roman
B Bandwidth [Hz]
Dfan Fan diameter [m]
k Coverage factor
L Length [m]
Lp Sound pressure level [dB]
p Pressure [Pa]
T Total measured time [s]
u Uncertainty
Greek
σ Standard deviation
Subscripts
b Background bell Bellmouth
d Difference between background corrected anechoic chamber and test facility measurements
L Loudspeaker position
m Measured
plen Plenum chamber
s Static
1 Introduction
Axial flow fans play an important part in industrial cooling applications, such as air-cooled condensers (ACCs), providing the air flow required for effective heat transfer from a cooling medium to atmospheric air. Increasing the heat transfer capacity by increasing the air flow rate often means increasing fan rotational speeds, which leads to an increase in the noise generation within the fan unit. Noise emissions are a growing environmental concern and it is becoming necessary to find improved methods to determine fan noise characteristics at the design stage, in order to ensure that noise will not exceed allowable occupational and residential levels. Industries are subject to stringent regional, national and international standards regarding the levels of noise that may be emitted.
The ability to measure fan noise accurately in the free field of an existing axial fan test facility designed for performance testing can contribute to greater accessibility of fan noise data and greater understanding of the fan noise mechanisms, while minimizing financial expense. It gives rise to the possibility to adjust certain fan characteristics to evaluate their effect on the generated noise, such as a reduction in tip clearance or an adjustment in tip speed. This is advantageous for end users of axial fans and cooling system suppliers. For this purpose, the effect of sound reflections in the specific fan test facility should be quantified. Noise measurement standards are applicable, such as ISO 3744 [1] for the free field noise measurement method over a reflecting plane. However, measurements in accordance with this standard are only valid where the environmental/reflection correction in decibels is smaller than or equal to 4 dB, which is rarely the case for fan test facilities of which the purpose is performance testing.
Holste & Neise [2] measured centrifugal fan noise using the ISO 3744 standard [1], which required the mounting of 200 m2 of thick rubber foam mats on the test facility to increase the room sound absorption to an acceptable level according to the standard. Adding sound absorbing material to every surface large enough to cause non-negligible reflection is not always a possibility due to the high financial cost involved. Zenger et al [3] measured axial fan noise in a test facility designed for performance testing according to the ISO 5801 standard [4]. The plenum chamber was built as an anechoic chamber with absorbing walls, ceiling and floor, to minimize reflections within the chamber. Microphones were mounted inside the plenum chamber. The effect of reflections on the outlet side of the fan was not discussed and conformance to an acoustic measurement standard is not discussed.
In the case that sound reflection causes a deviation from the non-distorted sound of more than 4 dB, measurements are not in accordance with ISO 3744 [1], and a different approach is necessary. In this work, the effect of reflections is quantified in an existing axial fan test facility designed for performance testing. This is done by comparing noise measurements of pure tone frequencies taken in the test facility to those taken in an anechoic chamber, from which corrections to the measured SPL spectrum in the fan test facility is deduced. Uncertainties in noise measurements are also computed. While this method is not in accordance with standards, it provides a way to compare the sound pressure level emitted by different fans on this specific fan test facility and can be applied to other facilities following a similar methodology.
2 Description of fan test facility
The investigated test facility is a 1.542 m diameter axial flow fan test facility, which is described as an ISO 5801, Type A (free inlet, free outlet) test facility [4]. The purpose of this fan test facility is to produce fan characteristic performance curves. A diagram of the facility can be seen in figure 1.
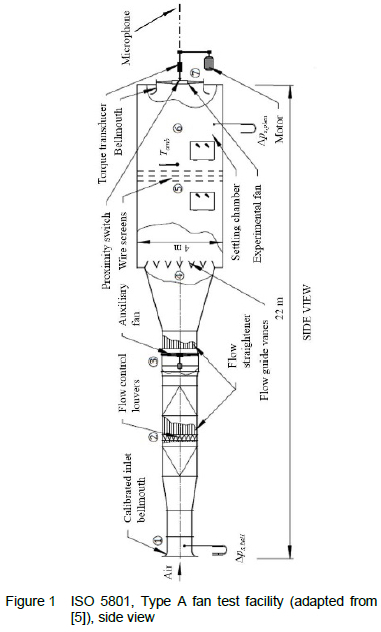
The fan test facility is not typically used for acoustic measurements of fan noise as it is in close proximity to solid walls. To one side, the fan axis of rotation is approximately 4.7 m from a wall on the side of microphone position 1 (figure 2), and 2.4 m from a wall on the opposite side. There is also a corrugated iron roof over the outlet, more than twice as high from the ground as the fan axis of rotation. Additionally, it has been experimentally confirmed from acoustic measurements that the auxiliary fan, shown in Figure 1, dominates the acoustic signature. For all subsequent acoustic measurements, the auxiliary fan is switched off. This limits the maximum volume flow rate that can be achieved through the test facility. Fan drive (rotational shaft, motor and belt) noise is quantified separately for the specific rotational speed at which fan noise is to be measured.
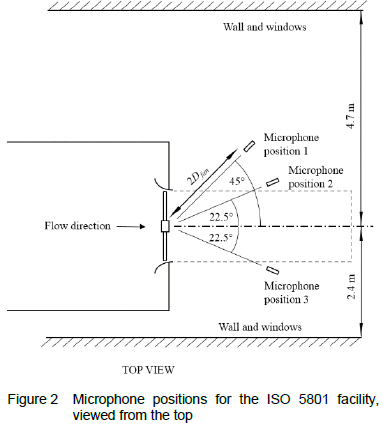
Three microphone positions are identified for the measurement of noise in the test facility. All three microphones are located on the fan pressure side, placed at the same height as the fan axis of rotation and at a radius of 2Dfan from the fan axis of rotation, orientated toward the fan axis of rotation as shown in figure 2. The number of positions were limited due to the rotational axis, belt and motor setup position, indicated by the grey dashed line in figure 2, and the proximity to walls.
3 Effect of reflections in the fan test facility
To quantify the effect of sound reflections due to the hard-walled surfaces surrounding the fan test facility, the free-field response of a known point source was measured in an anechoic chamber and in the fan test facility. 3. The sound source used is a Shox KTS-930 speaker. It is cylindrical in shape, and small, with dimensions of 10 x 10.4 x 20.5 cm and a weight of 0.4 kg. Due to this small shape, it approximates a point source. Compared to the B&K reference sound source Type 4204, for example, which has a height and diameter of 30 cm and a weight of 21 kg, the KTS-930 was thought to be better suited for the current application. It could be placed closer to the fan shroud, where the maximum fan noise is generated, with ease. The KTS-930 is also more readily available and affordable. Tone frequencies are selected digitally (recommended by AMCA 300-96 [6]) to ensure accuracy.
Sound pressure levels are measured with an NTi Audio M2230 microphone and a MA220 preamplifier, which is optimized for a flat, free-field response. Used in conjunction with a XL2 acoustic analyser, the sound level meter is classified as a Class 1 sound level meter according to IEC 61672 [7] and ANSI S1.4 [8] standards. This classification is also required by AMCA 300-96 [6], Reverberant Room Method for Sound Testing of Fans, although it is not directly applicable to this work. Before each set of measurements, the NTi Audio M2230 microphone and MA220 preamplifier are calibrated at 1000 Hz with a Larson Davis CAL200 calibration device which conforms to ANSI S1.40 [8], which is also a requirement of AMCA 300-96 [6].
First, the source, a loudspeaker, is characterised by measuring the free field response at pure 1/3-octave center frequency tones ranging from 100 to 20 000 Hz in an anechoic chamber (the lowest measurable frequency that the loudspeaker can produce is 100 Hz). The anechoic chamber is of the radio-frequency type as it is lined with pyramidal radiation absorbent material (RAM), however it also provides sufficient suppression of acoustic waves and has been used for this purpose in the past. Sound was measured at various frequencies. The effect of reflections on the measured sound is suspected to vary with frequency as the fan test facility is in close proximity to numerous flat reflective surfaces of a variety of materials, including glass, brick and mesh screens, along with metal structures such as the fan motor and rotational shaft (figure 3b).
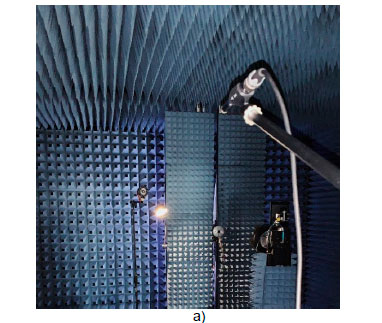

Both the source and microphone are placed at the same height from the ground as during fan noise measurements, and the distance between the source and microphone was 2Dfan. The floor of the anechoic facility is also lined with radiation absorbent material. The setup within the anechoic chamber can be seen in figure 3 a). Pure frequency tone noise is measured for each 1/3-octave frequency considered for a minimum of 30 seconds. Fan noise measurement standard such as AMCA 300-96 [5] typically require a minimum of 30 s for frequencies below 200 Hz, and 15 s for all other frequencies. Ambient noise measurements are taken before and after tone noise measurements.
Background noise is corrected for by logarithmic subtraction of ambient noise from measured sound pressure levels [6]:
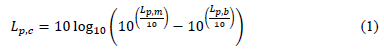
where c refers to the corrected SPL, m to measured SPL and b to background SPL.
For the fan test facility, for each microphone position indicated in figure 2, the loudspeaker is placed at three different positions on the inside of the bellmouth. The microphone is not placed closer to the fan axis as most of the noise generated by a fan in operation would be near the blade tips. The microphone remains directed towards the fan axis of rotation, while the loudspeaker is oriented toward the microphone (see for example figure 4b, showing the orientation of the loudspeaker at position 3). From AMCA 300-96 [6], for fan noise measurements in a reverberant room, the microphone transverse plane may not be parallel within 10° to any room surface, which is also conformed to in this setup.


At microphone position 1 and 2, the loudspeaker at position 1 is partially shielded due to the fan rotational shaft (see figure 3b). This is also the case at microphone position 3 and loudspeaker position 2. These cases were considered to include the effect of an obstruction directly in the acoustic wave path between the loudspeaker and microphone.
The sound level is measured at the same pure 1/3-octave center frequencies for each loudspeaker and microphone location, for the same loudspeaker loudness as in the anechoic chamber measurements. The sound levels measured in the fan test facility were slightly adjusted from 2Dfan to compensate for the distance between the loudspeaker and microphone. For each set of loudspeaker and microphone positions, the ambient sound level is also measured.
The ISO 1996-2:2007 standard [9] describes the increase of the sound pressure level if a microphone is placed on or near a reflecting surface as opposed to in the free field where no reflecting surfaces other than the ground may affect measurements. According to the standard, for a microphone directly on a reflecting surface, the SPL increases by 6 dB compared to the free-field level. Similarly, for a microphone near a reflecting surface, the SPL increases by 3 dB. Memoli et al [10] investigated the applicability of these corrections for reflections of road traffic noise on facades. The sound level measurements of the free-field reference measurements were subtracted (not logarithmically) from sound level measurements near different facades to determine correction factors. The same approach is followed in this work.
For frequencies below 200 Hz, the background noise in the fan test facility was too high to see a clear peak in tonal frequency. The effect of reflections on sound level measurements is thus only valid from 200 Hz to 20 000 Hz.
As examples, in figure 5a and b, the loudspeaker emits noise at a tone frequency of 500 Hz and 3150 Hz, respectively. The sound level measurements are shown in 1/3-octave band frequencies for the microphone at position 3 ('M3') and the loudspeaker ('L') at all three positions. The tonal peaks at these frequencies clearly dominate the measured spectra. From each set of measurements such as in figure 5a and b, only the tone frequency of each measurement is considered henceforth. The ambient noise is logarithmically subtracted from the acoustic source noise for fan test facility and anechoic chamber measurements following equation (1).


Thereafter, considering only the tone frequencies emitted during each measurement, the anechoic chamber sound level is subtracted logarithmically from the fan test facility sound level. The logarithmic mean of this difference at each microphone position is found from all three loudspeaker positions:
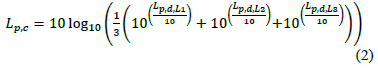
where d refers to the difference between background corrected anechoic chamber and test facility measurements, and the L refers to the loudspeaker position.
The resulting difference in SPL from free-field conditions due to reflections in the fan test facility can be seen for each microphone position in figure 6. This difference can be used to correct measurements taken in the fan test facility to eliminate the effect of reflections and make measurements equivalent to the measurements taken in the free field. The method of calculation is equivalent to taking the logarithmic mean of the measurements at each microphone position for all three loudspeaker positions in the fan test facility. The difference between these averaged measurements and the anechoic chamber measurements is the correction factor in figure 6.
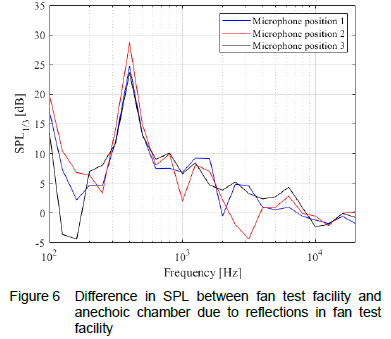
The most notable effect of reflections occurs in the 400 Hz 1/3-octave frequency band. This frequency corresponds with an acoustic wavelength of 0.86 m. Although none of the surfaces are this exact distance from the source, it is believed that the complex interaction of reflected waves in all directions at this wavelength causes the reflection. The microphone at position 2 is most affected by reflections at this frequency. While it is not the closest to a wall (microphone position 3 is) it is oriented toward the wall, while at position 3, it is oriented away from the closest wall. At 1/3-octave band frequencies above 1600 Hz, the difference in SPL is below the maximum of 6 dB stated by the ISO 1996-2:2007 standard [9], and further decreases toward high frequencies. Interference effects from the various reflective surfaces are thus most prominent at lower frequencies, corresponding to the hypothesis of Memoli et al. [10].
4 Uncertainty analysis of noise measurements in the fan test facility
The accuracy of mechanical measurements is defined by the closeness of the measurement to its exact or 'true' value. Measurement error is a property of any measurement and can be systematic or random. A systematic error remains constant under fixed operating conditions, while random errors are a scatter of measured data. An estimate of the range of probable error is assigned a value known as the uncertainty, which is a property of the result [11]. Random error is the standard deviation of measurements, as the averaging of measurements are not for an infinitely long measurement time [12]. Random errors can be modelled as a Gaussian distributed random process, the error being symmetric around the true value. In acoustical standards, uncertainty of measurements is indicated by ±2a (where a is one standard deviation) which translates to a 95.4% probability (confidence interval) that the measurement will be within ±2a from the true value [9]. The number of standard deviations is known as the coverage factor, k. A standard uncertainty refers to uncertainty within one standard deviation. The total uncertainty is given as the root sum of squares of all components of standard uncertainty [11]:

The total uncertainty for a coverage factor of k is:

In the acoustic measurements in this study, the NTi Audio M2230 microphone and MA220 preamplifier are calibrated before each measurement set with a Larson Davis CAL200 calibration device, minimising possible bias error due to calibration errors.
A random source of error is the effect of the possible variation in distance between the source and microphone. The shortest distance between a microphone position and the fan exists between microphone position 1 (figure 2) and the fan tip in the plane of measurement. This distance is 2.6 m, for which a variation of 0.05 m is accounted for with a coverage factor of 1 due to distance measurement errors. The upper and lower limits of uncertainty are calculated as:

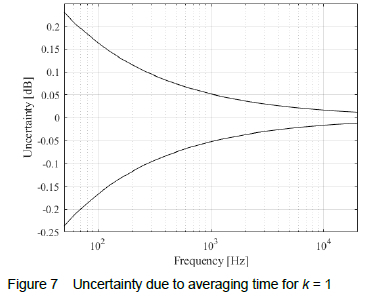
which result in uncertainties of 0.083 dB and 0.084 dB, of which the larger value is chosen as the final uncertainty for the component [13]. This uncertainty is valid for frequencies at which the axial fan can be seen as the main noise source. Another component of random error identified in these measurements is due to the finite measuring time of the noise. This error is a function of the averaging time and frequency, which is calculated in decibels as:

where B is the bandwidth of the 1/3-octave frequency considered, T is the measurement time and 2BT is the number of statistical degrees of freedom [9]. A condition for the use of equation (6) is:

The minimum measurement time was 30 seconds. The resulting uncertainty as a function of frequency for a coverage factor of 1 is shown in figure 7. The lower limit is slightly larger in absolute magnitude than the upper limit and is thus the chosen uncertainty limit for this source of error.
From the manufacturer, the frequency response flatness of the MA220 preamplifier is ±0.2 dB. The microphone frequency response sensitivity is a function of frequency and is included in its datasheet and total uncertainty calculation.
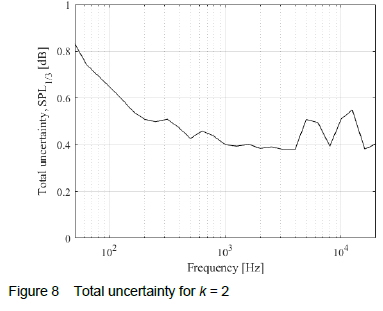
Further, uncertainty due to reflection in the test facility is compensated for by correction factors, in which the acoustic measurements have the same uncertainty as in the fan noise measurements. The total uncertainty for k = 2 is shown in figure 8. Each component of uncertainty is added twice, to compensate for the measurements obtained for the reflection correction factors (of which the measurements are discussed in the previous section) which are subtracted from the measured fan noise. It should be noted that the fan noise measurements are only valid up to 5000 Hz. At higher 1/3-octave frequencies, the rotational shaft, belt and motor noise affect the measured SPL spectra substantially. Additionally, as discussed in section 3, it is found that an accurate representation of noise reflections can only be determined for frequencies above 200 Hz. Therefore, it is established that the measurements are repeatable and reproducible for frequencies higher than 200 Hz.
5 Conclusions and recommendations
The effect of reflections in an axial fan performance test facility is quantified to enable accurate fan noise measurements, without modification of the test facility. This method describes how to quantify the effect of reflections, to see whether the test facility reflects more than 4 dB of sound, in which case the ISO 3744 standard [1] is not applicable. The effect of reflections is measured at three microphone positions and three loudspeaker positions. Measurements of the same source at the same loudness, with the same loudspeaker and microphone in an anechoic chamber are used to quantify the effect of reflections.
The ISO 1996-2:2008 standard [9], which describes the assessment and measurement of environmental noise, is used as reference to compare the results. In this standard, the increase of the sound pressure level is described in the instance that a microphone is placed on or near a reflecting surface as opposed to in the free field where no reflecting surfaces other than the ground may affect measurements. The effect of reflections decreases as frequency increases. According to the standard, the SPL is increased by 6 dB due to reflection of sound waves if a microphone is placed directly on a reflective surface, and 3 dB for a microphone near a reflecting surface. On average, for the three microphone positions, reflections cause a 5.65 dB increase at a frequency of 1000 Hz, and even more at lower frequencies. Even though the microphone is not placed directly onto a surface in this setup, it shows the magnitude of the effect of reflections due to the numerous reflective surfaces in the test facility. The effect of reflections decreases at higher frequencies due to the shorter wavelengths, and it is 1.52 dB at a frequency of 5000 Hz.
It is shown that following the ISO 1996-2:2008 standard [9] in applying a maximum correction factor of 6 dB (when the microphone is placed directly on the reflective surface) underestimates the effect of sound reflection in the very low frequency range. Therefore, each test facility in which fan noise measurements are taken should be characterised for sound reflections at each 1/3-octave frequency, independently.
The most notable effect of reflections occurs in the 400 Hz 1/3-octave frequency band. The frequencies associated with the wavelengths of 4.7 m and 2.4 m (the distances between the fan axis of rotation and the closest walls) are 72.97 Hz and 142.92 Hz. The distance between the shroud, where the loudspeaker is placed, and the fan axis of rotation is approximately 0.77 m, corresponding to 444.88 Hz. This confirms why the effect of reflections is highest at the lower frequencies.
However, the correction proposed in this work is found to result in reasonable corrected measurements of fan noise, and the uncertainty in measurements is minimal (below 0.55 dB for frequencies above 200 Hz). It is suggested that in future, the walls and windows surrounding the test facility, the corrugated iron roof over the test facility, and the fan motor and belt be covered in anechoic material such as acoustic wedges to reduce reflections. Acoustic isolation of the fan drive system is also suggested. Another option is to acoustically isolate the inside of the plenum chamber, and placing the microphone inside the plenum instead, such as was done by Zenger et al [3]. Once this is done, the fan test facility can be recharacterised for the effect of sound reflections using the same methodology. This method of determining test facility sound reflections and a corresponding reflection correction can be applied to other facilities following a similar approach.
References
[1] International Standards Organization. Acoustics -Determination of sound power levels and sound energy levels of noise sources using sound pressure -Engineering methods for an essentially free field over a reflecting plane. ISO 3744:2010, 2010.
[2] F. Holste and W. Neise. Experimental comparison of standardized sound power measurement procedures for fans. Journal of Sound and Vibration, 152(1):1-26, 1992.
[3] F. Zenger, C. Junger, M. Kaltenbacher, and S. Becker. A Benchmark case for aerodynamics and aeroacoustics of a low pressure axial fan. SAE Technical Paper, 2016-011805, 2016.
[4] International Standards Organization. 2017. Fans - Performance testing using standardized airways. ISO 5801:2017.
[5] F. G. Louw. Investigation if the Flow Field in the Vicinity of an Axial Flow Fan During Low Flow Rates. PhD Thesis, Department of Mechanical and Mechatronic Engineering, Stellenbosch University, South Africa, 2015.
[6] Air Movement and Control Association International, Inc. Reverberant Room Method for Sound Testing of Fans. AMCA 300-96, 1996.
[7] International Electrotechnical Commission. Electroacoustics - Sound level meters - Part 1: Specifications. IEC 61672-1, 2013.
[8] American National Standards Institute. 1983. Specifications for Sound Level Meters. ANSI S1.4.
[9] International Standards Organization. Acoustics -Description, assessment and measurement of environmental noise - Part 2: Determination of environmental noise levels. ISO/FDIS 1996-2, 2007.
[10] G. Memoli, M. Paviotti, S. Kephalopoulos, and G. Licitra. Testing the acoustical corrections for reflections on a facade. Applied Acoustics 69(6):479-495, 2008.
[11] R. S. Figliola, and D. E. Beasley. Theory and Design for Mechanical Measurements. Wiley, 6th edition, 2015.
[12] C. J. Struck. Measurement uncertainty and its application to acoustical standards. In Proceedings of Meetings on Acoustics, Vol 21, No 1, New Orleans, Louisiana, 2017.
[13] L. Hannah, W. Page, and S. McLaren. An introductory guide to uncertainty in acoustic measurements. New Zealand Acoustics 30(3):6-25, 2017.
Received 9 December 2021
Revised form 31 May 2022
Accepted 13 June 2022

