


Services on Demand
Article
 English (pdf)
 Article in xml format
 Article references
Indicators

Related links
-
 Cited by Google
 -
 Similars in Google
Share

 Permalink
R&D Journal
On-line version ISSN 2309-8988
Print version ISSN 0257-9669
R&D j. (Matieland, Online) vol.37 Stellenbosch, Cape Town 2021
http://dx.doi.org/10.17159/2309-8988/2021/v37a9
ARTICLES
Investigating an Inverse Finite Element Approach for Characterising Soft Materials
F. H. BreslerI; J. H. MüllerII; G. VenterIII
IDepartment of Mechanical and Mechatronic Engineering, Stellenbosch University, South Africa. E-mail: francefh@gmail.com
IIDepartment of Mechanical and Mechatronic Engineering, Stellenbosch University, South Africa. E-mail: cobusmul@gmail.com
IIISAIMechE member. Department of Mechanical and Mechatronic Engineering, Stellenbosch University, South Africa. E-mail: gventer@sun.ac.za
ABSTRACT
Soft materials, such as soft biological tissue and soft silicone rubber, are non-linear materials which require the classical uniaxial and biaxial tensile testing methods for characterisation. Unfortunately, in special cases, such as for soft biological tissue, the samples are smaller than 10 mm χ 10 mm in size and these classical tensile testing methods produce unwanted stress and strain gradients due to the fastening techniques associated with these methods. Micro-indentation is proposed as an alternative method for characterising soft materials. Using inverse Finite Element (FE) analysis and a known Mooney-Rivlin three parameter material model, six different micro-indentation tests were proposed. A theoretical approach was used to determine which indentation test best characterised a silicone sample, by using two FE models. The results showed that microindentation is capable of characterising a soft material in ideal conditions with a cylindrical indenter applied in a diagonal orientation over the sample, as the best indentation method. Finally, it was observed that the material model can either match the displacements with the smallest objective function or the stress vs. stretch curve can be matched to 99 % over the whole stretch range but not both simultaneously.
Additional keywords: Inverse Finite Elements analysis, Micro-indentation, Gradient optimisation, Mooney-Rivlin hyper-elastic material model.
1 Introduction
Traditional uniaxial and biaxial tensile tests have shown to deliver sub-optimal results within small scale soft material samples such as biological tissue with sizes smaller than 10 mm χ 10 mm [1]. These methods make use of clamps or hooks to secure the material samples onto the testing rig, which leads to inaccurately derived stress and strain results due to the undesired stress concentrations obtained through these fastening techniques [1]. Micro-indentation is an alternative method for characterising soft materials to improve the non-linear response through inverse Finite Element (FE) methods [2]. The shape and size of the indenter depends on the modulus of the material as well as the sample size. Circular and spherical indenters are widely used during micro-indentation tests on soft materials [3], [4], and acceptable results have been obtained with these indenters [5] - [7].
Liu et. al. [8] proposed that softer materials with a decrease in modularity, such as biological tissue, will obtain better results using a nano-indenter and that stiffer materials with higher modularities, such as silicone rubber, obtain better results using an indenter size of approximately 2 mm in diameter. The natural curvature of circular and spherical indenters causes a more complex deformation mode, which is beneficial for local material characterisation within anisotropic materials such as biological tissue [9]. Within soft isotropic materials such as silicone rubber, the complex deformation can improve the non-linear response of the material [9]. This paper investigates possible inverse indentation tests to obtain a non-linear isotropic material model for soft materials, focusing on using simulation-based procedures and improving their accuracy. Different indenter shapes, their orientation and number of indenters were investigated as possible factors for improving the non-linear material response.
Soft materials are characterised as hyper-elastic and incompressible, causing the non-linear behaviour between load and deformation. Among the various hyper-elastic material models the Mooney-Rivlin, Ogden and Neo-Hookean models are the most used material models for soft materials [10]. There is no clear distinction which material model performs the best; therefore, each hyper-elastic material needs to be tested for various material models to determine which describe the material response best. The Mooney-Rivlin model serves as the popular choice for new experimental procedures as it has proven to give reasonably accurate results with the least computation time [7], [10].
FE analysis with its convenience of replicating large scale designs in a small-scale environment, also encounters some drawbacks. Non-linear hyper-elastic soft materials experience element distortion due to large deformations during analysis and can cause an increase in computation time, failed analysis and less accurate results. Two methods exist in rectifying this problem, either smaller elements can be used or remeshing can be applied. Inverse FE analysis have become a popular method in characterising materials. The method relies on the accuracy of replicating the physical test within the FE model. Through optimisation the best material model parameters can be obtained by minimising the difference between the FE model and the physical test. Viljoen [11] used inverse FE analysis and the Mooney-Rivlin hyper-elastic material model to characterise a soft silicone rubber through uniaxial and biaxial tensile tests and the inverse bubble inflation test. Using the full field displacements of the physical samples and replicating the physical experiments within FE analysis, the material models were determined with success by optimising the parameters of the material model, through minimising the difference in the deformation fields.
This paper aims to develop an inverse FE approach for characterising soft materials on mm scale samples, using micro-indentation and simulation-based analysis. The results from an FE analysis, for each indentation test, with an assumed Mooney-Rivlin material model is used as a substitute for experimental results for the various indentation tests. A non-linear, isotropic silicone rubber was used as a test material in order to test the integrity of the method in an assumed ideal case and conditions. If analogous material models are obtained with each inverse indentation test, it can be concluded that the respective indentation test is capable of characterising soft materials.
2 Methodology
It is important to understand the inverse indentation tests, their capabilities and variability factors. The indentation methods used within this paper were completely simulation-based with no physical tests and real time data. The simulation-based procedure gives a better understanding what factors cause a difference within the test results in an assumed ideal case. If the indentation methods are able to reproduce a hyper-elastic material model from an assumed ideal material, demonstrates that the indentation methods are capable of characterising a soft material. Once this has been proven, it can be further validated with physical tests.
A simple indentation procedure was developed for each indentation test. The cylindrical indenters had a diameter of
3 mm and a length of 30 mm and the spherical indenters were sized at 3 mm in diameter. Each indentation test was performed on a square material sample of size 20 mm (l) χ 20 mm (w) x 5 mm (d). Indenter placement was simulated by a linear position ramp function to apply a 3 mm/s on the sample. The simulation variables included: the orientation and number of indenters for the cylindrical indenter tests, and the number of indenters for the spherical indenter tests.
Viljoen[11] characterised a soft silicone rubber, Smooth-Sil 950 [12], which is typically used for soft robotic applications. The Ogden three parameter model and both the Mooney-Rivlin two and three parameter models were used as the hyper-elastic material model for characterisation. The study concluded that the Mooney-Rivlin three parameter material model was the best option for characterising this soft silicone rubber, and it was therefore decided to use the Mooney-Rivlin three parameter model in the present study.
The indentation tests presented are considered as uniaxial compression loading cases, which causes a multi-axial response due to the form and size of the indenters. In a uniaxial tensile case for an incompressible material, the Mooney-Rivlin three parameter model can be expressed through the engineering stress σε (λ) and stretch λresponse of the material by eq. 1. The material model can be extrapolated to the compression region to investigate a different mode shape. The degree of compression can thus be expressed through stretch in eq. 2.
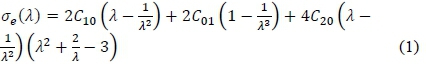
with C01, C10 and C20the material model parameters.

where h0is the initial height of the sample and h is the height at that instant during any point of the compression analysis [13].
The multi-axial response can be described with a combination of both a uniaxial compression and tension case, through the stretch parameter. Stretch is the deformation (compression or tension) within the principal directions and is therefore directly associated with the principal strains through eq. 3. The minimum and maximum principal strains were captured within the FE analysis for each nodal point in the indentation test. Therefore, an approximate strain and stretch range for which the indentation test characterised the silicone sample could be calculated. The relationship between the minimum/maximum principal strain and indentation depth curve, were obtained from the node with the smallest minimum principal strain and the node with the highest maximum principal strain, respectively.

where εi is the ithprincipal strain within a Cartesian coordinate system.
Using eq. 2, the smallest stretch experienced by a circular indenter with an indentation depth of 3 mm, is 0.4 stretch. Viljoen [11] found that the approximate maximum stretch obtainable for the Smooth-Sil 950 silicone rubber, was 2.5 stretch. The material model within this paper will be extrapolated in an ideal uniaxial test case for a stretch range of 0.4 to 3.0 stretch, using eq. 1. This is to determine how well the material models obtained by the FE analysis, predict the engineering stress vs. stretch response.
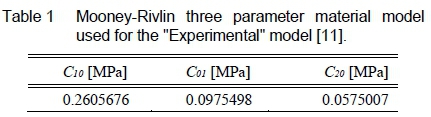
Two non-linear FE models were created for each indentation test using MSC Marc Mentat (2019). The "Experimental" model for each indentation test, had the same Mooney-Rivlin material model shown in table 1. Viljoen [11] concluded that the coefficients presented in table 1 predicted the experimental results the best. By using the same material model for each "Experimental" model allows for a baseline between each indentation test to determine which indentation method produces the best results.
The second FE model, the "Numerical" model, for each indentation test consisted of an assumed Mooney-Rivlin material model. The aim of the optimisation procedure is to obtain a material model for the "Numerical" model so that the results fit the results obtained from the "Experimental" model. The quality of fit between the two models after optimisation, determines if the specific indentation test is capable of characterising the silicone rubber.
A numerical pipeline was developed for the optimisation procedure. Python was used within Visual Studio Code to develop and control the numerical pipeline. Vanderplaats Research & Development Inc. [14] Design Optimization Tools (DOT) was the optimisation library used within the inverse method. DOT is a gradient based optimisation toolbox developed for engineering applications. Both the Sequential Quadratic Programming (SQP) and Sequential Linear Programming (SLP) constraint optimisation algorithms were used. This library was obtained as a wrapper to use within Python as an efficient optimiser. The aim of the numerical pipeline was to link the pre- and post-processing data to and from the FE models in Mentat, with the DOT optimisation toolbox within Python. This was possible with the software specific Python API files provided by Marc, which allows easier access between the pre- and post-files written to and from Mentat.
3 Non-linear Finite Element Analysis
Large deformations with a non-linear hyper-elastic material cause frequent complications with distorted elements in a FE analysis. An easy solution is to reduce the mesh size and increase the number of elements as well as the number of nodes. Remeshing was applied within the FE analysis of this study to improve element distortion and to keep the computation time as low as possible.
Second-order isoparametric tetrahedron (tet10) elements were used to define the mesh within the FE models. Solving tet10 elements with the remeshing feature causes one critical limitation, nodes cannot be tracked to obtain data for post processing calculations. This leads to a different method of applying boundary conditions, instead of specifying the boundary conditions through the nodes, they are applied through contact bodies. A solution was required to track relevant nodes for data capturing. This was achieved by using a glue contact constraint to glue four-noded, isoparametric, arbitrary quadrilateral membrane elements to the desired surface for data capturing. The remeshing feature are not applied to these elements, therefore the nodes can be used for data capturing. This layer of membrane elements is referred to as the "skin" elements throughout the study.
It is expected that future work might implement the indentation methods investigated within this paper, with experimental work where the displacement data is captured through DIC. It was therefore decided to use a finer mesh for the "Experimental" model to represent the larger quantity of data points obtained from DIC. The approach and numerical pipeline developed in this study can be used in future work by replacing the "Experimental" model with DIC data.
Initial convergence studies confirmed that for the "Experimental" models, a starting element edge length of 1.5 mm and a minimum remeshing element edge length of 0.9 mm for the tet10 elements are sufficient in obtaining acceptable results. The membrane elements were modelled with an element edge length of 0.25 mm with a thickness of 0.001 mm. This "skin" layer of membrane elements was modelled so thin to ensure these elements do not add any stiffness to the sample and influence the results. The "Numerical" models were modelled with an element edge length of 2 mm for the tet10 elements and a minimum remeshing element edge length of 1 mm. The membrane elements were modelled with an element edge length of 0.5 mm and a thickness of 0.001 mm.
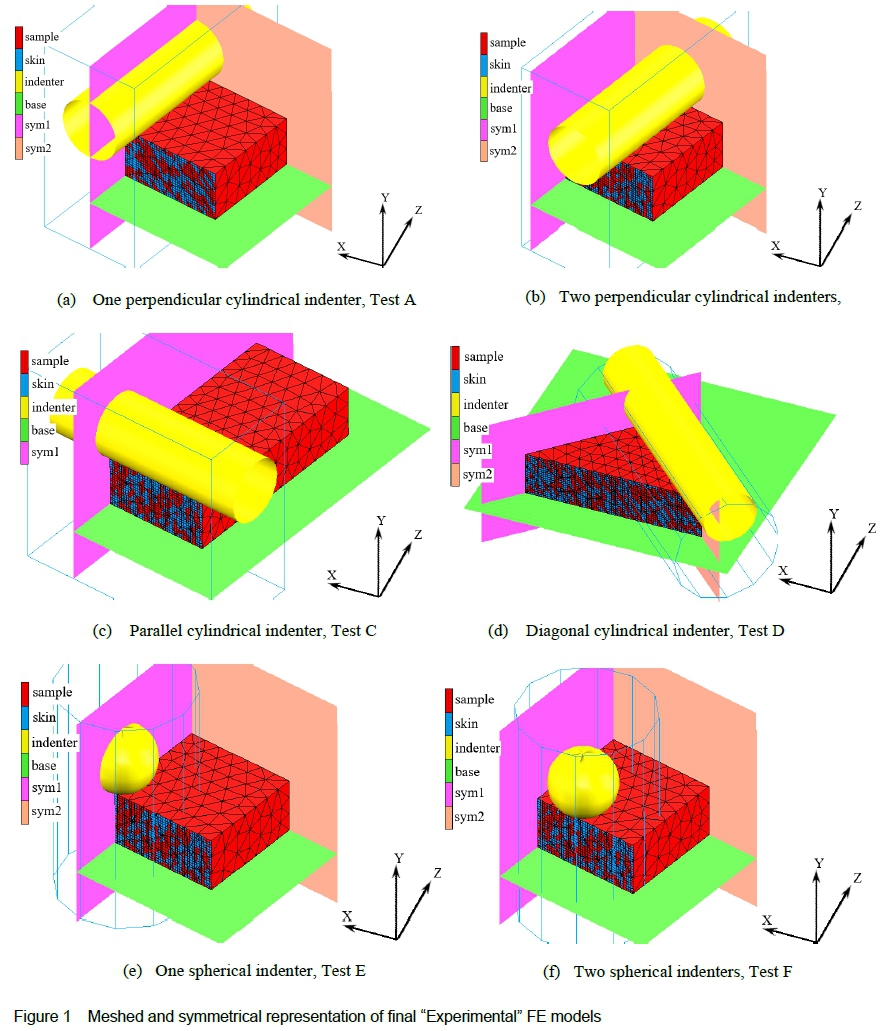
Figures 1a - 1f represent the final six "Experimental" FE models which were optimised during this study. The "Numerical" FE models are exactly the same but consist of coarser meshes. The front surface of the sample, represented by the "skin" elements, is the surface for data capturing. The surface is located within the XY - plane at Ζ= 0.
The XY - plane serves as the parallel plane and the ZY - plane serves as the perpendicular plane, to the frontal surface used for data capturing. The different indentation tests are referred to the orientation of the indenter within the respective plane it is applied in, compared to the surface used for data capturing.
In figures 1a - 1f the applied boundary conditions and constraints are visualised. A linear position ramp function of 3 mm/s is applied in the negative Y - direction to the yellow geometric contact body indenters. A touching constraint is applied between the indenter and the red meshed sample to specify that the indenter is applying an indentation. The green bases are specified as fixed geometric bodies with a glue constraint between the base and the sample. This represents that the sample is fixed to a base to restrict movement of the sample as the indentation is applied. Future work can use means of surgical glue or rough sandpaper to fix the samples to the physical testing rig. Symmetry constraints were applied to each indentation test to reduce the computation time within each FE analysis. Symmetry surfaces were created and specified as symmetry contact bodies, which contains the necessary touching contact conditions. The red tet10 elements represent the silicone rubber sample, specified as a deformable contact body which are allowed to be remeshed during the FE analysis. The cylindrical/box shaped wire frames around the indenters, specify the regions of the sample allowed to be remeshed. The blueish hue membrane elements glued to the side of the sample in the XY - plane, represent the surface of the sample used for data capturing. These elements are also modelled as deformable contact bodies but are specified not to be remeshed.
4 Optimisation
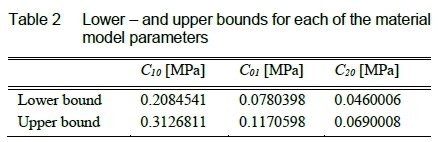
The inverse method utilises an optimisation algorithm in order to determine the material models for the "Numerical" FE model. The two gradient based optimisation algorithms used in this study (SQP and SLP) determines the optimum material model parameters, from random starting points, within a specified upper and lower bound serving as side constraints. The upper and lower bound for each Mooney-Rivlin coefficient, given in table 2, were obtained by adding and deducting 20 % from the coefficients used for the "Experimental" model in table 1. The optimisation algorithm aims to minimise the objective function until a local minimum is reached. The global minimum can be obtained by running more than one gradient optimisation from multiple starting points and ultimately obtain the material model for the silicone rubber from the multiple solutions.
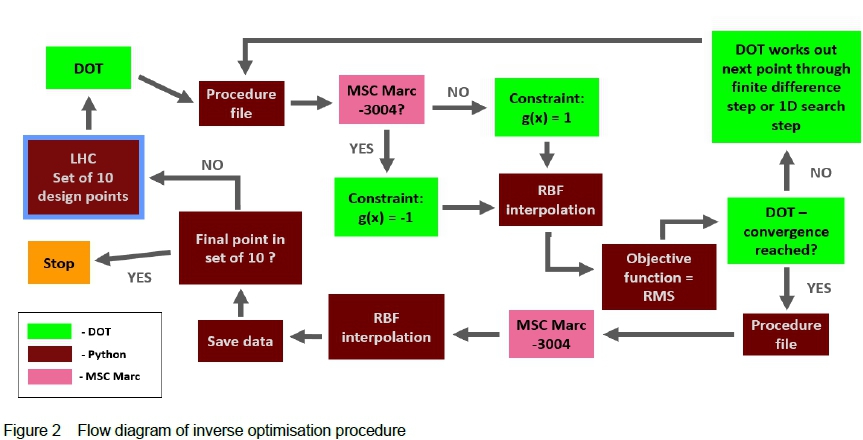
The inverse optimisation procedure, visualised in figure 2, starts with the multiple starting points obtained using a Latin Hypercube (LHC) design of experiments. A Python library named Design of Experiments for Python (pyDOE), was used to obtain optimally spaced design points within the upper and lower bounds from table 2. A set of ten design points were obtained for each indentation method to be optimised. The same set of ten design points were optimised using the SLP and SQP algorithms respectively, resulting in 20 different solutions for each indentation method. The procedure continues by taking the first starting point (the Mooney-Rivlin coefficients C01, C10 and C20) and giving them to DOT as the variables to be optimised, along with the optimisation algorithm to be used.
A Marc procedure file is then created in Python, which changes the Mooney-Rivlin coefficients in the "Numerical" FE model to the first starting point. Using the procedure file, the "Numerical" model is calculated within Marc and the post processing files saved for further analysis. In order for the optimisation algorithm to work effectively, it is necessary to determine if the "Numerical" FE model obtained a successful analysis with the given material model, therefore one constraint was specified, i.e. the Marc exit number must equal 3004. A true-false boolean was used to control the constraint within the optimisation procedure. The constraint was adhered to if the Marc exit number equalled 3004 and the algorithm was fed -1; the constraint was violated if any other value was returned by the Marc exit number and the algorithm was fed 1. Gradient based optimisation algorithms will normally pose a problem with such a boolean constraint, but DOT was specifically designed to serve as an efficient engineering optimiser; therefore, DOT backtracks within the one-dimensional search when a constraint is violated, until a new feasible point is obtained. This method allows DOT to deal with boolean constraints without encountering any problems.
Displacement data is used to calculate the objective function by comparing the results for the "Numerical" model with the results from the "Experimental" model. The difference in mesh size between the two FE models and the use of remeshing, cause that the nodal locations and number of nodes differ between the results. It is therefore necessary that the nodal displacements obtained from the "Numerical" model be interpolated to the same nodal locations as the "Experimental" model's nodal displacements during the "RBF interpolation" step. Firstly, linear interpolation was used to interpolate the "Numerical" model's results to the corresponding time increment obtained by the "Experimental" model using eq. 4 and eq. 5. At each time increment m the indenter is at a depth hmwith a maximum indentation depth of hM= 3 mm. Therefore, there exist a direct correlation between the indentation depth hmand the time increment.
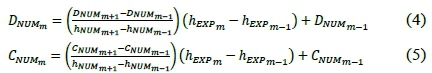
where D is the X -, Y - and Z - displacement at increment m, C the X -, Y - and Z - coordinate at increment m and h the indenter level at increment m.
Further interpolation involved using Radial Basis Functions (RBF) to interpolate the nodal displacements within the "Numerical" model to the same nodal locations as the "Experimental" model's nodal displacements. The Python library SciPy, was used to implement the RBF interpolation with the rbf function [15].
The Root Mean Square (RMS) error calculates the error between the "Numerical" model and the "Experimental" model by comparing the nodal displacements. The error is used as the objective function for the optimiser and gets minimised as the algorithm searches for the ideal material model.
Non-linear FE analysis solve the simulated model iteratively in Μ number of increments, represented as m = 1,M. For each FE increment m, an RMS error is calculated for each displacement direction shown in eqs. 6 - 8.
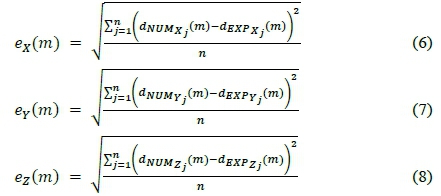
where the total number of nodes are represented as j = l ,n in the increment m.
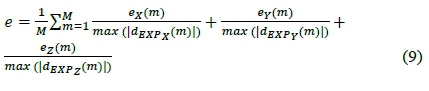
A total of Μ RMS errors are calculated for each direction. A single RMS value can be obtained by summing all the RMS errors together, but it causes a bias in the objective function. The bias was minimised by normalising each direction's RMS error at each increment m, with the maximum absolute displacement value experienced by the "Experimental" model within the direction at increment m. Eq. 9 represents the single normalised and summed RMS value e, which describes the entire fit between the known Mooney-Rivlin material model from the "Experimental" model and the attempted material model from the "Numerical" model.
The final optimisation problem is therefore stated as: minimise : e
such that : Marc Exit Number = 3004 (10)

Further, DOT uses the calculated RMS error to evaluate if convergence was reached according to a series of built in criteria [14]. If convergence was not reached, the next point of parameters are calculated and the whole process starts again from the procedure file. If convergence was reached, the point containing the converged parameters are used to run the "Numerical" model and obtain the final results. The next starting point in the set of ten, obtained by the LHC model, is then used to be optimised with the whole procedure explained above. After the final starting point in the set of ten is optimised, the whole procedure is stopped to further evaluate which of the ten solutions obtained the best results.
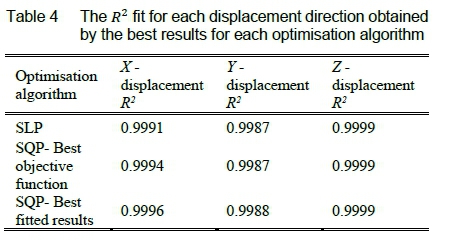
The R2error will serve as a validation measure to determine if the material model obtained by each indentation test successfully characterised the silicone sample. An R2 > 0.9500 error value needs to be obtained by the displacements to be classified as an acceptable fit. The principle strains need to obtain an R2 > 0.9000 to be classified as acceptable results.
5 Results
Each indentation test performed ten optimisations with both the SLP and SQP algorithms, in total adding to 20 optimisation runs per test. All six indentation tests successfully characterised the "Experimental" model with 99 % in all three displacement directions, using the SQP optimisation algorithm. Only five out of the six tests successfully characterised the "Experimental" model, using the SLP optimisation algorithm, with 99 % in all three displacement directions, with indentation test C as the test which failed the validation criteria by only matching the Y - direction with 93.5 % . Indentation test D proved to be the best test, using both the SQP and SLP algorithms the smallest objective function was obtained each time. The results for indentation test D will be analysed and discussed further in this section.
Figure 3 visualises the objective function obtained by the 20 optimisation runs using both the SLP and SQP algorithms for indentation test D respectively. An interesting observation is that the SLP algorithm obtained the same objective function for each optimisation run, which also resulted in the same material model parameters. This happened for each of the other indentation tests as well, resulting in the same results regardless of the indenter shape, orientation, number of indenters or starting point used. The SQP algorithm however delivered different results for each optimisation run, providing more meaningful information for conclusions. From figure 3, optimisation run 10 of the SQP algorithm obtained the smallest objective function, therefore reasonably being the optimisation run with the best results. Although, optimisation run eight proved this might not be the case.
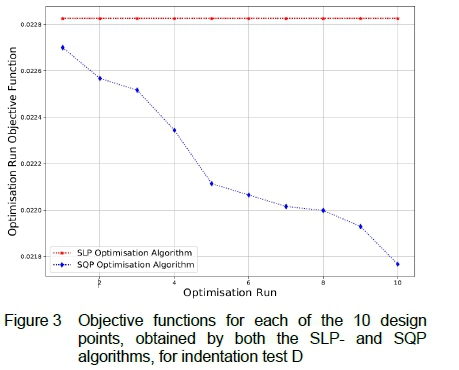
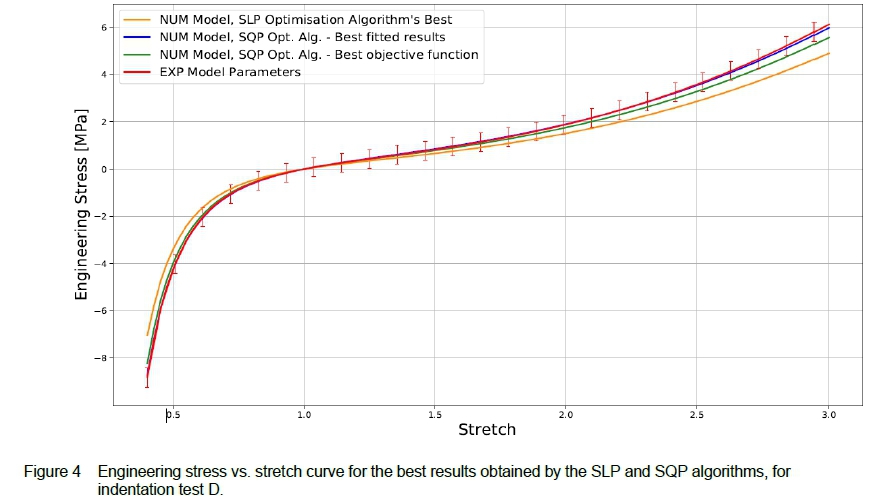
Figure 4 illustrates the engineering stress vs. stretch curve for the material models obtained by the SLP algorithm and optimisation run 10 and eight for the SQP algorithm. The SLP algorithm might have provided nearly perfect fits for each displacement direction with 99 % but was only able to fit the "Experimental" model's engineering vs. stretch curve within one standard deviation for a range of 0.75 - 2.0 stretch. Optimisation run 10 from the SQP algorithm obtained the best objective function, but compared to the "Experimental" model's engineering vs. stretch curve, a decrease in accuracy was observed within the tension region within one standard deviation and failed to fit the "Experimental" model above 2.7 stretch. Optimisation run eight with a larger objective function than optimisation run 10, was able to fit the "Experimental" model's engineering vs, stretch curve with 99 % over the whole stretch range, making it the best fitted results model. This unexpected observation was further investigated with table 3.
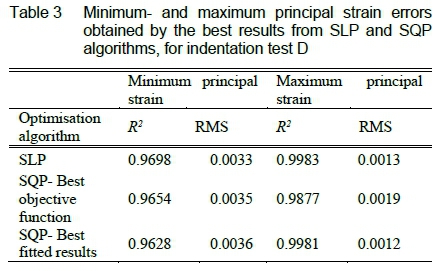
The R2fit and RMS errors from table 3 for the minimum and maximum principal strains provided the same interesting results observed within the engineering vs. stretch curve. It would have been expected that optimisation run 10 from the SQP algorithm, with the best objective function, would have obtained the smallest errors, but on the contrary obtained the largest errors for both the minimum and maximum principal strains. Whereas the SLP algorithm, with the largest objective function, obtained the smallest errors for both the minimum and maximum principal strains.
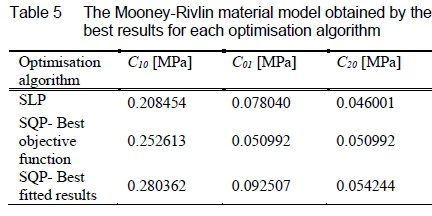
Table 4 and table 5 summarise the R2fit and Mooney-Rivlin material model obtained by the SLP algorithm and optimisation run eight and 10 for the SQP algorithm respectively. Two observations can be made from this table, firstly; optimisation run eight proved to be the best fitted results model using figure 4, even though it did not obtain the best objective function, but did however obtain the best R2fit results for each displacement direction. Secondly, from the three material models obtained by the different optimisation algorithms and optimisation runs, a large difference is observed within each material model parameter. The Mooney-Rivlin material model is a curve fitting function, therefore it is expected to obtain multiple sets of material parameters.
6 Discussion and Conclusion
Six different micro-indentation tests were conducted in an inverse FE approach using two FE models to characterise a soft silicone rubber.
The FE model's material response was described using the Mooney-Rivlin three parameter material model. The inverse FE analysis aimed to obtain a set material parameters for each indentation test's "Numerical" model, to fit the "Experimental" model's results. Both the SLP and SQP constraint gradient based optimisation algorithms were used within the optimisation procedure of the inverse method. The engineering stress vs. stretch curve for each material model obtained by the optimisation algorithms, were predicted using the Mooney-Rivlin three parameter constitutive equation for a uniaxial compression case. The multi-axial response for each indentation test was represented by the minimum and maximum principal strains vs. indentation depth, respectively. The final test results concluded that using a cylindrical indenter, which applies a uniaxial load in a diagonal fashion across the test sample, indentation test D, will obtain the best Mooney-Rivlin material model using a SQP optimisation algorithm within an inverse FE approach.
The results proved that the Mooney-Rivlin material model is a curve fitting function and that more than one material model can be obtained, which describes the material response accurately. Therefore, the different material models obtained from the two optimisation algorithms, were expected.
One main goal of the study was to find an improved method for characterising soft materials with an improved accuracy response for the engineering stress vs. stretch curve in both the compression and tension region. Each indentation test was able to obtain a material model which fitted the engineering stress vs. stretch curve over the whole stretch range of 0.4 - 3.0 stretch. Unfortunately, these material models did not obtain the smallest objective function, but this interesting observation can lead to new research. The minimum and maximum principal strains obtained for the indentation depth were investigated since the stretch is directly correlated to the principal strains. It was again concluded that the material model with the smallest objective function will not guarantee the best strain results. It was originally assumed that using the displacements within the objective function, will account not only for the displacement, but the strain as well to be optimised as the two parameters are directly correlated. The results disproved this assumption within table 3 and figure 4.
The study did not aim to find the best optimisation algorithm, but it was clear that the SQP algorithm performed the best. If the SLP algorithm produced a material model with the smallest objective function, this algorithm would have been perfect since, between the 60 different optimisation runs across vastly different indentation tests, the same material model was obtained each time. This would have resulted in the prefect test procedure since a guaranteed optimum material model would have been obtained and the silicone rubber perfectly characterised. Unfortunately, the SLP algorithm only ran into the lower bound from table 2 and did not provide much useful information, other than that this algorithm is not best suited for this type of optimisation problem.
From the observations within the results, a material model either matched the displacement field nearly perfect with the best objective function, or the engineering stress vs. stretch curve nearly perfect, but both cannot be matched perfectly simultaneously. This was mostly due to the objective function which only accounted for the displacements.
In conclusion, the current work does however indicate that the approach works much better and is able to nail down the original material model, but the method is currently limited and would need future investigations to improve the limitations.
Future work could possibly keep the following in mind; these indentation tests are intended to characterise various soft materials on mm scale. The size of the samples is not limited to the size used within this paper but can possibly be applied to smaller scale samples, provided that the ratios between the test dimensions are kept the same. A silicone rubber was used as the non-linear hyper-elastic material, but the methods are not limited to silicone rubber and can possibly be investigated further to account for anisotropic materials such as biological tissue. Using only the displacement data is not enough to extract the original material model due to many local minima in the objective function, therefore future work can investigate the use of additional metrics in the inverse process e.g., the displacement and the force/strain data.
References
[1] G. A. Holzapfel and R. W. Ogden. On planar biaxial tests for anisotropic nonlinearly elastic solids. A continuum mechanical framework. Mathematics and Mechanics of Solids, 14(5):474-489, 2009. [ Links ]
[2] G. A. Holzapfel. Similarities between soft biological tissues and rubberlike materials. In Constitutive Models for Rubber IV, 607-617, Routledge, 2016.
[3] J. Vastmans, H. Fehervary, P. Verbrugghe, T. Verbelen, E. Vanderveken, J. Vander Sloten, T. Treasure, F. Rega, and N. Famaey. Biomechanical evaluation of a personalized external aortic root support applied in the Ross procedure. Journal of the Mechanical Behavior of Biomedical Materials, 78:164-174, 2018. [ Links ]
[4] M. Abbasi, M. S. Barakat, K. Vahidkhah, and A. N. Azadani. Characterization of three-dimensional anisotropic heart valve tissue mechanical properties using inverse finite element analysis. Journal of the Mechanical Behavior of Biomedical Materials, 62:33-44, 2016. [ Links ]
[5] C. K. Chai, A. C. Akyildiz, L. Speelman, F. J. Gijsen, C. W. Oomens, M. R. van Sambeek, A. van der Lugt, and F. P. Baaijens. Local anisotropic mechanical properties of human carotid atherosclerotic plaques -Characterisation by micro-indentation and inverse finite element analysis. Journal of the Mechanical Behavior of Biomedical Materials, 43:59-68, 2014. [ Links ]
[6] C. K. Chai, L. Speelman, C. W. Oomens, and F. P. Baaijens. Compressive mechanical properties of atherosclerotic plaques - Indentation test to characterise the local anisotropic behaviour. Journal of Biomechanics, 47(4):784-792, 2014. [ Links ]
[7] M. A. J. Cox, N. J. Driessen, R. A. Boerboom, C. V. Bouten, and F. P. Baaijens. Mechanical characterization of anisotropic planar biological soft tissues using finite indentation: Experimental feasibility. Journal of Biomechanics, 41(2):422-429, 2008. [ Links ]
[8] K. Liu, M. R. VanLandingham, and T. C. Ovaert, Mechanical characterization of soft viscoelastic gels via indentation and optimization-based inverse finite element analysis. Journal of the Mechanical Behavior of Biomedical Materials, 2(4):355-363, 2009. [ Links ]
[9] C. Wex, S. Arndt, A. Stoll, C. Bruns, and Y. Kupriyanova. Isotropic incompressible hyperelastic models for modelling the mechanical behaviour of biological tissues: A review. Biomedical Engineering/Biomedizinische Technik, 60(6):577-592, 2015. [ Links ]
[10] R. Tobajas, E. Ibartz, and L. Gracia. A comparative study of hyperelastic constitutive models to characterize the behavior of a polymer used in automotive engines. In Proceedings of the 2nd International Electronic Conference on Materials, Vol 2, pages A002, 2016.
[11] D. T. Viljoen. Characterising Material Models for Silicone-rubber Using an Inverse Finite Element Model Updating Method. Master's Thesis, Stellenbosch University, South Africa, 2018. [ Links ]
[12] Smooth-On. Smooth-sil series: Addition cure silicone rubber compounds. Data Sheet, URL https://www.smooth-on.com/products/smooth-sil-950/, 2021.
[13] L. Meunier, G. Chagnon, D. Favier, L. Orgéas, and P. Vacher. Mechanical experimental characterisation and numerical modelling of an unfilled silicone rubber. Polymer Testing, 27(6):765-777, 2008. [ Links ]
[14] Vanderplaats Research & Development Inc. Design Optimization Tools Users Manual. No. 719. Colorado Springs, CO, 2001.
[15] Docs.scipy.org. Scipy.Interpolate.Rbf - Scipy V0.18.1 Reference Guide. URL https://docs.scipy.org/doc/scipy-0.18.1/reference/generated/scipy.interpolate.Rbf.html, 2020.
Received 20 August 2020
Revised form 1 July 2021
Accepted 21 September 2021

