


Serviços Personalizados
Artigo
 Inglês (pdf)
 Artigo em XML
 Referências do artigo
Indicadores

Links relacionados
-
 Citado por Google
 -
 Similares em Google
Compartilhar

 Permalink
R&D Journal
versão On-line ISSN 2309-8988
versão impressa ISSN 0257-9669
R&D j. (Matieland, Online) vol.37 Stellenbosch, Cape Town 2021
http://dx.doi.org/10.17159/2309-8988/2021/v37a4
ARTICLES
http://dx.doi.org/10.17159/2309-8988/2021/v37a4
Drowsiness Detection using Android Application and Mobile Vision Face API
B. RajkumarsinghI; D. TotahII
IDepartment of Electrical and Electronic Engineering, University of Mauritius, Réduit, Mauritius, b.raikumarsingh@uom.ac.mu
IIDepartment of Electrical and Electronic Engineering, University of Mauritius, Réduit, Mauritius
ABSTRACT
Absence of forbearance among drivers, fatigue and irresponsible behaviour among drivers result in countless fatal crashes and road traffic injuries. Driver drowsiness is a highly problematic issue which impairs judgment and decision making among drivers resulting in fatal motor crashes. This paper describes a simple drowsiness detection approach for a smartphone with Android application using Android Studio 3.6.1 and Mobile Vision API for drowsiness detection before and while driving. Physiological analysis and a quick facial analysis were performed to check drowsiness before the driver starts driving. The smartphone camera was used for analysing the heart rate by tracking colour changes due to blood flow on the fingertip. Facial analysis was undertaken by Google Vision API which determined the head position, blinking duration and yawning frequency through the eye opening and mouth opening probabilities. The heart rate, blinking duration, yawning frequency and speeding were used as indicators for drowsiness. The facial analysis was repeated with speeding data while driving with results analysed each one minute. A performance accuracy of the combined results with speeding detection proved to be around 93.3%.
Additional keywords: Drowsiness detection; Facial analysis; Heartrate; Mobile Vision API; Physiological analysis.
1 Introduction
Drowsiness is one of the significant reasons for road crashes that results in considerable damaging consequences to the individuals who suffer fatal or non-fatal injuries, property damage and economic losses to the nation. A survey conducted by the National Highway Traffic Safety Administration (NHTSA) estimated that 8.8% to 9.5% crashes resulted from road accidents in 2018 in the United States [1]. Another study made by the American Automobile Association (AAA) Foundation for Traffic Safety identified that around 328,000 drowsy driving crashes occur yearly [2]. Common symptoms that have been identified during drowsy driving include: constant nodding, difficulty opening eyes, missing road signs and turns, frequent lane drifting and difficulty in maintaining speed [3].
According to National sleep foundation and experimental values obtained, it was confirmed that the factors that contribute to drowsy driving include: participants with less than 7 hours of sleep, participants with sleep disorders, driving at late hours, and frequent traveling through different time zones (commercial drivers), and working late night shifts or long shift hours, influence of medication, stress and sedentary lifestyles [4]. It was observed that drunk driving also led to drowsy driving since alcohol affects the brain cells and causes sleepiness depending on blood alcohol concentration. It took around 30 minutes for alcohol to start affecting a person through tested results. It was also confirmed that alcohol enters the bloodstream within about 20 minutes before it starts to affect the person. External factors observed that affect drowsiness level include environmental conditions like temperature and humidity inside the vehicle [5].
The automobile industry is focusing on drowsiness detection systems to offer better quality of service in terms of driver-assistance. For instance, Bosch driver assistance systems include drowsiness detection system that monitors steering movements, duration of trips, turn signals together with lane keeping assistance and automatic emergency braking [6]. Based on these functions, it could detect a driver's fatigue level and help the driver during driving.
Different approaches of drowsiness detection have been investigated which mainly involved driver behavioural measures, physiological measures and vehicular based measures.
Driver behavioural measures include facial detection and analysis, eye tracking and head movement. PERCLOS was recognised in the past according to Walter Wierwille and his colleagues as a reliable and valid measure of driver fatigue through their real-time measures of alertness system [7]. PERCLOS is a widely used index that calculates drowsiness by measuring the percentage of time a person's eyes are closed from 80% to 100% and does not reflect on blinks.
A highly accurate system aims at identifying dangerous vehicle manoeuvres by a drunk driver and alerting the driver based on sensor readings or calling the police before any accident actually occurs [8]. In another paper, alcohol intoxication detection is enabled through a system comprising of embedded system board Raspberry-pi and Python with Open-CV [9]. The system uses computer vision alongside an alcohol gas sensor application. To determine driver fatigue in real time, an electroencephalogram (EEG) based detection system was developed that processes the EEG signals using pulse coupled neural network, whereby the neural process of driver fatigue was examined [10]. Additionally, a model was proposed that brought a distinctive and innovative approach such that drowsy detection was predicted using lane heading difference metric alongside fatigue measures including driver reaction time and oculomotor movement [11]. The vehicle heading metric recorded the difference between the direction of the vehicle and the tangential direction of the vehicle, both measured in degrees.
An approach was presented of vehicular based measurement using smartphone micro-electro-mechanical system (MEMS) sensors, accelerometer and gyroscope that detected sudden abnormal change in speed, abnormal steering; continuous and careless lane changing as well as checking if the driver used a smartphone while driving [12]. Vehicle movement detection was defined through axes and the yaw angles (between the x, y and z planes) through rotation variations and acceleration which determined sudden speeding and slope detection algorithm. A smartphone-based system for the detection of drowsiness in automotive drivers was proposed using the percentage of eyelid closure obtained from images of the front camera of the smartphone and ratio of voiced to unvoiced speech data from the microphone [13]. A system was developed using a smartphone, a heart monitoring device and machine learning to observe the state of driver's alertness by taking into account his behavioural as well as physiological factors [14]. Visual indicators such as head nod, head rotation and eye blinks from smartphone images with advanced computer algorithms while driving were used to detect driver fatigue [15].
Driver monitoring has been an important field of advanced study and research for so many years. Many techniques have been developed, albeit very complicated methods and hardware has been used. There is no such pattern of driver monitoring in Mauritius except people who own vehicles equipped with driver aid aimed at guiding the driver depending on conditions. The importance for driver recognition, monitoring and infotainment control has been recognised, but still Mauritius lacks behind those facilities, whereby only a small part of the population can benefit from the systems.
Previous approaches to determine drowsiness have used computer vision, sensors or complex strategies using artificial intelligence for drowsiness detection and classification process while driving [16-22]. The aim of this paper is to use a smartphone as a practical method of determining drowsiness before and while driving.
The original contributions of this paper are (1) to develop a simple and user friendly and non-invasive android application for a smartphone to detect drowsiness, (2) to detect drowsiness before the driver enters the vehicle using physiological and facial analysis, (3) to detect drowsiness while driving using facial analysis and speeding data.
The paper is organized as follows. Section 2 describes the research methodology. The experimental tests and results obtained are discussed in section 3. Section 4 summarises the conclusions.
2 Methodology
2.1 System model and equipment
This section describes the implementation details and programming techniques that have been used to enable the system to work effectively. In this work, an application has been proposed for the same purpose of drowsiness detection using a dedicated smartphone to process a stream of picture frames of the finger, analysing the blood flow and facial analysis. Figure 1 illustrates the system model.

Before driving, the application on the smartphone allows the person to undertake a physiological test which consists of checking the heartbeat. This result is confirmed by a quick facial analysis of the person to determine if the subject is in a state to drive. Subsequently, the application will timely and consistently monitor driver fatigue while the person is driving by checking the number of blinks, yawns and speeding behaviour. The application alerts the driver in case of positive detection of drowsiness analysed before and while driving. The Global Positioning System (GPS) system gets the latitude and longitude and computes the speed of the vehicle according to distance travelled through a mathematical analysis. Besides, if speed exceeds the speed limit of the road segment, the driver will be alarmed to reduce speed. The persistent sequence of driver monitoring lasts till the destination is reached. Results are analysed every one minute and the timer set to check blinking, yawning frequency and speeding. The project aims at using no external hardware or any gadgets which the driver otherwise might feel uncomfortable to wear except a mobile phone.
It is mostly suitable to use an android application and an android platform for the system since it allows customization in any way the user wants giving it an awesome user interface, it is an independent device whereby no big external hardware support is required as required for EEG, Electro-Oculogram (EOG) except for a smart phone holder to hold the smartphone during driver drowsiness detection as shown in figure 2. Samsung Galaxy J5 prime was used for the experiment. Android Studio with minimum Software Development Kit (SDK) 23 and Target SDK 29 was used.

Android studio is an Integrated Development Environment (IDE) for Android's operating system which is constructed on JetBrain's IntelliJ IDEA software and is a flexible gradle-based build system. It allows developers to build and test applications in various devices with a feature-rich emulator [23] and allows programming in Java and even Kotlin in Android Studio 3.0 or late. Moreover, it allows C and C++ with its Native Development Kit (NDK) support, includes a built-in support for Google Cloud Platform and provides updates for better performance and version compatibility and new features. Most importantly, it is capable of app-signing and proGuard. The application was developed using Android Studio 3.6.1.
In addition, the Google APIs allows the system to access the services anywhere from the mobile device hence, making it a low cost system.
2.2 Participants
20 different adults between 18 to 60 years of age participated in 130 tests under different conditions. Sleep deprivation, alcohol consumption, influence of medication and lack of physical activity (at rest) were the different conditions tested. Also, different times of the day were used to undertake the tests. The drivers were tested while driving on country roads in good road weather and brightness conditions.
2.3 System algorithm
The system algorithm is represented in figure 3. The drowsiness detection is done twice, before and while driving.

Physiological tests consist of heart rate measurement of the driver before driving using a smartphone application. Facial analysis is determined by the head position, blinking duration and yawning frequency and is done before and while driving. While driving, speeding data is also taken into consideration together with facial analysis to detect drowsiness. The driver is warned of drowsiness before and while driving.
2.4 The application (APP) implementation
The application is categorized into three layers namely:
• The Presentation layer (MainActivity.java)
• The main activity is presented to the user when the app is launched. The main activity can then start other activities to perform different actions
• The Business layer (Heart Rate Measurement, Facial Monitoring, Speed Monitoring and Lane Monitoring java classes)
• The Service Layer (Alerting the user when drowsiness is detected and storing the values.)
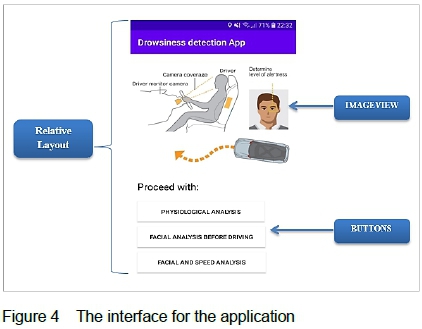
On launching the application, the MainActivity.java is executed. It has a relative layout which displays the child views in relative positions. The relative layout eliminates the need for several nested LinearLayout groups.
Android provides different ViewGroups, namely, ConstraintLayout which provides a flat view hierarchical design, LinearLayout which allows all child views in a single direction while the RelativeLayout displays them. A FrameLayout displays a single view.
Android explicit intents are used to invoke the external classes, namely heartrate.java, facialonly.java and drowsiness.java.
The startActivity() method invokes the activity. The intents used are used to launch the different activities.
The application will require permissions to run on the mobile device. Permissions that need to be accessed include the camera, sensors on the mobile device, location, network state, storage, phone call and vibration. Before calling any permission in the AndroidManifest.xml file, it is necessary to call the required permissions in the java classes using the checkSelfPermission method of ContextCompat or ActivityCompat. Figure 4 shows the layout view of the application.
2.5 Physiological analysis and facial analysis before driving
The user proceeded with heart rate measurement using smartphone camera and flash around one minute to determine if he was drowsy through the values obtained in bpm even before entering a vehicle. The user immediately went through a quick facial analysis to determine head position, blinking frequency, eye opening probability and yawning to confirm drowsiness using the Google Vision Face API.
2.5.1 Procedure for physiological analysis
The heart rate is measured with the smartphone camera and a flash tracks colour changes on the fingertip due to blood flow during heartbeat which gives the heart rate value in beats per minute.
The user has to place his finger on the camera surface correctly to be able to monitor heart rate for 1 minute. The values have been checked against a blood pressure monitor. Figures 5 and 6 show that the heart rate value recorded using application was 86 bpm and the same recorded on the blood pressure monitor.


Results vary about ±2 bpm with the Life Fitness blood pressure monitor model Number BP3AD1-1-LF value giving heart rate value.
A series of tests has been carried out with different people whereby they have to be trained on how to place the fingers appropriately. The back of the smartphone might feel hot during the experiment because of the flashlight. If a finger is moved during testing, the application could give inaccurate results.
The system uses the Preview Callback method to get the latest image from the preview frame. The image is displayed in a TextureView. The latter is used to display content streams. When the index finger is placed behind the camera with the flashlight on, a red screen is displaced.
A beat is sensed when a change is observed in the red pixels. There are subtle variations that the naked eye can barely see but with the flow of blood under the skin, these variations only are processed in the video image and the heartbeats are determined mathematically. The application takes around 14 seconds to average the beats per minute data. The app waits for a minimum of 15 heartbeats captures. The red pixel values are extracted and the average red pixel value determines the heartbeat.
The user may have to wait longer if the person wrongly placed his finger behind the camera. If the person moves his finger during measurement, this can also result in inaccurate reading.
Figure 7 displays the required imports for the camera and SurfaceTexture.

Standard values have been used to test determine drowsiness levels as shown in figure 8 [23, 24]. The threshold levels to determine drowsiness also tally with tests carried out with the subjects. Table 1 shows the summarized heart rate values recorded in different situations for different age groups and the average values were computed as a whole.


The accuracy for physiological behaviour using smartphone is calculated as given by equation 1.
2.6 Facial analysis
Furthermore, the system monitored the subject before and while driving by analysing the values eye blinking and yawning values each one minute till the destination is reached. The phone was placed in front of the driver using a phone holder.
2.6.1 Facial analysis with Google API
A facial analysis is performed to determine the eye opening probability, smiling probability which thereby determine the eye blinking frequency and yawning detection for duration of around 5 to 15 seconds.
2.6.1.1 Procedure for facial analysis
1. Camera attributes are set for face detection, for instance the size of the width and height of the camera source preview; and the camera facing direction are set.
2. Camera permissions are enabled to allow the application to access the camera while it is running on the android device.
3. The Google API allows human face detection and real time face tracking and analysis. The following imports are required when using the Google Face API:

4. The face detector component uses mode, classification landmarks, prominent face only and tracking. The classification type allows eye and smile detection and the ProminentFaceOnly is set to true to track only one face.
5. Eye blink frequency and yawning detection are found using the eye opening probability and smiling probability.
6. Face position is also determined by the face's orientation using EulerY and EulerZ.
7. Facial analysis before driving is determined by observing the facial characteristics and determines yawning and blinking duration within 10s. A timer has
The CameraSourcePreview.java class resizes the graphic overlay to give the size aspect ratio in terms of height and width similar to that of the phone's screen so that it fits within the displayed screen on the phone.
The graphic overlay view gives the face position, landmarks specified and the orientation. Vision dependencies are included in AndroidManifest.xml file whereby GMS allows libraries to be downloaded for face detection.
Euler Y and Euler Z are angles that identify the face's orientation and allow face position detection. The Face API also allows smiling and eyes opening classifications that allow determining the probabilities of eye opening and smile probability.
Yawning detection can be carried out by observing the probability of eye closure and the getlsSmiling probability which observes the lips of the user.
There is no explicit mouth open detection in the Face API. Therefore an estimation using smiling probability and eye open probability has been used and tested. The probabilities computed have been summarized in table 3.


2.7 Vehicle speed detection
The speed of the vehicle can be computed by getting the latitude and longitude using the LocationManager class to access location services as shown in figure 9.
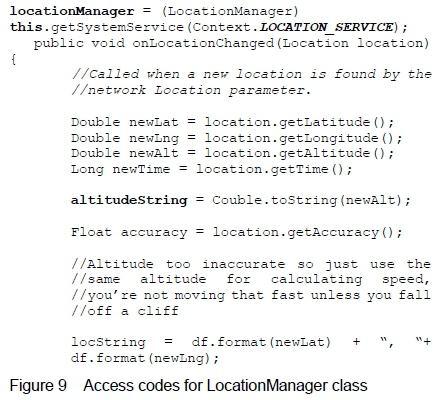
The Roads API returns the posted speed limit for a given road segment. In the case of road segments with variable speed limits, the default speed limit for the segment is returned. Speeding is detected when the speed limit is exceeded for the road segment.
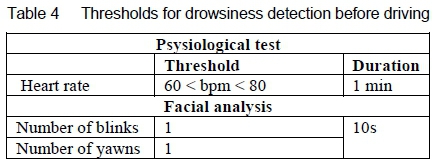
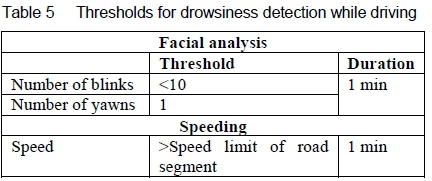
2.8 Summary of thresholds for drowsiness detection
Tables 4 and 5 give a summary of the threshold levels before and while driving for the detection of drowsiness.
3 Tests and Results
During application testing, all permissions including camera, location and storage had to be enabled on the smartphone for the application to work properly.
3.1 Physiological tests and results
It has been observed, from figure 10, that the heart rate for sleepy or drunk driving lies between 60 and 80 bpm. These threshold levels have been used for the physiological tests.

Table 6 gives the common factors that caused drowsiness. The levels of drowsiness observed for the set of subjects studied are also shown in this table.

The application was tested 130 times with 115 accurate results. Accuracy for physiological behaviour using smartphone is calculated from equation 1:
Accuracy = 115/130×100 =88.5% (1)
The smartphone camera heart rate measurements gave an accuracy of up to 88.5%. While comparing with previous research works, ECG and EEG sensors used for drowsiness detection also produced performance accuracies in the range of 79% to 99%.
It was noticed that some abnormal readings took place and the reasons identified are as follows. The person moved his finger during measurement and did not allow complete capture of heart beat at the required time interval. People with a big finger cannot adjust their finger appropriately at the surface of the camera. The application could not detect blood flow in the finger.
3.2 Facial analysis testing and results
Figure 11 shows the result for determining drowsiness through facial analysis. The first picture shows that the subject was not drowsy. At a different instance as shown in the second result, the subject yawned in the first 15 seconds. The latter was considered as drowsiness detected.

From table 7, it can be deduced that facial analysis performed on the subjects improved the accuracy of the drowsiness detection process by a quick analysis of the face with the eye opening probability and smiling probability to give the blinking and yawning frequency. The combined results for heart rate analysis and drowsiness detection through facial features inspection improved the system performance to approximately 90.4%.

False positives might occur in correspondence to the person appropriately placing the smartphone in his direction or if the person's head is tilted in certain degrees not allowing accurate facial detection and analysis. Table 8 shows that the front facing camera yields better results with an accuracy of up to 90.5% than placing the camera at an angle since it can measure the eye probability more accurately.

The head orientation pose angle determines the head position of the person. Different angles for EulerY and EulerZ have been tested to get head positions. EulerX is not supported in Face API. Table 9 shows the correct eye blinking detection for different head positions.
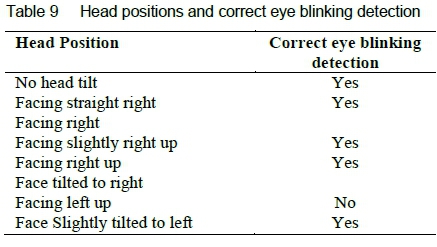
It can be seen from table 9 that the eye blinking detection is incorrect when the head is facing left up only.
3.3 Facial analysis with speed detection
The number of blinks and yawns as well as speeding within the time duration of 1 minute was recorded while driving. A picture of the drowsiness detection app while driving is shown in figure 12.

Facial analysis together with speeding detection showed an improvement in accuracy of 93.3% as given in table 10.

Figure 13 gives the number of correct and incorrect drowsiness detections made before and while driving. When facial analysis was done together with physiological analysis before driving, the accuracy increased from 88.5 % to 90.4 % as can be seen in figure 14.


The accuracy of drowsiness detection is found to increase further to 93.3% when speeding is included in the detection algorithm together with facial analysis while driving.
The Google Location Services API used accurately gave the speed of the vehicle using location and latitude obtained with minimum error. Variations in speed detected to actual speed of vehicle were around ±1.0 km/h. The vibrator vibrated for around 5s if the subject was tested sleepy in an attempt to alert the driver if he is sleepy without looking at his phone. Results could be saved in a folder for later analysis if needed. The application could be improved by making it voice automated.
4 Conclusion
The aim of this work was to design and implement a user friendly driver monitoring and drowsiness detection application. Android Studio 3.6.1 software was used for developing the application. The application mainly tested the physiological analysis, facial analysis of driver and speed monitoring. Mobile vision Face API was used for face detection, classification and for computing the blinking frequency. The face orientation was computed through pose angle estimation in the Y and Z plane. Location services allowed computing the speed of the vehicle through distance and location features. Emergency call button was set to help the driver in difficult situations. Previous projects have used machine learning and AI algorithms for training data and data classification which ultimately provided very accurate results while driving. This work, however, aimed at providing ease of use, availability, reduced cost and privacy since data was stored in the user phone before and while driving. The driver could be tested for drowsiness even before driving. It could be concluded that physiological analysis for drowsiness detection yielded an accuracy of around 88.5% and is comparable to accuracies obtained from ECE and EEG sensors. The combined results for heart rate analysis and drowsiness detection through facial features inspection before driving improved the system performance to approximately 90.4%. Also the accuracy improved further to 93.3% while driving with the use of speeding data with facial analysis.
REFERENCES
[1] T. Covington, Thezebra.com, 2020. URL https://www.thezebra.com/drowsy-driving-statistics/.
[2] J. M. Owens, T. A. Dingus, F. Guo, Y. Fang, M. Perez, J. McClafferty and B. Tefft. Prevalence of drowsy-driving crashes: Estimates from a large-scale naturalistic driving study. Research Brief, AAA Foundation for Traffic Safety, Washington, DC, February 2018.
[3] Drowsy driving. URL https://www.nsc.org/road-safety/safety-topics/fatigued-driving, 2020.
[4] Facts about drowsy driving. URL https://drowsydriving.org/wp-content/uploads/2009/10/DDPW-Drowsy-Driving-Facts.pdf, 2020.
[5] L. Geggel. Booze snooze: Why does alcohol make you sleepy, then alert? URL https://www.livescience.com/58990-why-drinking-alcohol-makes-you-sleepy.html, 2017.
[6] Driver drowsiness detection. URL https://www.bosch-mobility-solutions.com/en/products-and-services/passenger-cars-and-light-commercial-vehicles/driver-assistance-systems/driver-drowsiness-detection/, 2020.
[7] D. F. Dinges and R. Grace. PERCLOS: A valid psychophysiological measure of alertness as assessed by psychomotor vigilance. US Department of Transportation, Federal Highway Administration, Publication Number FHWA-MCRT-98-006, 1998.
[8] J. Dai, J. Teng, X. Bai, Z. Shen and D. Xuan. Mobile phone based drunk driving detection. 4th International Conference on Pervasive Computing Technologies for Healthcare, pages 1-8, March 22, 2010.
[9] D. Sarkar and A. Chowdhury. A real time embedded system application for driver drowsiness and alcoholic intoxication detection. International Journal of Engineering Trends and Technology, 10(9):461-465, 2014. [ Links ]
[10] H. Wang, C. Zhang, T. Shi, F. Wang and S. Ma. Realtime EEG-based detection of fatigue driving danger for accident prediction. International Journal of Neural Systems, 25(02):1550002, 2015. [ Links ]
[11] D. M. Morris, J. J. Pilcher and F. S. Switzer III. Lane heading difference: An innovative model for drowsy driving detection using retrospective analysis around curves. Accident Analysis & Prevention. 80:117-24, 2015. [ Links ]
[12] F. Li, H. Zhang, H. Che and X. Qiu. Dangerous driving behavior detection using smartphone sensors. 19th International Conference on Intelligent Transportation Systems (ITSC), pages. 1902-1907, 1 November, 2016.
[13] A. Dasgupta, D. Rahman and A. Routray. A smartphone-based drowsiness detection and warning system for automotive drivers. IEEE Transactions on Intelligent Transportation Systems, 20(11):4045-4054, 2018. [ Links ]
[14] I. Chatterjee and S. Roy, "Smartphone-based drowsiness detection system for drivers in real-time," 2019 IEEE International Conference on Advanced Networks and Telecommunications Systems (ANTS), Goa, India, 2019, pp. 1-6, doi: 10.1109/ANTS47819.2019.9117943.
[15] J. He, S. Roberson, B. Fields, J. Peng, S. Cielocha and J. Coltea. Fatigue detection using smartphones. Journal of Ergonomics, 03:1-7, 2013. [ Links ]
[16] W. Deng and R. Wu. Real-time driver-drowsiness detection system using facial features. IEEE Access, 7:118727-118738, 2019. [ Links ]
[17] S. Hachisuka, T. Kimura, K. Ishida, H. Nakatani and N. Ozaki. Drowsiness detection using facial expression features. SAE Technical Paper, 2010.
[18] Q. Abbas. HybridFatigue: A real-time driver drowsiness detection using hybrid features and transfer learning. International Journal of Advanced Computer Science and Applications, 11(1), 2020. [ Links ]
[19] M. Awais, N. Badruddin and M. Drieberg. A hybrid approach to detect driver drowsiness utilizing physiological signals to improve system performance and wearability. Sensors, 17(9):1991, 2017. [ Links ]
[20] M. Hendra, D. Kurniawan, R. V. Chrismiantari, T. P. Utomo and N. Nuryani. Drowsiness detection using heart rate variability analysis based on microcontroller unit. Journal of Physics: Conference Series, 1153(1):012047 2019. [ Links ]
[21] G. Yang, Y. Lin and P Bhattacharya. A driver fatigue recognition model based on information fusion and dynamic Bayesian network. Information Sciences, 180(10):1942-1954, 2010. [ Links ]
[22] R. Bhardwaj, P. Natrajan and V. Balasubramanian. Study to determine the effectiveness of deep learning classifiers for ECG based driver fatigue classification. IEEE 13th International Conference on Industrial and Information Systems (ICIIS), pages 98-102, December 2018.
[23] E. R. Laskowski. What's a normal resting heart rate? URL https://www.mayoclinic.org/healthy-lifestyle/fitness/expert-answers/heart-rate/faq-20057979, 2020.
[24] F. Shaffer and J. P. Ginsberg. An overview of heart rate variability metrics and norms. Frontiers in Public Health, 5:258, 2017. [ Links ]
[25] Meet Android Studio. URL https://developer.android.com/studio/intro.
Received 10 August 2020
Revised form 25 February 2021
Accepted 1 March 2021

