


Services on Demand
Article
 English (pdf)
 Article in xml format
 Article references
Indicators

Related links
-
 Cited by Google
 -
 Similars in Google
Share

 Permalink
R&D Journal
On-line version ISSN 2309-8988
Print version ISSN 0257-9669
R&D j. (Matieland, Online) vol.37 Stellenbosch, Cape Town 2021
http://dx.doi.org/10.17159/2309-8988/2019/v37a3
ARTICLES
http://dx.doi.org/10.17159/2309-8988/2019/v37a3
Fatigue Life Testing of Locally Additive Manufactured AlSilOMg Test Specimens
N. AgenbagI; C. McDulingII
IDenel Dynamics. Irene, South Africa. niel.agenbag@deneldynamics.co.za
IICSIR Materials Testing. Meiring Naude Drive, Lynnwood Ridge, Pretoria, South Africa. cmcdul@csir.co.za
ABSTRACT
In order for additive manufacturing to become a viable manufacturing methodfor aerospace engineering, it is required that exhaustive static and fatigue testing be performed. The testing is required in order to describe material properties in a statistical manner. Fatigue tests were performed on standard additive manufactured ASTM E466 test specimens in order to obtain the low (1000 cycles) to high cycle (1E6 cycles) behaviour of AlSi10Mg. The specimens were manufactured using non-heat treated, but stress relieved specimens. Specimens were printed in three build directions, namely the XY (parallel with build plate), 45 degree and vertical direction as measured with respect to the build baseplate. The three different directions were chosen to investigate the sensitivity of the material properties to the build direction. The specimens were stress relieved on the baseplate. Static testing was also performed on specimens according to ASTM E8/E8M. The specimens were produced to have a surface finish representative of standard deburring techniques used in the aerospace industry. The surface roughness on the specimens were measured. The scatter in test data as a result of the surface finish on material properties is quantified. It is a requirement to quantify the effect of the surface roughness on fatigue failure allowable values since a machined type finish (less than 3.2 micrometer) is not always practically possible to achieve with additive manufactured structures. This is because the organic shapes produced with additive manufacturing makes some surfaces inaccessible to normal surface finishing techniques. Furthermore, some internal structures such as lattice structures are completely inaccessible to surface finishing techniques such as polishing or lapping. In addition to the surface roughness the roundness of the test section was also measured using inspection equipment. This was required since the industrial deburring techniques did not yield a completely concentric test section as a lathe operation would produce. Once again this is representative of an additive manufactured structure. The fatigue tests were performed at an R-ratio of 0.1. The test results were used to produce Wöhler or S-N curves for the material in all three material directions. The scatter was quantified using industry accepted methods. The results were compared with fatigue test results from literature of specimens produced with a lathe in order to compare a practical industrial surface finish on an additive manufactured component with a machined surface finish. It was found that the build support structures of the additive manufacturing process causes stress concentrations in the fatigue test specimens.
This leads to a reduction in fatigue life and an increase in the scatter of the results.
Additional keywords: Additive manufacturing, fatigue testing, static testing, aluminium, AlSi10Mg.
Nomenclature Roman
A Wöhler curve fit parameter []
i counter []
m gradient
c y-intercept
n number of samples []
N number of cycles
q standard deviation
R Roughness [μm]
S Stress [MPa]
y vertical distance from mean line to point i on measured surface roughness profile [μm]
Greek
α Wöhler curve fit exponent parameter []
Subscripts
a arithmetic average
m mean or average
ut ultimate tensile
∞ infinity, denoting endurance limit
1 Introduction
For metal additive manufacturing to become a viable manufacturing method for aerospace engineering, it is required that exhaustive static and fatigue testing be performed. The testing is required in order to describe material properties in a statistical manner. There is existing research that has been performed on a casting aluminium (AlSilOMg) with respect to fatigue properties [1].
Denel Aeronautics is involved in mostly aluminium manufacturing and therefore it made logical sense to focus efforts towards developing additive manufacturing on aluminium. AlSilOMg represents a relatively inexpensive way to conduct research on additive manufacturing. A commercial aerospace grade aluminium exists in the form of ScalmAlloy®. This was developed by AP Works that is an Airbus company. Denel Aeronautics followed the strategy of developing methodologies for testing and analysis using the less expensive of the two material options, since the methodologies that are developed would also be applicable to the more expensive of the two materials.
It was decided to develop a test program based on the research was then to apply testing on the as-printed test specimens, where the support structures of the test specimens were removed with industrial techniques. This is opposed to the machined specimens of [1] that had no surface defects since the specimens were machined with a lathe. This approach was important because most additive manufactured structures are very complex by design and it is usually not possible to improve surface finish with subtractive machining since the surfaces might not be accessible. A further objective of this study was to define some statistical measures with which to knock down the mean fatigue properties. This kind of knockdown factor is important in order to achieve the 10-6 probability of failure that aircraft material specimens need to achieve.
Static testing was performed according to [2] where the specimen geometry is defined in this standard. The ultimate tensile strength of the material is required for the definition of the Wöhler curve of the material.
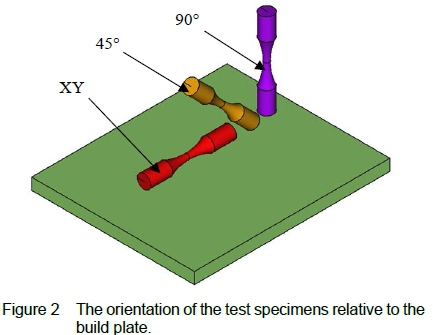
Fatigue testing was performed according to [3] in order to obtain the low (1000 cycles) to high cycle (106 cycles) behaviour of AlSi10Mg. The specimens were manufactured using non-heat treated, but stress relieved material. Specimens were printed in three build directions, namely the XY (parallel with build plate), 45 degree and vertical direction as measured with respect to the build baseplate. The results from this test program are presented and discussed in this paper.
2 Test Specimen Details
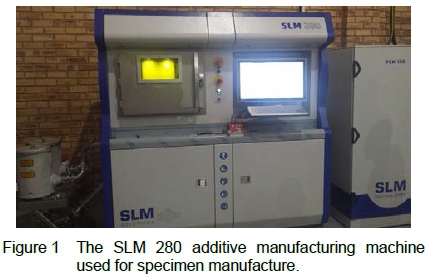
The test specimens were manufactured in an SLM 280 machine (shown in figure 2) at a South African small to medium enterprise.
The following manufacturing procedure was followed:
• Argon gas
• Maximum bed temperature of 215 °C
• 12 millibar positive pressure in build volume
• Stress relief was conducted with the specimens still attached to the build plate (to prevent cracking) at 250 °C for 2 hours. This maximum temperature was chosen because higher temperatures during stress relief can cause blistering on parts due to gas vapours.
The static and fatigue specimens were manufactured on a base plate and the static and fatigue specimens had 10 examples in each direction (figure 2), leading to a specimen population of 60.
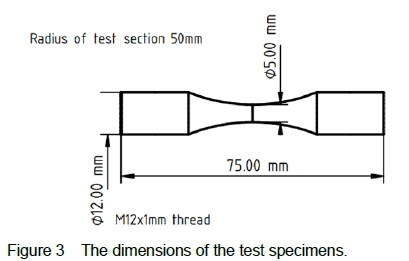
The detail geometry of the fatigue specimen is presented in figure 4. The specimen was stress relieved following the additive manufacturing process, but no further heat treatment was performed.
It was decided not to final machine the test sections. This was to more accurately represent areas that would not be accessible for surface finishing or further subtractive machining. It is common to have inaccessible surface areas on components since additive manufacturing can be used to manufacture complex shapes.
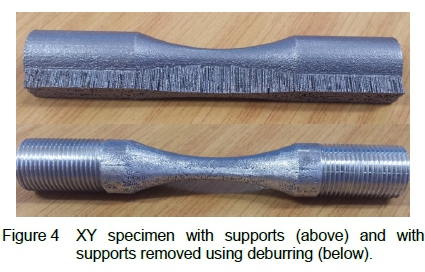
The test specimens as they are removed from the base are shown in figure 5 (top) while the bottom picture shows the support structures removed and thread machined for the fatigue test rig. The test sections were not perfectly circular and were therefore inspected and characterized in order to assess the effect of the non-circular test cross-section. The concentricity testing is shown in figure 6.
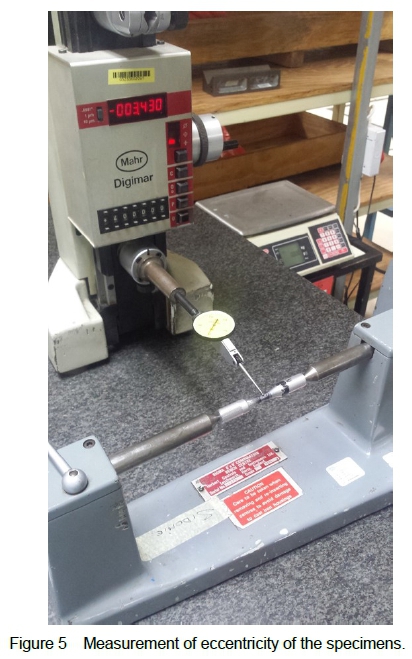
Finite element analysis showed that the eccentricity of the test section would introduce bending. The magnitude of this effect was therefore quantified. The worst-case eccentricity was used to create geometry of a specimen for finite element analysis. The threads of the specimen were constrained in rotation as it would be constrained in a fatigue test rig. An axial force was applied to the finite element model. The peak stress at the specimen test section was 14% larger compared to the peak stress in a perfectly concentric specimen with the same axial load. The larger peak stress was as a result of the additional internal moment caused by the eccentricity of the section.
The intent of the fatigue tests was to test the material surface finish as well as the geometry (including eccentricity) that could be obtained by using standard production clean-up techniques. The supports were removed from the specimens using deburring techniques that are used in production currently.
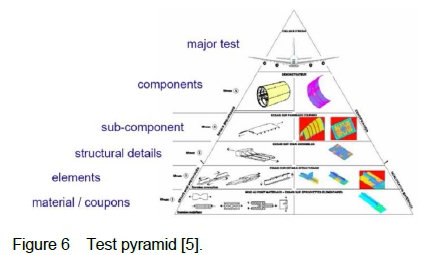
As such the fatigue tests are to be viewed as element fatigue tests as opposed to pure laboratory material fatigue tests, the results of which are already available in the literature [1]. Element tests include the normal manufacturing artefacts and defects that are common in production components. The relationship of element testing relative to the testing hierarchy for aerospace is shown in figure 7. Element testing represents a higher technology readiness level than pure material and coupon testing since it is higher in the test pyramid.
3 Surface Finish
Fatigue requirements for aerospace components extends to the surface finish. A component with only static loads applied requires a surface finish of 3 micrometers or better, while a component that is loaded with fatigue loads, or where fatigue loads are the sizing loads, requires a surface finish of 1.6 micrometers or better. This is an industry guideline for the quality of metallic aerospace components.
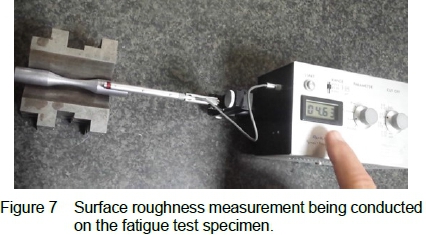
The surface roughness was measured on all the fatigue test specimens that were used in this study. The surface roughness was measured by means of the Ra surface roughness parameter. The Ra parameter (see equation 1) is defined as follows and has the unit of length, usually expressed in micrometers and is determined over a representative distance on the component. An example of a component being measured is presented in figure 7.

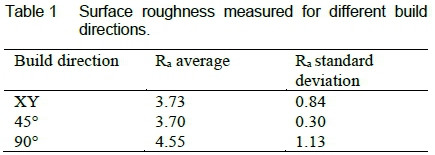
The surface roughness was measured in the test section of the fatigue specimens for all three build directions and the results are presented in table 1. The measurements indicate that the surface roughness for the samples is not satisfactory with respect to industry guidelines for fatigue components. This has the implication that further work needs to be done with respect to the improvement of the surface finish of additive manufactured parts where the option of subtractive surface finishing operations would not be possible. With the current selective laser melting process used for additive manufacturing the components will not have acceptable surface finish for aerospace standards without post processing of the components.
4 Static Test Set-up and Results
Static testing was performed to [2]. The static test specimen is shown in the test rig in figure 8. An extensometer was used to measure the displacement and a load cell was used to measure the force.
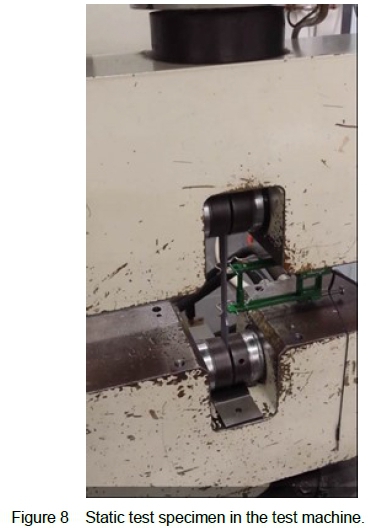
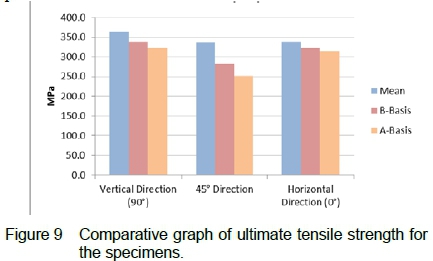
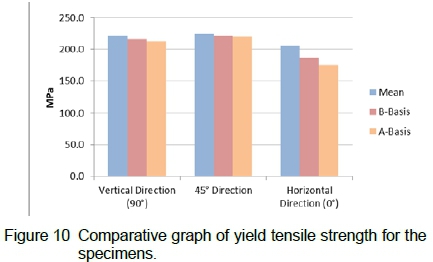
Static testing is required to define the intercept of the Wöhler curve of the material at 1000 cycles. The static test results are presented in table 2. The results from the different build directions with respect to ultimate tensile strength and yield strength are presented together in figures 9 and 10.
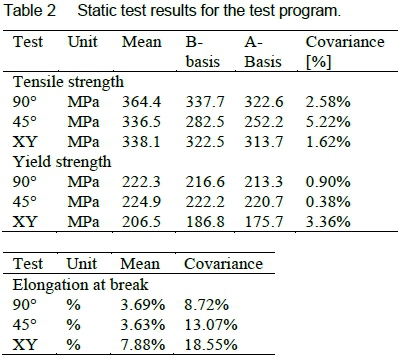
The definition of the B-basis and A-basis material allowable values are obtained from [6]. The B-basis indicates that at least 90 percent of the values is expected to equal or exceed the statistically calculated mechanical property value, with a confidence of 95 percent. The A-basis indicates that at least 99 percent of the values is expected to equal or exceed the statistically calculated mechanical property value, with a confidence of 95 percent. The MIL-HDBK-5J methodology requires a minimum of 100 samples, but since fewer samples were available, statistical methods with respect to small data sets were used to calculate the values. These results are presented in table 2.
5 Fatigue Test Set-up and Results
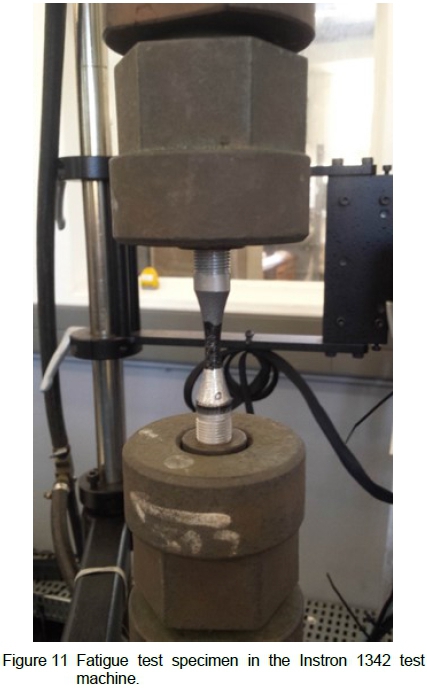
Fatigue tests were performed on the test specimens in all the build directions. The loading cycle was sinusoidal at an R-ratio of 0.1, meaning that the minimum stress of the signal divided by the maximum was equal to 0.1. Servo-hydraulic test machines were used to perform the tests. The tests were performed at 15Hz for all samples.
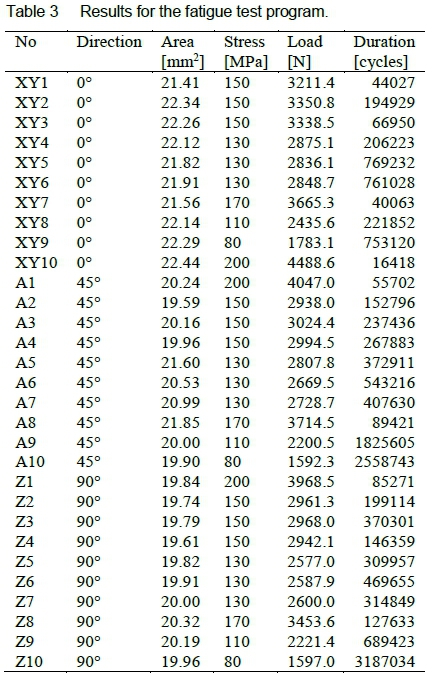
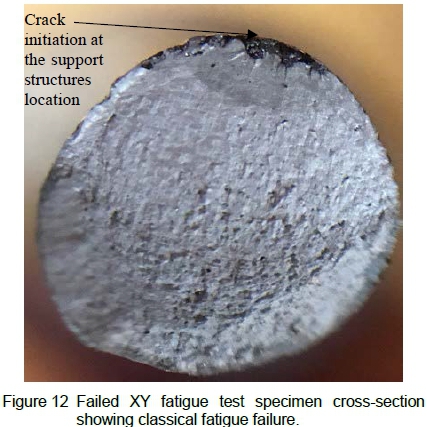
A sample is shown in the fatigue test rig in figure 11. The fatigue test results for the whole population of samples are presented in table 3. Figure 12 shows the failure surface of an XY or 0 degree specimen. The crack initiation point for the specimens started on the surface. The initiation points almost always coincided with the position of the support structures of the test specimens. The support structures were removed with standard de-burring techniques. This causes the surface of the specimen to appear smooth, but in reality, the surface of the metal is smeared by the de-burring process and the voids from the support structures remain below the surface. These voids serve as crack initiation points. Apart from the initiation point, the failure surface is similar to classical fatigue failure surfaces of aluminium test pieces.
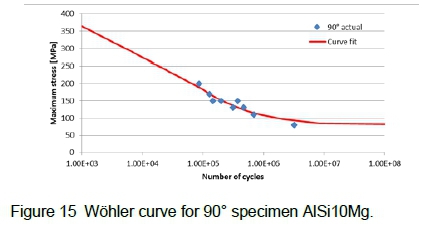
The fatigue tests are presented in graph format in figures 13 to 15. Each figure represents the results for a particular build direction. The curve fits in these figures were made excluding the test data from [1].
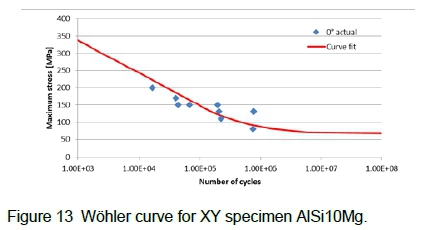
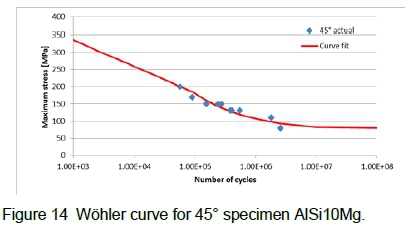
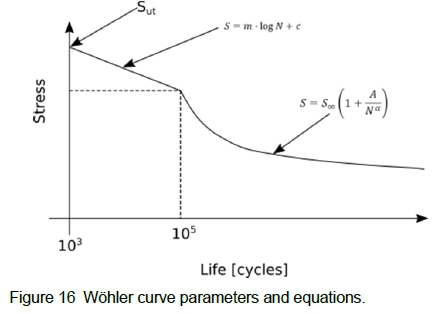
6 Wöhler Curve Assumptions
The curve fit presented in figures 13 to 15 was created with the methodology that is presented in figure 16. It is assumed that the mean curve describing fatigue failure is linear on a linear-log scale graph between 103 and 105 cycles. It is assumed that the curve fit from 105 follows a power law. The linear log curve and the power law equations are presented in figure 16. It is assumed that the function value of the power law and the linear-log curve has the same function value at 105 cycles. The values for A = 0.483 and α = 0.5 for aluminium according to [4]. Smis the endurance limit of the material, while N is the number of cycles and has the unit of megacycles. Sut is the ultimate tensile strength of the material. The variable S is stress, while the m and c are curve fit parameters of the linear-log curve fit. The Wöhler curve is defined for each build direction by varying the value of Sm until the difference between the predicted stress and the actual test stress squared at a specific number of cycles is minimized.
7 Comparison to Existing Research
The fatigue test results were compared with research performed at the Fraunhöfer Institute [1] on additive manufactured coupon specimens. The existing research performed fatigue test on stress relieved AlSi10Mg specimens. The build plate temperature from reference research is 300°C while the build plate was 215°C for the fatigue test specimens of this paper. A further difference is that the specimens were machined for the Fraunhöfer Institute results while the results of this paper represents specimens that were only de-burred and not machined to have a smooth surface finish.
Since the fatigue test specimens of the reference paper were machined following manufacturing to final tolerance these specimens could be considered to have very few surface defects. Visual inspection of the results comparison in the three build directions (figures 17 to 19) show satisfactory comparison between the two sets of results.
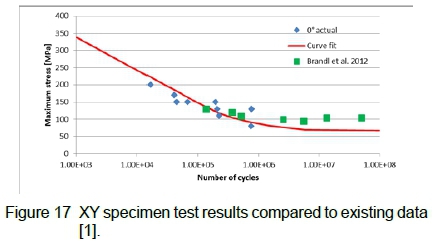
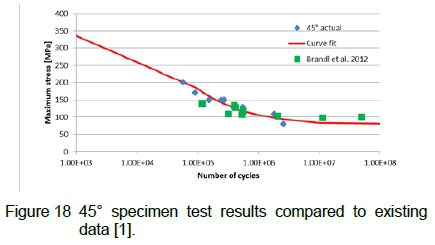
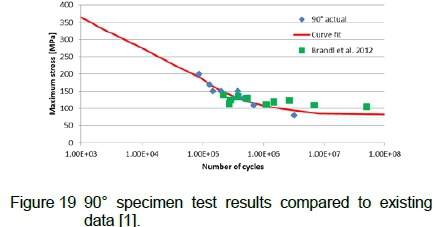
It is important to note that the fatigue tests were not conducted up to very high cycles or the ultra high cycle regime. Figures 17 to 19 show data from [1] up to almost 108 cycles. Further testing needs to be conducted to ensure that locally manufactured specimens with significant surface roughness will have the same performance as smooth specimens up to 108 cycles. This work fell outside the scope of the work presented here.
8 Quantification of Scatter
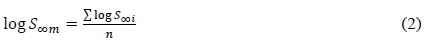
The scatter of the measured data on the fatigue test program was quantified by calculating the standard deviation on the logarithm of the endurance limit stress. The endurance limit was calculated for each test point individually using the Wöhler curve assumptions presented previously. The mean of the logarithmic endurance limit stress was calculated using the equation 2:
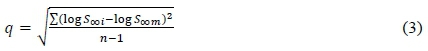
The standard deviation of the logarithmic endurance limit stress was then calculated using equation 3:
The scatter was calculated separately for the different build directions and the result is presented in the table 4.
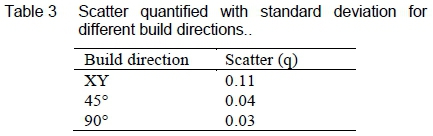
According to specification [4], the scatter of aluminium fatigue test results should have a standard deviation on the logarithm of the endurance limit of less than 0.06. The scatter on the XY specimens were unacceptable with respect to this criterion whereas the other directions were acceptable. The wide scatter on the XY specimens can most likely be attributed to the stress concentrations introduced by the supports on the specimens. It can be deduced that very stiff and intrusive supports will lead to unacceptable scatter on fatigue properties of this kind of component. Aerospace components require low scatter in order to guarantee acceptable probabilities of failure. The result presented here indicates that further work is required to define supports that would lead to acceptable scatter values. On the other hand, it shows that components with very few supports such as the 90° specimens will lead to acceptable scatter values.
9 Conclusions
Additive manufactured fatigue test specimens could be produced in the as built or non-heat treated condition. Static and fatigue testing was performed on the test specimens using ASTM specifications. Acceptable results were obtained, proving that aluminium additive manufacturing using selective laser melting is possible in South Africa leading to material properties that can be compared with international results.
The fatigue life as tested was acceptable despite the relatively poor surface finish resulting from metal additive manufacturing and industry standard de-burring methods.
The scatter on endurance limit was acceptable in the 45° and 90° direction but was not within acceptable limits for the XY or 0° specimens.
The work performed in this study lead to the following further work being identified:
• The required surface finish for using the additive manufacturing method in the aerospace industry needs to be quantified. This includes the identification of potential processes that could improve surface finish, apart from conventional subtractive manufacturing.
• The scatter of the endurance limit needs to be reduced to an acceptable level, especially for components with many and complex support structures.
• A statistical knockdown factor to the Wöhler curve needs to be defined for aerospace use to ensure 10-6 probability of failure on material level.
Acknowledgements
Denel Aeronautics would like to thank the Aerospace Industry Support Initiative (AISI) for financial support, Metal Heart for manufacturing support and the CSIR for fatigue testing support.
References
[1] E. Brandl, U. Heckenberger, V. Holzinger and D. Buchbinder. Additive Manufactured AlSi10Mg Samples using Selective Laser Melting (SLM): Microstructure, High Cycle Fatigue, and Fracture Behavior. Materials and Design, 34 (2012) 159-169, 2012. [ Links ]
[2] E8/E8M-09. Standard test methods for tension testing of metallic materials. Standard, ASTM International, 2009.
[3] E466-07. Standard practice for conducting force controlled constant amplitude axial fatigue tests of metallic materials ASTM International, 2007.
[4] 08C0013PT0001. Fatigue methodology: Fatigue analysis principles for transmission and rotor components. Standard, Denel, 1999.
[5] S. Goldbach and R. Franke. Materials and NDT applications in aircraft component development tests. In Proceedings: 2nd International Symposium on NDT in Aerospace 2010, 2010.
[6] MIL-HDBK-5J. Metallic materials and elements for aerospace vehicle structures. Standard, U.S. Department of Defence, 2003.
Received 21 November 2019
Revised form 7 January 2021
Accepted 22 February 2021

