


Services on Demand
Article
 English (pdf)
 Article in xml format
 Article references
Indicators

Related links
-
 Cited by Google
 -
 Similars in Google
Share

 Permalink
R&D Journal
On-line version ISSN 2309-8988
Print version ISSN 0257-9669
R&D j. (Matieland, Online) vol.35 Stellenbosch, Cape Town 2019
http://dx.doi.org/10.17159/2309-8988/2019/v35a2
ARTICLES
Statistical Analysis of Effects on Weld Response Variables during Friction Hydro-Pillar Processing
C. van ZylI; D. HattinghII
IMSAIMechE, Associate Professor, Department of Mechanical Engineering, Walter Sisulu University, South Africa. E-mail: cvanzyl@wsu.ac.za
IIMSAIMechE, Professor, eNTSA, School of Engineering, Nelson Mandela University, South Africa. E-mail: danie.hattingh@mandela.ac.za
ABSTRACT
The article provides insight to the complex relationships that exist between the selected weld process parameters and the associated effects on weld responses by application of statistical analysis relating to response predictive models for Friction Hydro-Pillar Processing (FHPP). The literature review focused at obtaining the current assumptions made with regards to the relationship between FHPP and conventional Friction Welding (FW) variations. Experimental welds were produced at varying selected process parameters; motor speed, axial force, consumed length and forging time. These parameters were compared to five weld response variables through a 27-run full factorial Design of Experiment and multiple regressions. The analysis focussed on quantifying the main effects of process parameters on energy input, temperature profile, friction time, torque and consumed rate. Comparison with experimental results served to validate the effect of dominant process parameters. The process and statistical analysis are explained in detail to assist further understanding of the applied methodology and the effect of the various process parameters on weld responses presented. Results indicate that the mathematical equation based models predict the responses adequately within the limits of welding parameters used and that no single parameter solely control the weld responses during FHPP. This study provides a clearer understanding of FHPP showing that generalised conclusions, with regards to the influences of process parameters on weld responses during conventional FW, cannot be made as the effects of these inputs differ depending on the combination of levels included in a parameter set.
Additional keywords: Process response modelling; regression analysis; tapered consumable tool; Heat Affected Zone
1. Introduction
Friction Hydro-Pillar Processing (FHPP) is a solid state welding technique whereby a consumable tool is friction welded into a pre-machined blind hole under an axial load -in the current variation a tapered tool and hole is applied, as illustrated in figure 1. The friction weld is started when the rotating tool touches down at the bottom of the hole and develops heat from friction, providing a hot working action causing the tool and a narrow boundary region of the parent material to plasticise. The friction surface intermittently moves up through the tool, filling the hole with plasticised metal, expelling impurities at the top of the weld with resultant bonding between the side walls of the hole and the plasticised material.

As a result of the rotation applied under pressure, mechanical energy is converted to thermal energy at the work piece interface (friction), thereby providing the required heat for forming a solid state weld. The thermal energy, converted from mechanical energy, makes the principle contribution to the heat generation during the weld. Hattingh, et al. found that once the required temperature and material plasticisation is reached, material is deposited through a shear layer formation phenomenon, which is repeated until the hole is filled [1]. The weld is ended with the rotational action terminated, and a forging load maintained or increased to create a solid phase bond. During this process the evolving properties of the weld is affected and an understanding of the relationship between process parameters and resulting responses of the weld is essential.
Base metals being joined through the FHPP is reported by da Silva, et al. to retain original properties and the Heat Affected Zone (HAZ) is small when compared to fusion welding techniques [2]. It is thus concluded that the main advantages of FHPP are lower energy consumption than traditional arc welding as well as the favourable effect on materials being welded, due to the process being done below the melting temperature of the base material.
To provide relationships between weld input parameters and real-time responses, a series of welding experiments were conducted using a portable friction hydro-pillar processing platform linked to a control and data logging system for measuring the axial force, spindle speed, vertical consumed length, torque, time and temperatures during the welding process. A weld matrix was configured with ranging weld input parameters to determine the effect of weld input parameters on real-time responses.
Figure 2 describe the FHPP as a box model, in which the controlled weld input parameters (factors), output parameters (responses) and other influential factors are shown schematically. Experimental results documented in this study will be subjected to statistically analysis to identify the main effects in the relationships between weld input parameters and response variables, providing a stronger correlation between input and output variables as applicable to FHPP.

Quality welds are dependent on the correct selection of welding process parameters, which are currently chosen empirically. The accurate prediction of the interface temperature is fundamental for process optimisation which will allow for the producing of consistent, reliable welds. The peak temperatures during the weld are of interest as these temperatures, together with the subsequent cooling rates, affect the material microstructure and consequently the determine the Vickers hardness of the material, through the weld.
The complex thermo-mechanical interactions taking place during FHPP have not been fully described and are difficult to comprehend. The complexity is increased due to the number of variables involved and the many associated phenomena that occur during the process.
In the present study FHPP of AISI 4140, low carbon, medium alloy steel is carried out to gain insight and understanding into the relationships between the process parameters and their influence on weld outputs variables. The effect of altering weld input parameters on weld responses are statistically analysed to identify the main effects in an effort to further develop this technique as a standard engineering joining and repair process.
Numerous fundamental relationships governing the FHPP remain unexplored and limited literature is available dealing with the process. Some conflicting statements were however found regarding the impression that FHPP follow the same general physical principles as conventional friction welding variations. Knowledge of the relationships between weld input parameters and responses is key in understanding the fundamentals of the FHPP with regards to process parameter influence on weld quality. The work undertaken further draws on conclusions by Schmidt in that tool and hole geometry, together with choice of welding parameters which includes rotational speed, axial force, consumed length and welding time, have an influence on the integrity of the weld [3].
During evaluation of welds done by rotary friction welding, da Silva, et al. showed that the weld parameters influence the geometry of the weld region while van Zyl & Hattingh concluded that the temperature profiles throughout the welding process have a significant effect on mechanical properties of the completed weld [2, 4]. These deductions, in support of work presented by Schmidt, emphasise the importance of optimized welding parameters to ensure acceptable joint interphase integrity [3].
Andrews & Beamish reported that a lower torque during friction welding result in a lower temperature and thus a narrower weld and heat affected zones [5]. This statement was supported by Hasui & Fukushima who proposed that a method be employed to decrease the junction area at the friction interface, resulting in lowering the applied torque [6]. According to the AWS Welding Handbook, spindle speed is the least sensitive parameter during Friction Welding while Andrews & Beamish found that higher spindle speed cause lower torque and low spindle speed induces a high torque response [7, 5]. It was stated by Hasui & Fukushima that this phenomenon is due to a change in the junction area as a result of the spindle speed while Andrews & Beamish added that each position of temperature measurement has a different response to an increase in spindle speed [6, 5].
Studies conducted by Meyer, et al. and Andrews & Beamish concurred that increasing the friction force causes an increase in torque which is brought about by intensifying the frictional contact in every phase during the weld [8, 5]. However, da Silva, et al. showed that an increase in axial force resulted in an increase in temperature, although this statement contradicts Hasui & Fukushima, in as much that an increase from low to medium force had no effect on temperature, but higher force causes the temperature to decrease [2, 6]. An investigation into FHPP of Magnesium by Pinheiro concluded that heat generation increases proportionately with an increase in pressure while earlier work by Vill reported that the temperature gradient is entirely controlled by the axial pressure [9, 10]. It was further found by Pinheiro and Andrews & Beamish that at higher axial force the friction interface is plasticised more quickly causing shorter weld friction time - Unifried later added that this phenomena results in higher hardness values [9, 5, 11].
Andrews & Beamish investigated the process of rotary friction welding and reported that consumed length has an influence on total energy input as consumed length determines weld time, but that it has no influence on the heat generation rate [5].
No documented evidence could be found providing a thorough understanding of which input parameters reserve dominance and/or what the relationships are between the input and output parameters during FHPP. Findings from literature are thus summarised above and this study aims to develop mathematical equations to predict various weld responses based on weld process parameters so provide a clearer insight to these interrelationships.
2. Experimental detail
2.1 Test sample preparation
Following the guidelines as published in ASME IX - Code Case 2832, a weld coupon and consumable welding tool, used by Hattingh, et al. was machined from AISI4140 as detailed in figure 3 [12].

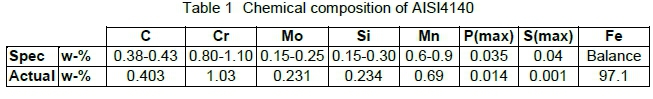
The chemical analysis of the AISI4140 low alloy, medium carbon steel, used during this work, was done on a SpectroMac Spectometer, using calibration standard B.S.6418 and is compared to the specification in table 1.
2.2 Experimental set up
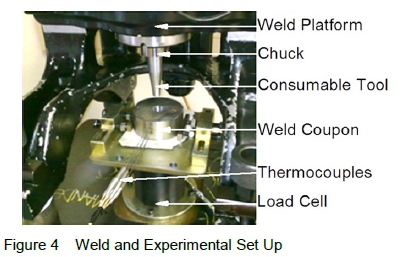
The required welds were performed on a portable FHPP platform developed by eNtsa, Nelson Mandela University, Port Elizabeth, South Africa. The Weld and Experimental set-up, with the weld coupon held in a vice attached to the weld platform is detailed in figure 4.
Type N (Nicrosil/Nisil) thermocouples, of 1 mm diameter, were placed in 5 flat bottomed thermowells of 1.5 mm diameter leaving a 2 mm wall thickness between the thermocouples and sidewall weld interface to avoid the possibility of interference with the material integrity along this face, as illustrated in figure 5. These thermocouples are manufactured to ASTM E230-ANSI MC 96.1, limiting measurement errors to 1.1°C variance. Additionally the N type thermocouples are stable, providing high resistance to thermal drift and oxidation at expected interphase welding temperatures [13, 14].
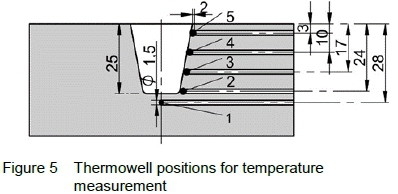
As indicated by Kleiber & Sluzalec was the bottom centre (point 1), with reference to figure 5 was selected to provide a temperature profile of the initial "dry" frictional heating stage, initiating a rapid increase in the temperature of the work piece from this point [15]. Position 2 is in line with the initial contact (dry friction) between the tool and weld coupon with two additional thermocouples equally spaced between the top and bottom positions to assist with interpolating. The thermocouples provided the means to study the temperature gradients at each position as well as a maximum recorded temperature in close vicinity and along the weld side-wall interface. The measurement at position 5 assisted in investigating the relationship of the formed flash on temperature on the surface, during the welding and the forging stage.
Lead ends of the fitted thermocouples were connected to a 47 channel TEMPpoint datalogger with Data Translation software used to log the temperature data. Catman Express software logged the torque and axial force data using a Spider 8 Datalogger while rotational speed and the consumed length were recorded via the weld platform. Required software was installed on a laptop computer to collect the data for delivery in graphical form and .csv files. The computer was run from an auxiliary power source with the datalogger housings ground to ensure shunting of any interference current.
2.3 Design of Experiments
Design of Experiments is a statistical method applied to investigate processes wherein an experiment can be defined as a series of tests during which changes are made to the process parameters to investigate the effect on responses [16]. A full factorial DoE was used to obtain the relationships between the input parameters and responses (measured outputs), resulting in 27 cases at the varying input parameters levels listed in table 2.

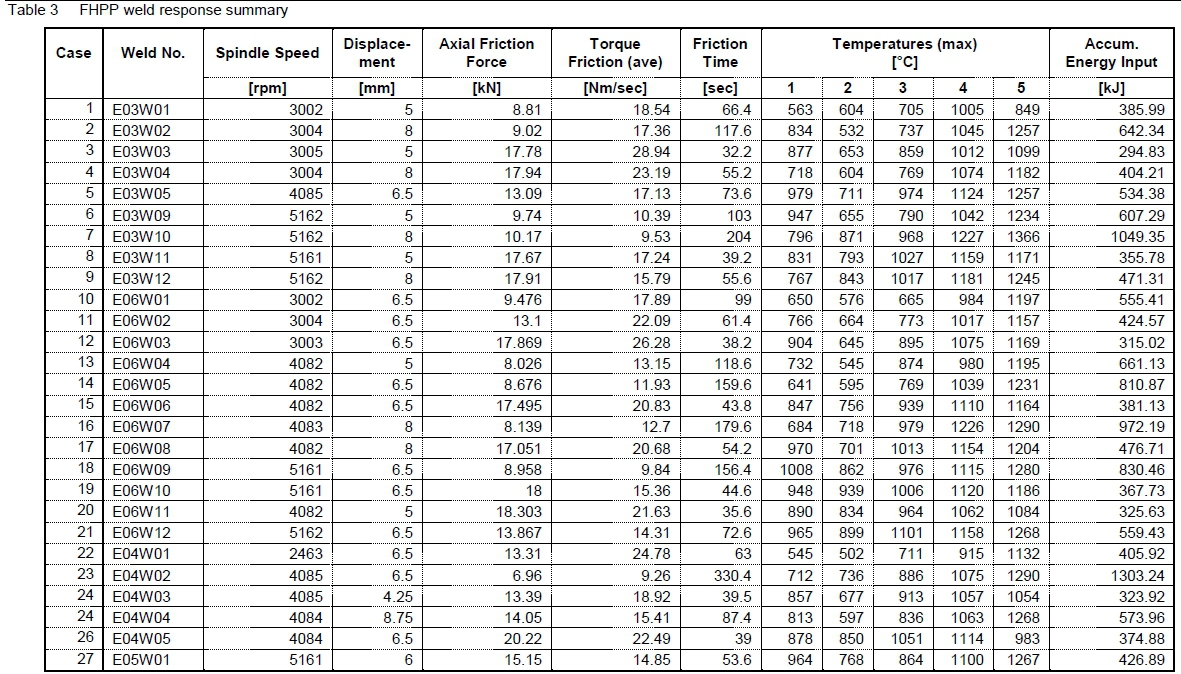
Optimised welding parameters were based on previous work done by Hattingh, et al. allowing for successful, defect free welds to be conducted [12]. For the factorial analysis the weld input parameter levels were set at -1 (low), 0 (medium) and +1 (high) to avoid its dependence on units, causing the effects to be directly comparable as the inputs are subsequently varied over the same range. The 27-run full factorial DoE used in this study, is included in table 3. Friction force, consumed length and spindle speed are varied at set values with forging time and forging force held constant for 20 seconds at 10 kN, allowing for the measurement of temperature, torque and friction time. Data was collected for the calculation of energy input applying equations 1 and 2 with the resultant responses summarised in table 3.

where, Tr=Total response torque [Nm]; Ft=Friction time [sec]; T=Instantaneous Torque at specified time step [Nm];  = Time step size [sec]; η=Number of time intervals and T1 through Tn =data logging times from 1 through n

where, Qa= Accumulative heat input [J]; N=Rotational speed [rpm]; n=Process efficiency.
3. Results and discussion
3.1 Statistical Analysis
3.1.1 Main effects
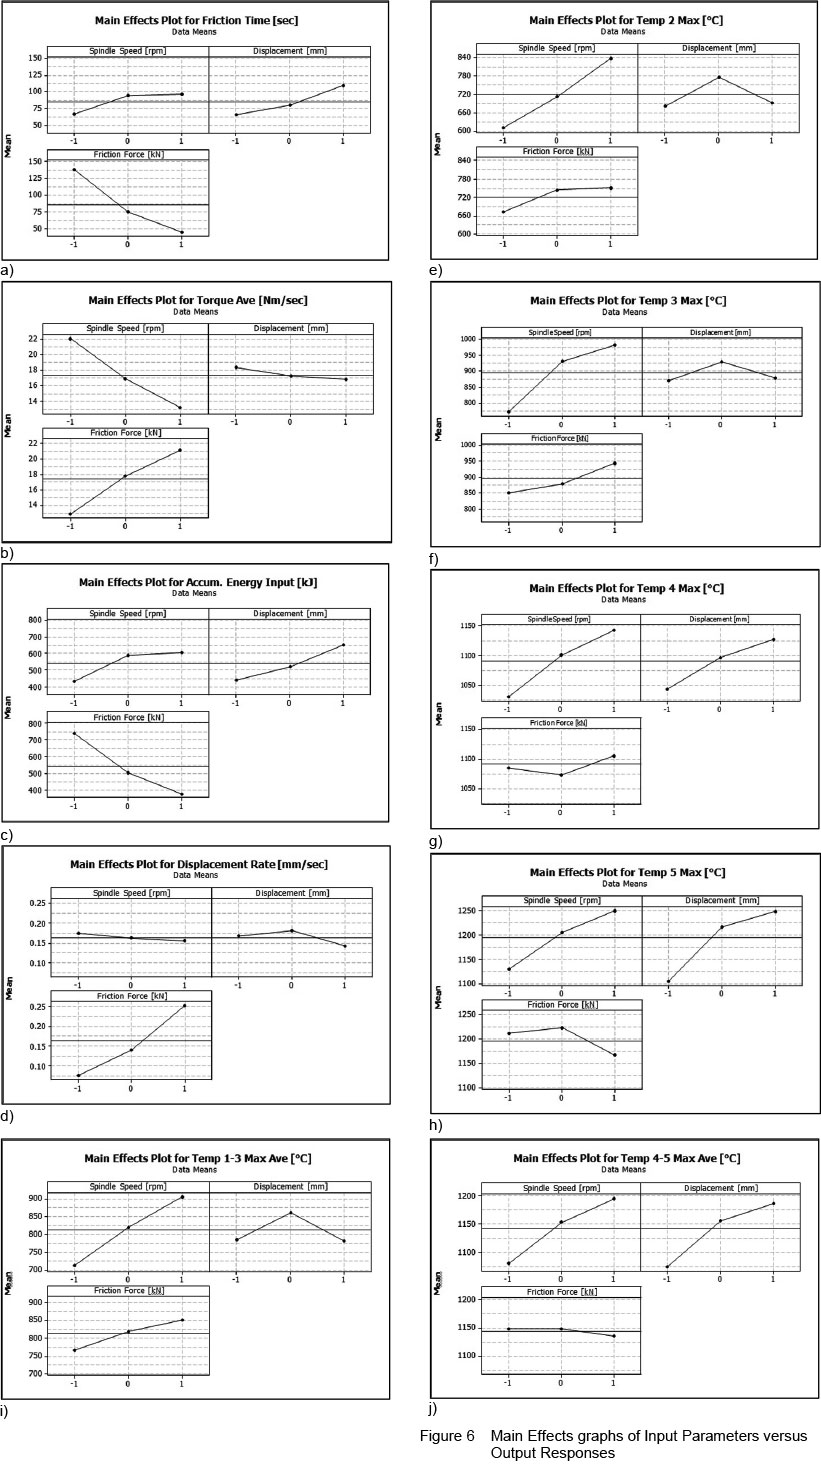
Trends and effects of data were explored by means of main effects graphs, as shown in figure 6a to 6j, indicating the influence of inputs on response variables. Important to note for interpretation, with all other parameters varied, the mean at each level of a specified factor is represented by the points on the graphs and a reference line is drawn at the mean of the response data. The reference lines close to horizontal show a minimal or zero effect on the said response. The graphs also represent the extent of change in a response with changes made to a specific input parameter. By analysing these results the dominant inputs as well as those with little or no influence on responses could be identified.
General observations for analysis: Spindle speed has the largest influence on temperature in the lower part of the weld as is visible in the graphs (e), (f) and (i). In the upper half of the weld the dominance is shared by spindle speed and consumed length as is seen from (j). At temperature point 4, (g), consumed length has a close to equal influence and dominates the effect close to the top of the weld, as shown by (h), due to the heat contribution by the flash formation and inherent higher temperature in this vicinity.
The dominance of friction force on friction time, energy input and consumed rate can be seen in (a), (c) and (d) with friction force and spindle speed sharing dominance on torque, shown in (b).
Spindle speed and consumed length show equal, but minimal, positive effect on friction time with friction force, the dominant effect having a negative influence, indicated by a negatively sloped reference line. This would mean that an increase in friction force would result in a decrease in friction time.
3.1.2 Predictive Mathematical Models
The normal probability and residual graphs were used to determine whether a model meets the assumptions of the analysis. It was found that some models satisfy the assumptions better than others, however the assumptions were successfully satisfied by all the proposed models.
The resulting models for each response are given by equations 3 to 12 with the parameters represented as: FrF -Friction force, D - Consumed length and SS - Spindle speed. The corresponding adjusted statistical correlation values (R2adj) are presented in table 4, at the temperature measurement positions as per the diagram shown in figure 5.
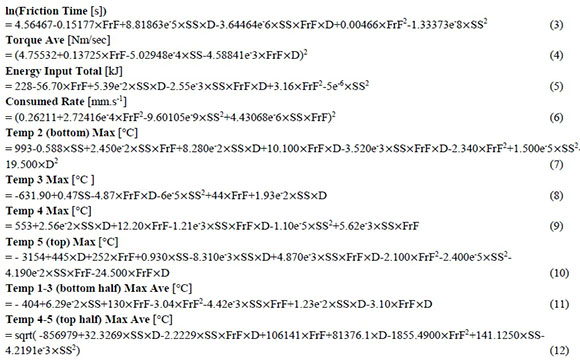
Reference could be made to the Main Effects graphs shown in figure 6 as to evaluate which input parameters have the greater effect on a response.
3.1.3 Response surface plots
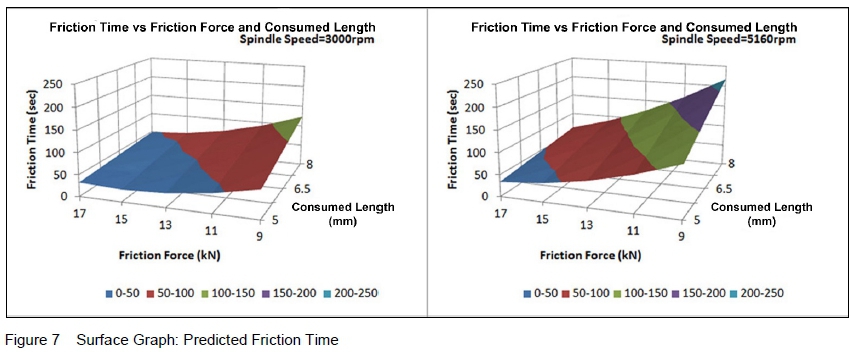
Response surface plots, created for friction time and average temperatures at the bottom and top of the welds, assist in better understanding the influence of the variation of process parameters on the temperature profile of FHPP. figure 7 represents predicted friction time as a function of friction force and consumed length at a spindle speed of 3000 rpm and 5160 rpm respectively. It is shown that reduced welding time would be a result of higher friction force at low consumed length with spindle speed having an insignificant effect at this level.
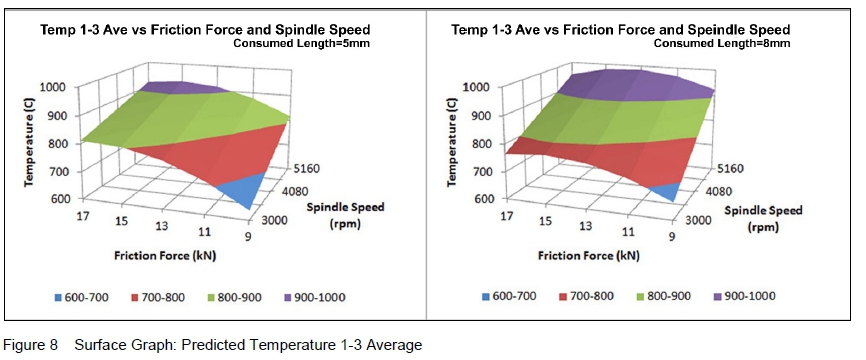
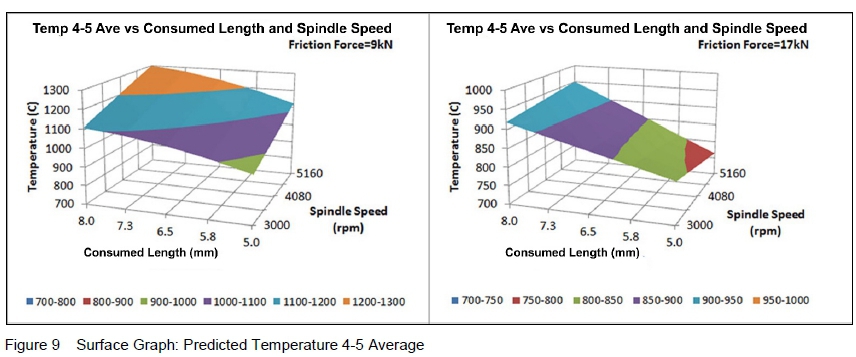
Average temperatures at the bottom of the weld, positions 1, 2 and 3, and top of the weld, positions 4 and 5, as per figure 5, are shown in figure 8 and figure 9 respectively. Effects with dominant influence on temperatures at the bottom of the weld are spindle speed and friction force and to show the influence of these the two graphs are done for consumed length values of 5 mm and 8 mm. Peak temperature in this area can be restricted by decreasing the spindle speed (dominant contributor), while with the simultaneous reduction in friction force, temperature in the mid to lower part of the weld can be reduced. A reduction in spindle speed, together with a reduction in consumable length will result in reducing the peak temperature in the top section of the weld where the consumable length has a direct influence on the temperature in this area due to its dominant contribution to expended flash forming on the surface of the parent material.
It is clear that an increase in spindle speed at lower friction force has a greater effect on temperatures at both the lower and upper levels of the weld, at all values for consumed length. However a change in consumed length has a larger effect on temperatures 4-5 than a change in spindle speed which would be contributed to the exposure time (preheating) and size of flash expelled onto the surface of the parent material. Under similar conditions the model predicts that, for the same percentage increase in both parameters, consumed length will raise the temperature by approximately 1.5 times more than spindle speed. A 60% increase in consumed length (from 5 mm to 8 mm), with spindle speed held constant under the same friction force, would result in a predicted temperature increase of 200 °C, while for an increase of 60% in spindle speed (from 3100 rpm to approximately 5000 rpm) the average temperature increase would be 80 °C, while maintaining a constant consumed length.
Although increased consumed length causes higher peak temperatures at the top of the weld, the size of the flash contributes to expelling impurities in the weld and this needs to be taken into account when optimizing the consumed length distance.
Under similar conditions the model predicts that for an equal increase in both frictional force and consumed length, friction force will result in increasing the friction time by 1.3 times more than the contribution made by the consumed length. Maintaining a constant spindle speed and friction force while applying a 60% increase in consumed length (from 5 mm to 8 mm) result in a predicted friction time increase of 53 seconds, while keeping spindle speed and consumable length constant and applying an increase of 60% to the friction force (from 10 kN to approximately 17 kN) result in a predicted friction time decrease of 65 sec.
3.1.4 Validation of prediction models
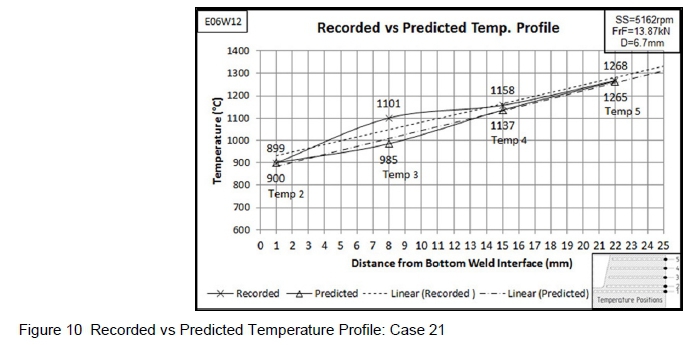
As part of the validation of data for two sets of input parameters as shown in figures 10 and 11, the experimentally recorded values for maximum temperatures, in the vicinity of the weld interface, were compared to a predicted profile.
From these graphs the range of responses, predicted by the regression analysis, can be recognised as well as how this response is influenced by modifications to a single process input or input combination which would have the desirable effect. These relationships could be used to assist in understanding each response within the said range together with its effect and contribution to the process. The effect of consumed length and friction force are similar for both welds with spindle speed set at 5160 rpm for case 21 and 3000 rpm for case 11.
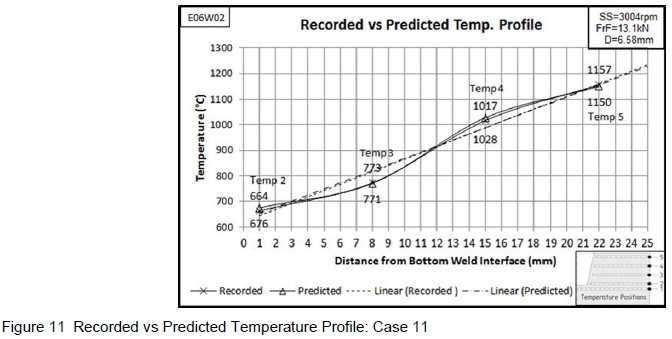
When a lower spindle speed is applied (comparing case 11 to 21) the influence of consumed length becomes more apparent, indicative that spindle speed dominates the influence on temperature at positions 2 and 3, with consumed length contributing equally to the temperature at position 4 while dominating the influence at position 5. This is due to the formation and expelling flash at the top of the weld, thus making a considerable contribution to heat in this region. At position 4 as depicted in figure 11, the noticeable increase in the temperature is thus as a result of the contribution by consumed length, as spindle speed is changed with consumed length and friction force held constant for the two cases. The effect of consumed length is more noticeable at these welding parameters as the temperature, at positions 2 and 3 as a result of spindle speed, is lower for Case 11 than Case 21.
From the data it is evident that weld temperature could be lower if the consumed length is kept to a minimum while employing a lower spindle speed and friction force.
3.2 Process parameter effects
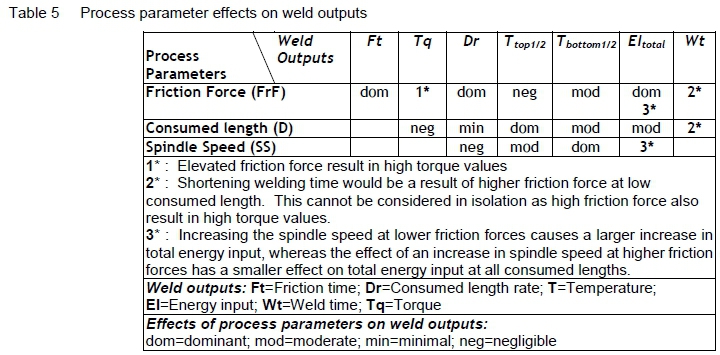
The effects of process parameters on weld outputs are summarised in table 5, giving insight to the complex relationships.
Spindle Speed was found to be most significant in affecting the weld interface temperature, however this influence was linked to friction force for the first part of the weld and plasticised material flow during the final stage of the weld.
4. Conclusions
Da Silva's principle [2], that an increase in friction force, during friction welding, results in an increase in temperature is not fully supported during FHPP as this is only valid at the bottom of the weld and it was found that the influence of friction force from the half-filled position becomes minimal to negligible at the top. This study shows that during FHPP, the dominant effect on temperature is spindle speed with friction force contributing to the bottom half of the weld and consumed length to the top which challenges the inference by Vill [10] who stated that the temperature gradient, during friction welding, is controlled by the friction force. A similar effect of friction force on friction time is observed for FHPP as is reported by Pinheiro [9], Andrews & Beamish [5] as well as Unifried, et al. [11], whereby an increase in friction force causes a decrease in friction time. Statements by Andrews & Beamish [5], Hasui & Fukushima [6] and Meyer et al. [8] that an increase in friction force results in an increase in torque is re-enforced. The contribution of consumed length towards optimizing mechanical properties of the completed weld might have been underestimated during previous studies as the literature reviewed for this work delivered a single article referring to the influence of consumed length concluding that consumed length has no influence on the heat generation rate [5]. This study however shows consumed length to be a significant contributor towards maximum temperatures and energy input.
All the prediction models were found to be valid with acceptable accuracy within the range of input parameters. Prediction ability of the regression models varied with the best prediction done by the equation for friction time, with a predicted R-squared (R2pred) value of 94%.
Analysis of the models developed show that responses depend on multiple inputs and no direct correlation between a response and a given input was found. Results from the regression models closely match the trends and actual data collected during experimentation, as is shown in figures 7 and 8. Multiple regression analysis resulted in valid prediction models with varied, but acceptable accuracy, within the range of input parameters. The influence of consumed length on optimizing mechanical properties of the completed weld was found to be significant due to its contribution towards to maximum temperatures and energy input.
FHPP is shown to be a more complex process than Friction Welding and that generalised Friction Welding conclusions, pertaining to the influences of input parameters on weld outputs, cannot be made as the effects of these inputs differ depending on the combination of levels included in a parameter set. The amount of change in an output variable, due to a change in an input, depends on the levels of the other inputs.
Spindle speed clearly has the highest statistical influence on the temperature gradient for the welds produced and the models developed are good descriptors of process data during FHPP - furthermore is it evident that no single parameter solely controls the weld responses. The developed models could be applied as verification or input parameters during further study and provide a clear understanding of the effects of input parameters on responses.
5. References
[1] D. Hattingh, L. von Wielligh and W. Pentz. Feasibility of utilising Friction Hydro Pillar Processing as a repair technique for incorrectly drilled holes. In International Institute of Welding Congress 2012, Johannesburg, 2012.
[2] A. da Silva, A. Meyer and J. dos Santos. Mechanical and metalurgical properties of friction welded TiC particularly reinforced Ti-6Al-4V. Composite Science and Technology, 64(10-11):1495-1501, 2004. [ Links ]
[3] H. Schmidt and J. Hattel. A local model for thermomechanical conditions in friction stir weldingModelling of Thermo-mechanical conditions in Friction Stir Welding. Modelling and Simulation in Materials Science and Engineering. 13(1):77-93, 2005. [ Links ]
[4] C. van Zyl and D. Hattingh. Temperature distribution for a friction taper stud weld in thick walled 10CrMo910 steel. R&D Journal, 28:37-45, 2012. [ Links ]
[5] R. Andrews and K. Beamish. Characterisation of, and guidelines for, rotary friction welding of common metallic engineering materials. TWI Industrial Member Report Summary 824, 2005.
[6] A. Hasui and S. Fukushima. On the torque in friction welding. Transactions of the Japan Welding Society, 8(1):26-32, 1977. [ Links ]
[7] AWS, Welding Handbook, 8 ed., vol. 2, American Welding Society, 1991.
[8] A. Meyer, D. Pauly, J. dos Santos, G. Pinheiro, A. Roos and D. Gibson. Consideration on robotic friction stitch welding for repair of marine structures. In ETCE/OMEA 2000 Joint Conference, New Orleans, 2000.
[9] G. Pinheiro. Friction hydro pillar processing of lightweight alloys: Bonding mechanisms and joint properties. Institute of Materials Research, GKSS-Forschungszentrum, Summer School, WM, 2006.
[10] V. Vill. Friction Welding of Metals. New York: Reinhold Publishing Corporation, 1962.
[11] J. Unifried, T. Hermenegildo, A. Ramirez, M. Paes and A. Pope. Influence of process parameters in the TMAZ microstructural evolution of C-Mn steels friction hydro-pillar welded joints. In Proceedings of the 8th International Conference: Trends in Welding Research, Pine Mountain, Georgia, 2008.
[12] D. Hattingh, P. Doubell, M. Newby, I. Wedderburn, A. Steuwer and M. James. Friction taper stud welding of creep resistant 10CrMo910 steel. In TMS 2009 Annual Meeting & Exhibition; Friction Stir Welding and Processing-V, San Francisco, Calafornia, 2009.
[13] A. N. Burley. OMEGA Web Technical References. URL https://www.omega.com/techref/pdf/z041-044.pdf.
[14] C. Van Zyl. Analysis andModelling ofthe Temperature Distribution during the Friction Taper Stud Welding of 10CrMo910. MTech Dissertation, Depertment of Mechanical Engineering, Nelson Mandela Metropolitan University, South Africa, 2007. [ Links ]
[15] M. Kleiber and A. Sluzalec. Finite element analysis of heat flow in friction welding. Engineering Transactions, 32(107-1):13, 1984. [ Links ]
[16] D. Montgomery. Design and Analysis of Experiments. 6th ed., USA: John Wiley & Sons, 2005. [ Links ]
Received 14 January 2019
Revised form 26 April 2019

