


Services on Demand
Article
 English (pdf)
 Article in xml format
 Article references
Indicators

Related links
-
 Cited by Google
 -
 Similars in Google
Share

 Permalink
R&D Journal
On-line version ISSN 2309-8988
Print version ISSN 0257-9669
R&D j. (Matieland, Online) vol.35 Stellenbosch, Cape Town 2019
http://dx.doi.org/10.17159/2309-8988/2019/v35a1
Peridynamic Approach to Predict Ductile and Mixed-Mode Failure
J.H. ConradieI; T.H. BeckerII; D.Z. TurnerIII
IDepartment of Civil Engineering, University of Stellenbosch, Stellenbosch, South Africa
IIDepartment of Mechanical and Mechatronic Engineering, University of Stellenbosch, Stellenbosch, South Africa. Email: tbecker@sun.ac.za
IIICentre for Computing Research, Sandia National Laboratories, Albuquerque, NM, USA
ABSTRACT
The peridynamic theory has been developed to address problems in solid mechanics regarding fracture through its integral non-local basis. It has been successful in predicting brittle cracking, however, uncertainty still remains with regards to mixed mode and ductile fracture. This work presents a study in using peridynamics to simulate fracture in mixed mode or ductile type fractures. The results are presented as a quantitative comparison between experimental tests and numerical simulations. Standard compact tension tests were performed on polymethyl methacrylate (PMMA), stainless steel 304L and aluminium 1200H4 to obtain the respective JR-curves and critical energy release rates, Jic. In addition, digital image correlation was employed to allow for qualitative observation of the fracture process and choice in peridynamic input parameters. An equivalent critical stretch was determined for each material and applied to an Arcan geometry. It is shown that the energy release rate for mode I and mode II should be considered separately. Mixed mode type failures cannot be simulated accurately by a single critical stretch criterion. Furthermore, ductile fracture requires careful consideration when selecting peridynamic input parameters.
Additional keywords: Peridynamics, critical energy release rate, digital image correlation
1 Introduction
Peridynamics has been successful in predicting crack initiation, propagation, the crack path and subsequent failure in a number of numerical applications [1-3]. It has mostly been employed in linear-elastic applications [4, 5], specifically in a crack opening mode (mode I) assuming a brittle fracture mechanism. The main advantages to using peridynamics to model failure over other methods are that the formulation is free of all spatial derivatives and is computationally convenient to implement. Rather than computing spatial rates of change using traditional derivatives, nonlocal operators are employed which are mathematically appropriate for discontinuous fields or fields with low regularity. If the underlying problem is smooth the peridynamic approach will converge to the finite element solution. However, when the problem includes discontinuities the peridynamic approach can capture these non-smooth features whereas the finite element method cannot without building in additional sophistication. However, it is noted that monolithic peridynamic simulations are rarely performed in practice.
To date, literature shows limited peridynamic fracture studies in an in-plane shear opening mode (mode II) or a mixed mode (combination of mode I and II). It has been suggested that linear-elastic fracture mechanics (LEFM) parameters can be employed to model crack propagation in materials that exhibit a ductile fracture mechanism [6]. However, this can be contended when considering the current state of the art showcased in ductile failure x-prize. Here, peridynamics as well as other continuum theories, such as the extended finite element method, were challenged to predict the fracture load of a mixed mode tension test [7]. All numerical simulations, including peridynamics, compared poorly with experimental results.
Recently it was shown that peridynamics can be employed to simulate the fracture initiation load and an estimate crack path of particular mixed-mode tests on brittle polymers [8, 9]. Madenci and Otterkus [9] found good correlation from simulating mixed mode tests conducted by Ayatollahi and Aliha [10]. In another case Polymethyl methacrylate (PMMA) specimens were tested in mode I, mixed mode and mode II and simulated with a brittle elastic peridynamic model by Caimimi et al [8]. The simulations were able to capture the fracture initiation load and the crack path position under the different modes. However, the pure mode II results were overestimated compared to the tests.
The challenging aspect of simulating ductile fracture when using the peridynamic formulation lies with the single critical stretch failure criterion that governs the local yield point. The critical stretch is often determined by using the total elongation in uniaxial tension tests, or with the calibration of numerical models to fit experimental data [6] introducing a degree of unreliability. More recently, the critical stretch has been related to the fracture mechanics based critical energy release rate by Foster et al. [11], showing agreement with experimental data [9, 10]. Foster et al also proposed that the non-linear critical energy release rate (more popularly known as the J-integral) can be used to determine the critical stretch in ductile failure simulations [7].
This work presents a study in using the critical energy release rate to simulate i) mixed mode and ii) ductile fracture loads. The results are presented as a quantitative comparison between experimental tests and numerical simulations. In addition, digital image correlation (DIC) obtained full field displacement maps are imposed as boundary conditions onto the peridynamic formulation to demonstrate the concept of the critical stretch parameter. It is shown that the critical stretch can be determined from a non-linear critical energy release rate obtained from standard compact tension tests. It is also shown that the mode of failure and the corresponding mode critical energy release rate should be taken into account to obtain more accurate fracture loads.
2 Peridynamic Formulation
The peridynamic theory is a reformulation of classical continuum mechanics and has many similarities to molecular dynamics. In the state-based approach to peridynamics, quantities of interested defined over local regions of the domain or states are used to describe the interaction of forces between particles within a material radius called the horizon. The integral formulation holds the advantage of allowing for a discontinuous continuum, as opposed to spatial partial derivatives that inherently cannot accommodate discontinuities.
The governing formulation of peridynamics is based on the balance of forces between particle point χand its neighbours x' within the horizon Hxof radius δ. The vectors linking χand x' is called a bonds. A bond interaction is expressed in terms of a piecewise force state T, defined at position χand time t. The basic equations of the peridynamic model include the equation of motion and is expressed as [12]
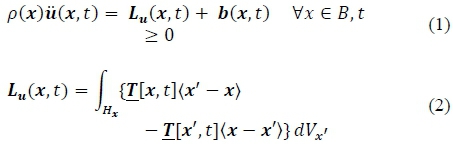
Here, ρis the density, u is the displacement, and b is the body force density. The integral Lu(x, t) is defined over Hx, which is the compact supported domain of the pairwise force function around point x.
In the absence of body forces and in a quasi-static state, Equation 1 and 2 can be rewritten as
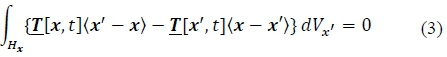
Τ corresponds to a linear micro-elastic potential that has the form
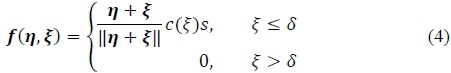
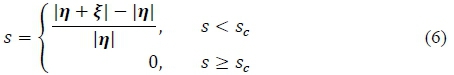
where the relative position, ξ, and relative displacement, η, between χand x' with respect to reference configuration are given by ξ = x' - χand η = u(x', t) - u(x, t) respectivly. The stretch of bond s is calculated by taking the magnitude of the position vector between two points such that s = (||N + ξ\\-ξ)/ξ and c( ξ), where ξ = ||ξ||, is a micro-modulus that has the meaning of the bond elastic stiffness.
For a plane stress state, the micro-modulus may be obtained for the reference state using
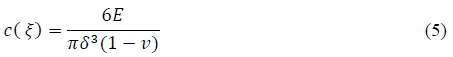
where Εis the Young's modulus and νis the Poisson's ratio. The bond stretch is calculated by taking the magnitude of the relative position vector between two points. Failure is governed by the critical stretch, sc, where subscript c designates the critical stretch. When a bond stretch exceeds this quantity it is regarded as irreversibly broken and no longer contributes to the force interactions.
Peridynamic damage is defined as the reduction in the micro modulus due to broken bonds and can be simply expressed as
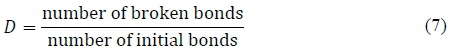
where D = 0 is virgin material and D = 1 is complete disconnection of all bonds to the particle. The coalescence of broken bonds represent a fracture surface and therefore a damage of D = 0.5 and higher would indicate that a fracture surface has formed. Silling and Askari [6] have related scto the energy required fracture of a body per unit length, referred to in the field of LEFM as the critical energy release rate, Gic, where subscript I indicates a mode I and subscript c the critical energy release rate.
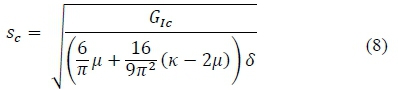
Here, μis the shear modulus and κthe bulk modulus. Equation 7 can be generalised to determine the critical stretch of a single bond in a two-dimensional domain as [9]. Giccan be obtained experimentally by using standardised testing methodologies, such as ASTM-E1820 [13].
3 Methodology
The study aims to conduct both mixed mode and ductile fracture investigations to further establish the capabilities of the peridynamic methodology. As such, the experimental plan entails two separate investigations that focus on i) mixed mode brittle fracture and ii) mode I ductile fracture.
To obtain valid J-integral values, Jic, a standardised Compact Tension (CT) test geometry as described in ASTM-E1820 was used, testing three different materials that exhibit distinctively different material behaviours. Subsequently, experimental investigations were undertaken using a modified Arcan test geometry [14, 15] to obtain respective fracture loads. The study culminates in a numerical analysis of the experimental test, comparing experimental and numerical load-displacement curves (plotted as crosshead displacement vs. applied load) and the peak loads at fracture.
In conjunction, DIC was utilised during the CT tests to allow for full field displacement measurements of the specimen surface during experimental testing. The DIC obtained displacement maps were imposed as boundary conditions into the peridynamic framework to allow for visual representation of damage using Equation 3. This technique was previously presented by the authors in [16].
3.1 Material selection
Polymethyl methacrylate (PMMA), stainless steel 304L and aluminium 1200H4 were utilised to study both brittle and ductile fracture. PMMA exhibits a near perfect brittle behaviour, stainless steel shows significant strain hardening post yield and aluminium can be regarded as a near perfect plastic material. All three materials are assumed to be homogenous and isotropic. Elastic properties were taken as Young Modulus Ε = 1.7 GPa and Poisson's ratio ν = 0.35 for PMMA, Ε = 193 GPa and Ε = 70 GPa [17] for stainless steel 304L and aluminium 1200H4 respectively, with ν = 0.30.
3.2 Standardised tests
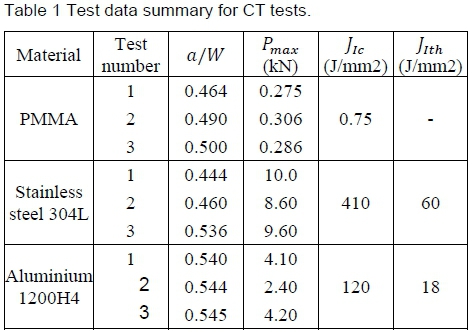
PMMA CT samples had a thickness of Β = 12 mm and a width of W = 50 mm to allow for LEFM conditions. To ensure ductile failure mechanisms, steel / aluminium samples were thinner with a thickness of Β = 6 mm. Samples were fatigue pre-cracked using an Intron servo-hydraulic testing machine fitted with a 50 kN load cell at a cyclic frequency of f = 10 Hz and a load ratio R ~ 0.1. The pre-crack length, a, is given in Table 1. Three samples for each material were tested.
J-integral tests were conducted in quasi-static load and unload rate of 0.1 mm/min and 1.5 mm/min respectively. For this, a Zwick® Z250 tensile machine fitted with a 250 kN load cell was used. Recorded were crack mouth opening curves and fracture loads which were used to calculate JR-curves and Jicaccording to ASTM-E1820 for the respective materials. Tests were conducted in ambient conditions.
3.3 Arcan tests
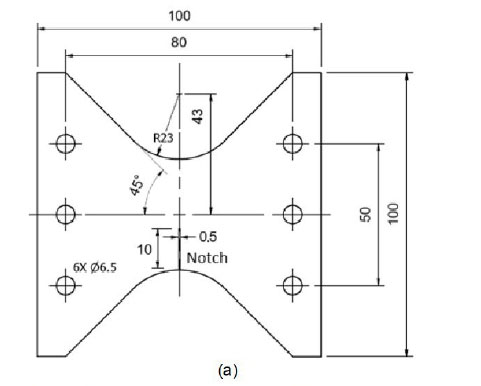
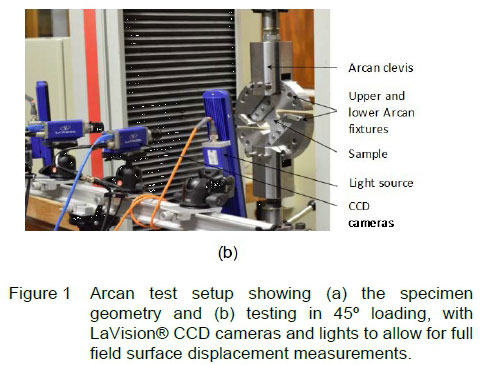
An Arcan fixture was designed and built that allows for mode I (tension, crack plane perpendicular to load direction), mode II (in-plane shear, crack plane parallel to load direction) and mixed mode loading (combination of tension and in-plane shear) with configurations in 15-degree increments. Originally developed by Arcan et al. [18] for mixed mode fracture investigations of composites. The geometry was modified by Amstutz et al. [14, 15] to allow for a simpler butterfly-shape sample design. Figure 1a shows the Arcan sample geometry and Figure 1b the test configuration of the Arcan setup. It is noted that the sample is clamped to the fixture using 3 mm plates and therefore the sample was considered as completely constrained.
PMMA Arcan samples had a thickness of Β= 12 mm and in the crack plane width of W = 40 mm. The steel /aluminium sample had dimensions Β= 3 mm and W = 40 mm. The PMMA samples were pre-cracked using a razorblade. As outlined for the CT tests, the stainless steel / aluminium samples were fatigue pre-cracked. Pre-crack lengths are summarised in Table 2.
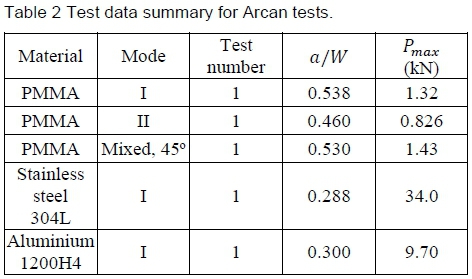
Fracture tests were conducted in quasi-static loading of 0.1 mm/min. The PMMA samples were tested in mode I, mode II and mixed mode at 45° crack plane inclination to the loading direction. Steel / aluminium samples were tested in mode I only. Recorded were load-displacement curves and fracture loads. All testing was conducted in ambient conditions.
3.4 Damage mapping using digital image correlation
A post-processing algorithm developed by the authors in [16], uses the DIC obtained displacement maps to measure the extent of peridynamic damage, calculated using Equation 7, where a ratio of the number of broken bonds vs. the number of initial bonds is considered for each node. Here, the technique is used to qualitatively demonstrate the choice in critical stretch as a failure criterion.
The DIC equipment used was a LaVision® 5-megapixel system with 12-bit resolution as shown in Figure 1b. DaVis® version 8.2, which assumes linear affine transformations and a zero normalised sum-square difference (ZNSSD) algorithm to map subsets, was used to compute the surface displacement maps. A 6th order spline interpolation was employed for sub-pixel determination. LaVision® claims a typical accuracy of 0.01 pixels for in-plane and 0.02 pixels for out-of-plane deformation can be obtained. For specimen surface preparation black and white spray paints were used to obtain speckle patterns of five or more pixels in size. This allows for three or more speckle features per subset. It is worth noting that a trade-off between subset size and spatial resolution exists: a larger subset results in more accurate displacement maps at the cost of spatial resolution, i.e. accurately capturing high strain gradients near the crack tip. To allow for a better-defined crack tip field and crack path a 'medium' sized subset (of 31x31 pixels) was chosen with a 'small' step size.
Analysis of the PMMA samples used a step size of 12 pixels, whereas the steel / aluminium samples utilised a step size of 6 pixels. In addition, a dense displacement map allows for a finer peridynamic discretization as recommended by the authors in [16].
The noise floor value was measured at 0.68 x 10⁻⁴mm, 2.60 x 10⁻⁴mm for the PMMA and steel / aluminium respectively (measured as the standard deviation of the displacements determined from two unloaded images). Rigid body tests showed an average error of 3.10 x 10⁻⁴ mm.
4 Experimental results
The investigation into the energy release rate based critical stretch considered two criteria for i) mixed mode and ii) ductile fracture, where a designation of I and II designates mode 1 or 2 respectively, and c and th designates a critical or threshold value. This is further outlined below.
4.1 Energy release rate and fracture load
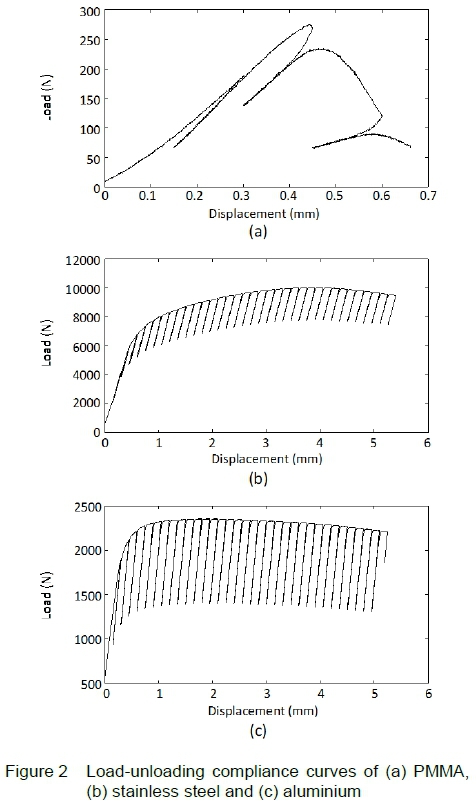
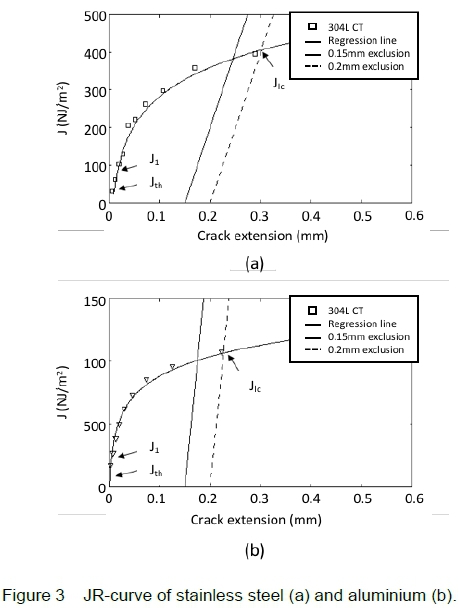
Load-displacement curves for the CT samples are shown in Figure 2, the resultant JR-curves are shown in Figure 3 and the respective Jic values summarised in Table 1. PMMA CT Jicresults correlated within 4% to that found by Ayatollahi and Aliha [19]. It is worth noting that only a single load-unloading compliance curve was achieved for the PMMA specimens due to the brittle nature of PMMA (Figure 2a). Similarly, Table 2 summarises the Arcan pre-crack lengths and fracture loads. All data is reported to three significant figures.
4.2 Peridynamic damage and critical stretch
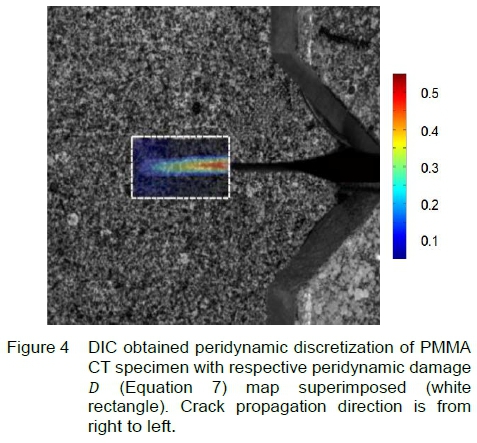
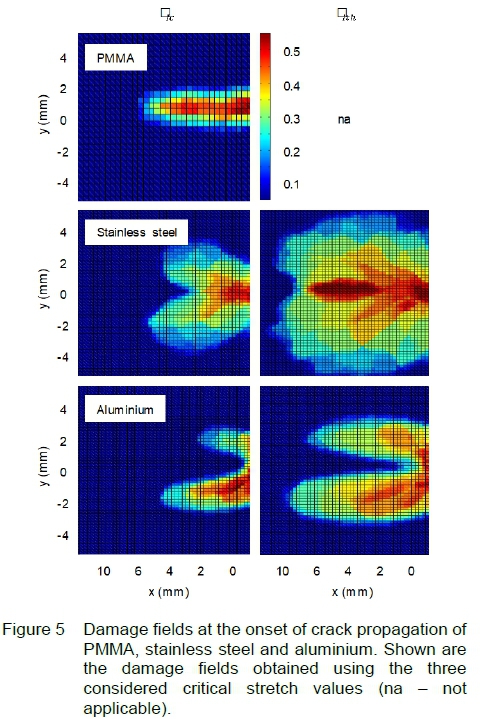
Figure 4 depicts the DIC obtained peridynamic discretization of a PMMA CT sample with the respective damage map superimposed onto the image. Such analyses were undertaken for the three considered materials. The effect of choice in the critical stretch on the damage a head of the crack tip is illustrated in Figure 5.
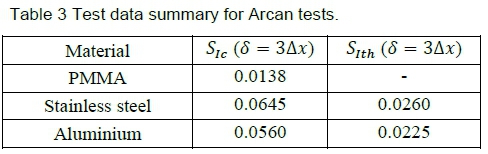
The critical stretch values obtained using Equation 8 for the three considered materials are summarised in Table 3, based on a horizon radius of δ = 3Δx. Two critical stretch values were considered: (i) sicbased on the ASTM obtained Jic, and sithbased on a Jithvalue at a crack extension of 0.015 mm, chosen as 10% of the 0.15 mm exclusion line (Figure 4). It is argued that the energy dissipation at crack initiation would be a more appropriate quantity for predicting fracture loads when using the elastic peridynamic model. Moreover, using siccorresponds to a state in which the material has already undergone significant plastic deformation and hence results in less sensitive damage mapping.
The peridynamic damage of the PMMA specimen correlates closely to the crack position (approximately at coordinates 4,0 in Figure 5), where the crack tip location is interpreted at a damage of D = 0.5. It is worth noting that the inherent limitations of DIC, in resolving displacements near discontinuities such as across the crack, introduces a degree of inaccuracy. This results in smeared damage field over the region of the crack as seen in Figure 3 for PMMA. Investigations into increasing the horizon radius showed a more defuse damage field. Similar to the aforementioned DIC limitations, a trade-off exists between the horizon radius.
A larger horizon radius results in refinement of the damage field, however at the cost in accuracy of the crack location. The particle spacing used in Figure 5 coincided with the DIC grid spacing, namely Δx = 0.227 mm and Δx = 0.113 mm for PMMA and steel / aluminium respectively.
It is seen from Figure 5 that sicgives a damage field in the region where plastic deformation is occurring. The region where the crack is interpreted as initiated is also revealed. A lowered critical stretch, sith, results in a more diffused damage field: Implementing sicas failure criterion at the onset of fracture shows a moderate plastic damage field, however, for a sithfailure criterion the damage becomes increasingly defused and shows extensive damage ahead of the crack tip.
5 Numerical implementation
The Arcan geometry was modelled using an open source code Mingus from Sandia Corporation. The geometry and mesh were generated in Cubit ver. 12.2. All models were simulated in two dimensions under a plane stress assumption. In line with the experimental plan, the numerical study entails two separate investigations that focus on i) brittle, mixed mode fracture and ii) ductile fracture in mode I. The output of the numerical simulation are load displacement curves and respective fracture loads.
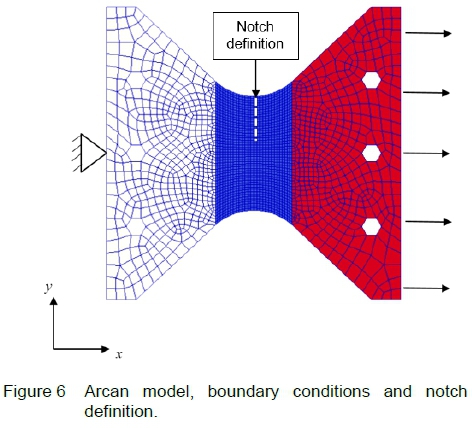
5.1 Boundary conditions and mesh
Figure 6 depicts the Arcan model, mesh, boundary conditions and the pre-defined notch position. Peridynamic particles were spaced Δx = 1 mm apart in the middle section (blue) and Δx = 4 mm apart at the respective left and right boundaries (white and red). The notch and pre-crack were defined by removing the bond influence between particles over the location of the pre-defined crack. The left section (white) of the geometry was fully constrained in translation in both x and y-directions. The right section (red) was assigned a displacement of ux= 0.01 mm for mode I, uy= -0.01 mm for mode II and ux= 0.00707 mm, uy= 0.00707 mm for 45° mixed mode investigations.
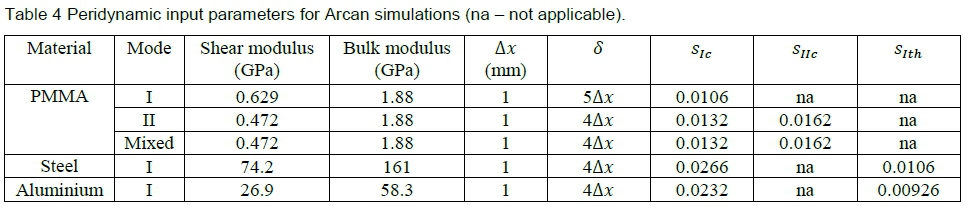
5.2 Input parameters
The input parameters are summarised in Table 4. Note that for shear loading (mode II and mixed mode) the shear moduli were reduced by 25%. It was found that this adjustment captured the shear behaviour more accurately, however, needs more verification. In addition, mode II and mixed mode simulations also considered a critical stretch siic, derived from Kiic= 1.48  fracture toughness by Ayatollahi et al. [17] using the well-established relationship Κ =
  [20].
[20].
5.3 Numerical results
Figure 7 shows the load-displacement results for the mixed mode investigations. Figure 8a summarizes the numerically obtained fracture loads for PMMA. Mode I obtained fracture loads correlated within 5.5%. This serves as further quantitative validation in using the critical energy release rate to determine the critical stretch to predict fracture loads as proposed by Foster et al [11]. The mode II and the 45-degree mixed mode results yielded less accurate fracture loads (within 27%). It is argued that a mode I assumed critical stretch does not incorporate the shear type failure mechanisms. When using an equivalent mode II critical stretch, the correlation between fracture loads improves to 9 %. It is therefore argued that the peridynamic formulation does not capture the type of fracture mechanism, the increase in accuracy served as verification that the corresponding energy release rate should be considered when determining the critical stretch to analyse mode II loading. The mixed mode simulations correlated poorly using both mode I and mode II energy release rate based failure criterions. This suggests that the corresponding mixed mode energy release rate should be considered to determine the critical stretch.
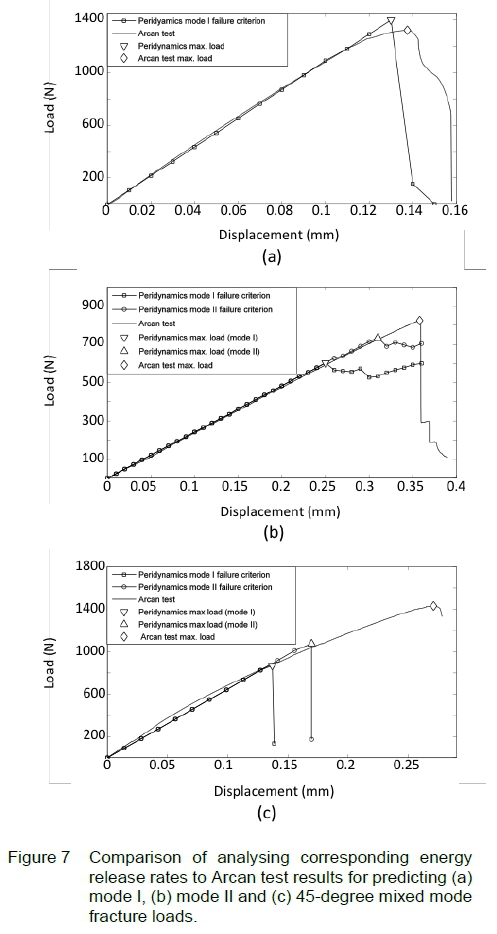
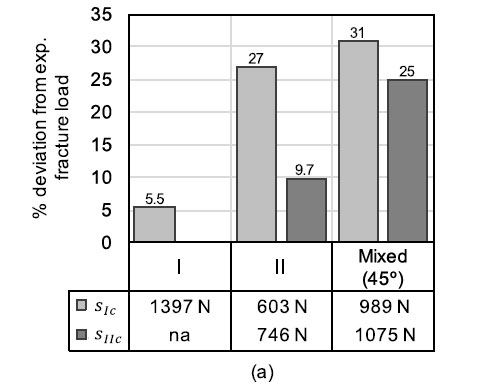
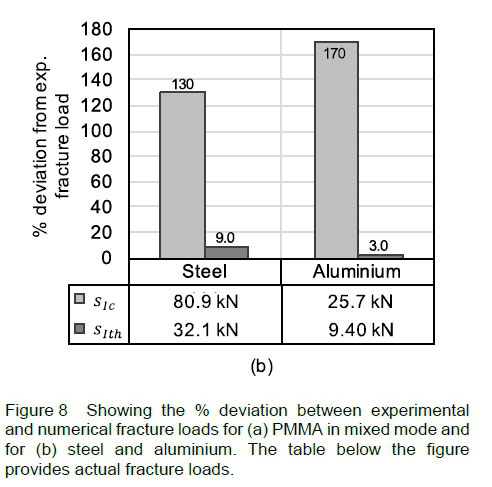
Figure 8b summarizes the numerically obtained fracture loads for steel and aluminium. It is evident that implementing sithyielded considerably more accurate fracture loads. It is argued for an elastic peridynamic material model, the threshold approach should be considered for determining the critical stretch. As opposed to implementing Jic, which corresponds to the energy dissipated after crack extension, the Jithcorresponds to the fracture load at crack initiation..
It is proposed that if the JR-curve is implemented as a function the entire progression of ductile failure can be captured. With other words, incorporating the JR-curve as a non-linear failure criterion can provide the essential means to capture the material ductile fracture mechanism
6 Conclusion
• This study used the LEFM critical energy release rate to simulate mixed mode and ductile fracture loads. The results were presented as a quantitative comparison between experimental tests and numerical peridynamic simulations.
• DIC obtained surface displacement maps were imposed as boundary conditions onto the peridynamic framework to investigate the critical stretch criterion. The methodology served as a qualitative tool to demonstrate the damage mechanisms in peridynamics.
• The JR-curve was identified as the essential means to determine the critical stretch to predict fracture loads. However, it was shown that the energy release rate for mode I and mode II should be considered separately. Mixed mode type failures cannot be simulated accurately by a single critical stretch criterion.
• The results suggest that the classical peridynamic framework cannot accurately predict failure loads in mixed mode type loading.
• Similarly, it was shown that ductile fracture load cannot be accurately simulated when using the standardised Jic, non-linear critical energy release rate. Considerations need to be made with respect to a non-linear crack initiation energy release rate.
Nomenclature Roman
b body force density [N/m3]
c micro-modulus [N/m]
D peridynamic damage
E Young's modulus of elasticity [GPa]
Hx horizon [m]
Gic critical energy release rate [J/m2]
Lu pairwise force function [N/m3]
Pmax max load [kN]
u displacement vector [m]
t force scalar state [N/m4]
x position vector [m]
x' position vector of neighbouring point[m]
s stretch
sc critical stretch
Τ piecewise force state [N/m3]
Greek
δ radius [m]
ρ density [kg/m3]
ξ relative position of two particles [m]
η relative displacement of two particles [m]
ν Poisson's ratio
μ shear modulus [GPa]
κ bulk modulus[GPa]
7. References
1. S. A. Silling. Reformulation of elasticity theory for discontinuities and long-range forces. Journal of the Mechanics and Physics of Solids, 48(1):175-209, 2000. [ Links ]
2. W. Gerstle, N. Sau and S. A. Silling. Peridynamic modeling of concrete structures. Nuclear Engineering and Design, 237(12-13):1250-1258, 2007. [ Links ]
3. W. Gerstle, N. Sau and E. Aguilera. Micropolar peridynamic constitutive model for concrete. 19th International Conference on Structural Mechanics in Reactor Technology (SMiRT 19), B02/1-2, 2007.
4. Y. D. Ha and F. Bobaru. Characteristics of dynamic brittle fracture captured with peridynamics. Engineering Fracture Mechanics, 78(6):1156-1168, 2011. [ Links ]
5. E. Askari, J. Xu and S. A. Silling. Peridynamic analysis of damage and failure in composites. 44th AIAA Aerospace Sciences Meeting and Exhibit, 2006.
6. S. A. Silling and E. A. Askari. Meshfree method based on the peridynamic model of solid mechanics. Computers & Structures, 83(17-18):1526-1535, 2005. [ Links ]
7. B. L. Boyce, J. E. Bishop, T. Cordova, J. V. Cox, T. B. Crenshaw, K. Dion, K. Dowding, J. M. Emery, J. T. Foster, J. W. Foulk III, D. J. Littlewood, A. Mota, J. Ostien, J. Robbins, S. A. Silling, B. W. Spencer and G. W. Wellman. Ductile failure x-prize. Technical report SAND2011-6801, Sandia National Laboratories, 2011.
8. F. Caimmi, E. Haddadi, N. Choupani, C. Marano and L. Andena. Modeling mixed-mode fracture in poly (methylmethacrylate) using peridynamics, Procedia Structural Integrity, 2, 166-173, 2016. [ Links ]
9. E. Madenci and E. Oterkus. Peridynamic Theory and Its Applications. Springer, New York, 2014.
10. M. R. Ayatollahi and M. R. M. Aliha. Analysis of a new specimen for mixed mode fracture tests on brittle materials. Engineering Fracture Mechanics, 76(11):1563-1573, 2009. [ Links ]
11. J. T. Foster, S. A. Silling and W. Chen. An energy based failure criterion for use with peridynamic states. Journal for Multiscale Computational Engineering, 9(6):675-687, 2011. [ Links ]
12. S. A. Silling, M. Epton, O. Weckner, J. Xu and E. Askari. Peridynamic states and constitutive modeling. Journal of Elasticity, 88(2):151-184, 2007. [ Links ]
13. ASTM-E1820. Standard test method for measurement of fracture toughness. Standard, American Society for Testing Materials, West Conshohocken, 2011.
14. B. E. Amstutz, M. A. Sutton and D. S. Dawicke. An experimental study of CTOD for mode I/II stable crack growth in thin aluminium specimens. ASTM STP 1256 on Fracture Mechanics, 26:256-273, 1995.
15. B. E. Amstutz, M. A. Sutton, D. S. Dawicke and M. L. Boone. Effects of mixed mode I/II loading and grain orientation on crack initiation and stable tearing in 2024-T3 aluminum. Fatigue and Fracture Mechanics, 27:217-224, 1997. [ Links ]
16. J. H. Conradie, D. Z. Turner and T. H. Becker. Characterising damage in structural materials using digital image correlation and peridynamics. 9th Conference on Computational and Applied Mechanics, South Africa, 2014.
17. N. Hallback and F. Nilsson. Mixed-Mode I/II fracture behaviour of an aluminium alloy. Journal of Mechanics and Physics of Solids, 42(9):1345-1374, 1994. [ Links ]
18. M. Arcan, Z. Hashin and A. A. Voloshin. Method to produce uniform plane-stress states with applications to fibre-reinforced materials. Experimental Mechanics, 18(4):141-146, 1978. [ Links ]
19. M. R. Ayatollahi, M. R. M. Aliha and H. Saghafi. An improved semi-circular bend specimen for investigating mixed mode brittle fracture. Engineering Fracture Mechanics, 78(1):110-123, 2011. [ Links ]
20. T. L. Anderson. Fracture Mechanics: Fundamentals and Applications. 2nd edition, CRC Press, 1994.
Received 26 June 2018
Revised form 18 December 2018
Accepted 17 January 2019

