


Services on Demand
Article
 English (pdf)
 Article in xml format
 Article references
Indicators

Related links
-
 Cited by Google
 -
 Similars in Google
Share

 Permalink
R&D Journal
On-line version ISSN 2309-8988
Print version ISSN 0257-9669
R&D j. (Matieland, Online) vol.34 Stellenbosch, Cape Town 2018
ARTICLES
Wind tunnel testing considerations in expansion tan/shock wave interaction studies
L. NelI, II; B. W. SkewsII
IAeronautic Systems Competency, Defence Peace Safety and Security, Council for Scientific and Industrial Research, 627 Meiring Naudé Road, Pretoria, South Africa. E-mail: lnel@csir.co.za
IIFlow Research Unit, School of Mechanical, Industrial and Aeronautical Engineering, University of the Witwatersrand, 1 Jan Smuts Avenue, Johannesburg, South Africa. E-mail: beric.skews@wits.ac.za
ABSTRACT
In the research into expansion fan/shock wave interactions, wind tunnel testing is an essential tool allowing controlled freestream conditions and variation of parameters of interest. However, certain considerations must be accounted for in the wind tunnel model design, data collection, and interpretation of the results in order to ensure good quality results and accurate interpretation thereof. Model design involved sizing of the model such that the tunnel is able to start, design of an attachment mechanism to allow mounting into the tunnel, prediction of the aerodynamic loads encountered by the model both on tunnel startup and during operation, and ensuring that the material strength of the model and support structure was sufficient to prevent failure. Schlieren flow visualization is the appropriate tool for the study of compressible flows, and careful attention was paid during setup to reduce the schlieren angle and place the cut-off at the correct location to minimise the optical aberrations of coma and astigmatism. When studying the schlieren results, visualization of the three-dimensional shock waves as regions, rather than lines, and the shock wave emanating from the lower surface of the expansion generator were taken into account for accurate interpretation. Adhering to these considerations allowed the physics involved in an expansion fan/shock wave interaction to be investigated.
Additional keywords: Wind tunnel model, optical flow visualization, schlieren, three-dimensional shock wave
Nomenclature Roman
P pressure [kPa]
T temperature [K]
M Mach number []
Greek
β shock angle [degrees]
γ ratio of specific heats of air []
1 Introduction
In supersonic flight, shock waves and expansion fans develop as mechanisms for air to flow around the aircraft.
When aircraft or other aerodynamic bodies are in close proximity - such as in the cases of store carriage and release, engine inlets, formation flying, adjacent missiles, and launch vehicle separation - the shock waves and expansion fans interact and alter the flow field surrounding the aircraft. Limited studies have been conducted on the fundamental flow physics of an expansion fan/shock wave interaction and consequently further examination is merited, with emphasis on an experimental investigation due to the novelty of the research. Wind tunnel testing is particularly appropriate for the experimental investigation of an expansion fan/shock wave interaction, allowing for controlled variation of parameters of interest - such as flow deflection angles and vertical separation distance of the bodies - and known freestream conditions (Mach number, static pressure, and static temperature). This paper details the considerations involved in wind tunnel testing to study an expansion fan/shock wave interaction, including the design of a unique wind tunnel model, data collection, and the interpretation of wind tunnel test results.
2 Model Design Considerations
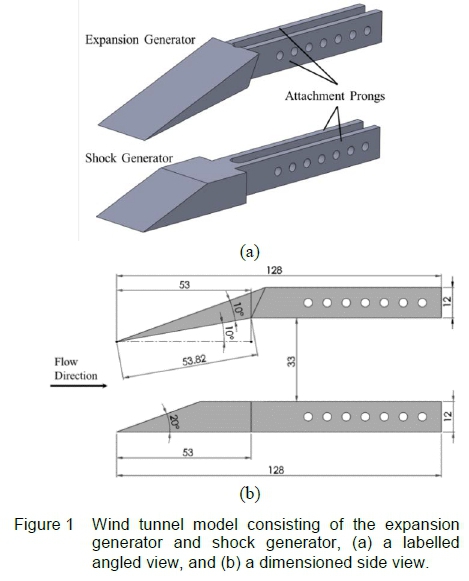
The wind tunnel model used for researching expansion fan/shock wave interactions consisted of two wedges - one generating the shock wave (referred to as the shock generator) and the other generating the expansion fan (referred to as the expansion generator) - arranged with the expansion generator above the shock generator. The wedges and support structure were designed to allow the study of expansion fan/shock wave interactions at various vertical separation distances and horizontal relative positions. Three critical factors were taken into account in the model design (and indeed should be accounted for when designing any model for testing in a supersonic wind tunnel) - the size of the model, the interface allowing the model to be mounted inside the tunnel, and the aerodynamic loads acting on the model (including the loads associated with the tunnel startup shock).
2.1 Model Sizing
The size of a wind tunnel model is constrained by the maximum area ratio of model frontal area to wind tunnel test section area at which the tunnel can start. A supersonic wind tunnel is said to be started when supersonic flow is achieved in the test section [1]; too large a model can cause a normal shock wave upstream of the model and the flow to choke (reach and remain at Mach 1 [1]) around the model, preventing supersonic flow from being established in the test section [2]. The maximum permissible model blockage is both geometry and wind tunnel dependent (i.e. dependent on Mach number and stagnation pressure which vary for different wind tunnels according to the operating envelope of the tunnel), although Volluz [2] provides general guidelines. In the case of the University of the Witwatersrand's supersonic wind tunnel, a model with frontal area greater than 9 % of the test section cross-sectional area (101 mm x 101 mm) is sufficient to prevent tunnel startup.
In the design of the expansion generator and shock generator, the wedge angles were selected to yield both adequate flow deflection angles and the expansion fan/shock wave interaction occurring between the wedges (not too far downstream) while being below the shock detachment angle. Following the wedge angle selection, the wedge span, length, and thickness were calculated such that the combined frontal area was below the requisite 9% of the tunnel test section area. The expansion generator and shock generator with dimensions given in figure 1b and a 25 mm span resulted in a combined tunnel blockage of 8.2 %, which was sufficiently low to allow tunnel startup. These dimensions had the consequence that the wedges had a low aspect ratio, which was advantageous in that the model was well away from the tunnel walls (and therefore negated any wall or tunnel boundary layer interference on the flow field of interest) but caused three-dimensional effects to dominate the flow field (which impacted the interpretation of the results).
2.2 Model Mounting
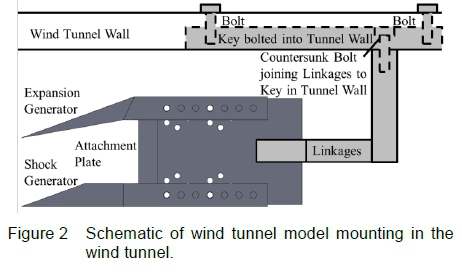
The University of the Witwatersrand's supersonic wind tunnel allows for model mounting by means of a key bolted into the tunnel wall and a series of linkages bolted to the key, culminating in an attachment plate with holes drilled at various locations to allow for model mounting at various horizontal and vertical positions. The expansion generator and shock generator were each designed to have attachment prongs with a series of holes drilled through (shown in figure 1a); the attachment prongs fitted around the attachment plate and a pair of holes aligned with the holes in the attachment plate to allow the two components to be bolted together. Alignment of the holes in the attachment prongs of each of the wedges with the various holes in the attachment plate allowed for alteration of the vertical separation distance and variation of the horizontal relative positions of the expansion generator and shock generator. A schematic of one mounting configuration of the wedges in the tunnel is shown in figure 2.
2.3 Aerodynamic Loading
It is important to calculate the aerodynamic loading on the expansion generator and shock generator to ensure that the material used for wedge manufacture and the bolts used for mounting the model into the tunnel are of sufficient strength to prevent failure and subsequent damage to both the model and tunnel. There are two categories of aerodynamic loading that must be accounted for - the aerodynamic load on the wedges associated with the flow over the wedges during tunnel operation and the impulse aerodynamic loading associated with tunnel startup, as the startup shock moves through the tunnel test section.
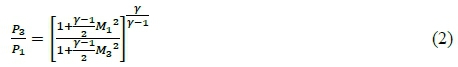
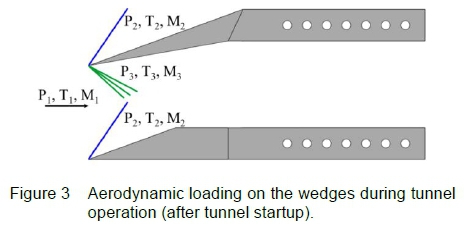
The aerodynamic loading on each of the wedges during tunnel operation can be calculated according shock-expansion theory, explained by Anderson [3] and replicated here for completeness, with the pressure ratio across an oblique shock given by

where Mi is the upstream Mach number, β is the shock angle, and γ is the ratio of specific heats of air. The pressure ratio across an expansion fan is given by
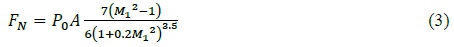
A schematic of the aerodynamic loading on the wedges is given in figure 3 and the results are given in table 1.
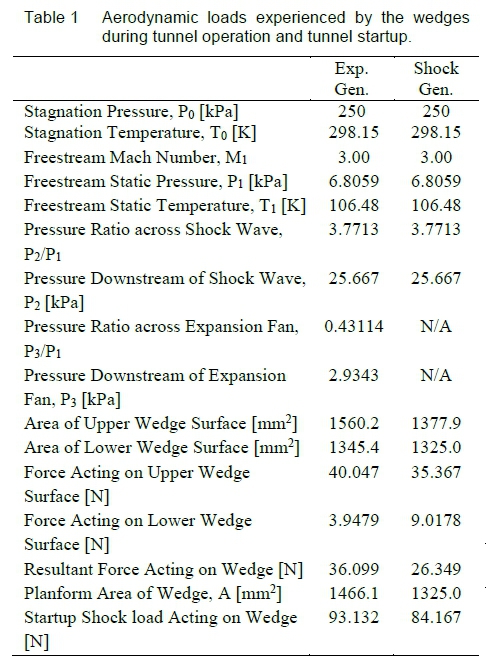
The normal force experienced by the wedges on tunnel startup can be predicted according to the expression given in [2], replicated here for completeness the 2024 aluminium alloy is a suitable material for the wedge manufacture and that the wind tunnel model and bolted joints have sufficient strength to prevent model failure. With a suitably designed model, wind tunnel testing to research an expansion fan/shock wave interaction can be conducted.
where P0 is the instantaneous total pressure on startup, A is the total planform area of the wedge, and Mi is the desired freestream Mach number. The startup shock loads experienced by each of the wedges are given in table 1.
3 Data Collection Considerations
The objective of investigating an expansion fan/shock wave interaction should dictate the data collection method(s). Since the interaction occurs between the expansion generator and the shock generator, a method allowing for visualization of the flow field is preferable while surface measurements or loads on the wedges will not provide meaningful data. Consequently, optical flow visualization methods are ideally suited as the data collection method for this research, with the added advantage of being non-intrusive and therefore not influencing the flow field of interest [4]. In particular, schlieren flow visualization (which operates on the principle that changes in fluid density cause a change in refractive index, thereby deflecting a light beam [4]) is especially appropriate for the visualization of compressible flows where changes in fluid density and density gradients are present [5].
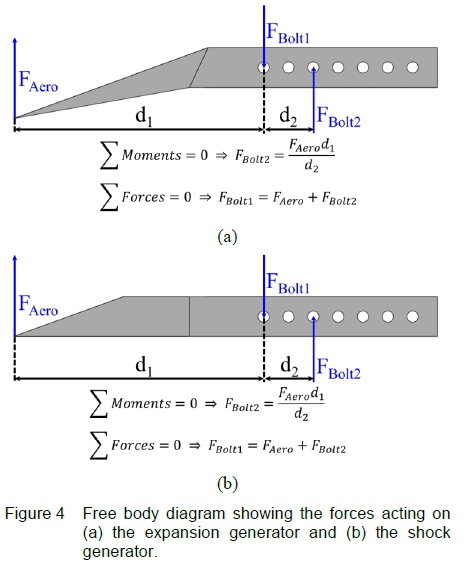
A monochrome/colour schlieren system was used for the visualization of an expansion fan/shock wave interaction in the University of the Witwatersrand's supersonic wind tunnel, with a 900 lumen LED continuous light source and the light beam collimated between two f/8 parabolic mirrors of diameter 152mm at a schlieren angle of 3o - a schematic of which is shown in figure 5. The resulting images were captured with a Nikon D90 digital SLR camera. In an effort to minimise vibrations transmitted from the tunnel to the optics system and due to space constraints of the laboratory, the schlieren system was mounted on an overhead gantry with the consequence that it was set up in a U-configuration rather than the preferred Z-configuration. Use of the system in a U-configuration meant that care had to be taken during the setup of the system to minimise the schlieren angle in order to reduce coma (the smearing of a point of light into a line, resulting from the use of the mirrors off-axis) in the system [6]. A further two optical aberrations had to be considered during setup of the schlieren system. Firstly, astigmatism (distortion of the image resulting from a difference in position of the vertical/tangential focal point and horizontal/sagittal focal point, also arising from use of the mirrors off-axis [6]) was alleviated by minimising the schlieren angle, using large f/number mirrors, and positioning the schlieren cut-off perpendicular to the focal plane, i.e. use of a vertical cut-off in the horizontal/sagittal focal plane or use of a horizontal cut-off in the vertical/tangential focal plane [6]. Secondly, chromatic aberration in the system arising from the focussing lens was mitigated by using a compound achromatic lens [6]. After following the appropriate measures and procedures to curtail all optical aberrations, maintaining proper alignment and placement of all optical components, and focussing the image of the test section onto the camera sensor, the schlieren system can be considered properly assembled.
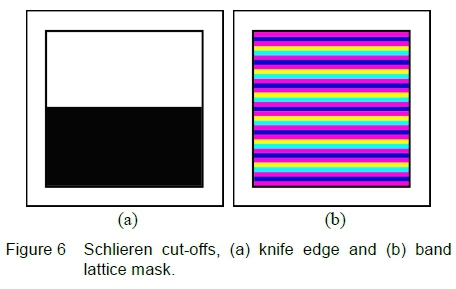
In addition to the schlieren setup considerations, the influence of the schlieren cut-off on the visualization of an expansion fan/shock wave interaction must be kept in mind. Two cut-offs, both oriented horizontally, were found to visualize different physical aspects of the flow field - the knife edge (shown in figure 6a) clearly imaged the curvature of the shock upon interacting with the expansion fan while the band lattice mask (shown in figure 6b) clearly resolved the expansion fan as a series of coloured fringes and allowed detection of the expansion fan deflection following interaction with the shock [7]. Use of these two cut-offs in conjunction allow for a comprehensive examination of the flow field resulting from an expansion fan/shock wave interaction.
4 Results Interpretation Considerations
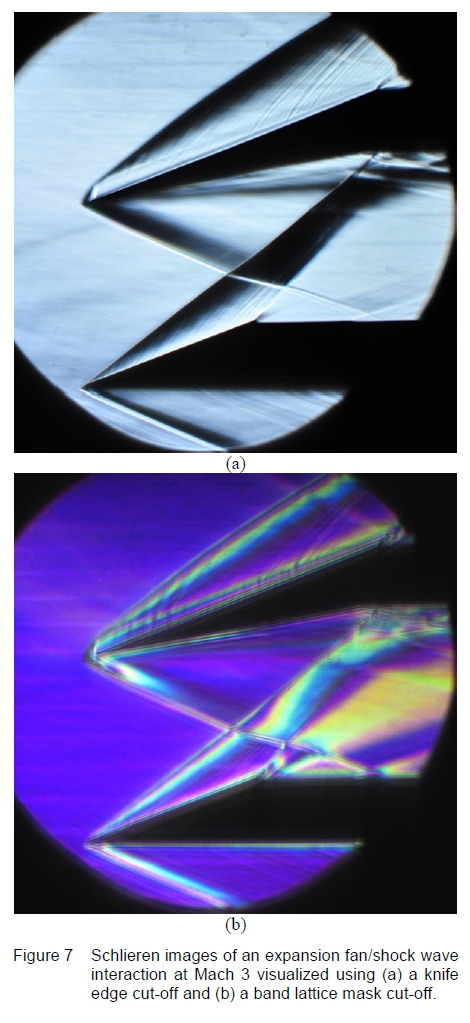
Schlieren images of an expansion fan/shock wave interaction at Mach 3 as visualized using a knife edge and a band lattice mask, both captured using a shutter speed of 1/1250s at ISO 500, are shown in figure 7. The shutter speed was selected to give a representative time-averaged result and therefore any minor flow fluctuations arising from tunnel noise, slight model vibration, or flow unsteadiness are blurred out in the schlieren images. It can be observed that the image resulting from use of the knife edge as the cut-off is clearer and sharper than that produced using the band lattice mask. This arises from two causes: firstly, light diffraction at the schlieren cut-off - in the case of the knife edge the light diffracts around the blade, i.e. there is one instance of diffraction in the cut-off plane, but in the case of the band lattice mask the interface of each colour band acts as an edge around which the light diffracts and thus there are many instances of diffraction in the cutoff plane (the diffraction of light in the cut-off plane due to the thin unobstructed portion of the source image behaving as a narrow slit and the consequent reduction in image resolution has been explained physically by Settles [6], and it was noted by Merzkirch [8] that the decreased resolution due to diffraction is exacerbated with an increase in light coherence); secondly, the difference in resolution of the schlieren cut-off - the knife edge provides a well-defined edge at the cut-off whereas the colour mask (which was developed photographically) will have small variations at each interface of the colour bands. The combination of these two factors has the consequence of reduced image clarity of the coloured schlieren image. However, despite the reduced clarity, the flow features of interest - the shock waves, expansion fan and the interaction - are still clearly visualized.
In the interpretation of the schlieren images of the expansion fan/shock wave interaction, two factors must be considered - firstly, the visualization of the shock waves and secondly, the presence of an additional shock wave emanating from the lower surface of the expansion generator upstream of the expansion fan.
4.1 Visualization of Shock Waves
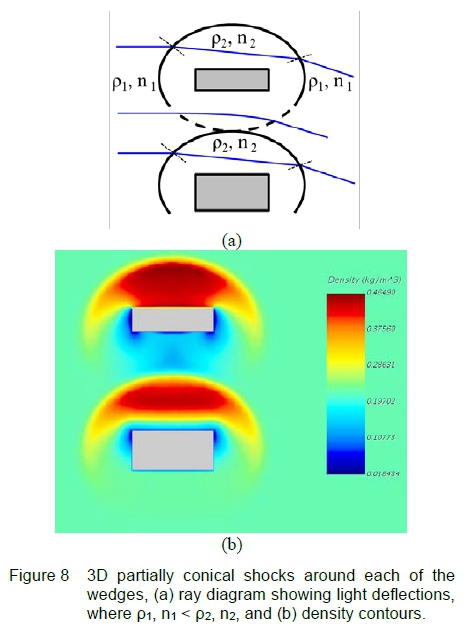
The shock waves present in the flow field (both the shock wave deflecting flow around the upper surface of the shock generator and the shock deflecting flow around the upper surface of the expansion generator) are visualized as either a black region in the case of the knife edge or a series of coloured fringes in the case of the band lattice mask rather than a single line. This arises from the way the schlieren system images the three-dimensional shock waves. The resultant schlieren image is an integration of all the light deflections along the optical path of the schlieren system [4] and therefore any light deflections caused by three-dimensional flow phenomena present in the flow field are included. In the present flow field, the shock waves diffract around the wedge edges forming a partially conical shock which will deflect light rays traversing this path. The deflection of light rays by the partially conical shock is best described by a ray diagram where the partially conical shock is considered as a region of constant density higher than the freestream density (i.e. the density gradients occurring at the wedge edges resulting from the shock diffraction are ignored in the ray diagram as they will cause the light ray to curve, increasing the complexity of the explanatory schematic with no benefit to understanding) - figure 8a shows such a ray diagram, with a front view of the wedges and depicting the vertical light deflections caused by the partially conical shock. The light deflections caused by the expansion fan are also indicated on the ray diagram, where the light is deflected in the direction of increasing density [4]. Figure 8b shows a front view density contour plot on a slice 38mm from the wedge leading edges from a numerical simulation of the expansion fan/shock wave interaction to show the partially conical shock and indicate the region of high density downstream of the shock. The black region/series of coloured fringes of the partially conical shock can be observed to thicken with increasing distance downstream of the wedge leading edge. This is due to the fact that at the wedge leading edge the shock is imaged as more of a two-dimensional shock because little shock diffraction has taken place, whereas further downstream the shock has diffracted further around the wedge edge and therefore causes a greater deflection of the light beam with the consequence that the shock is imaged as a thicker region by the schlieren system. It should be noted that a signal travelling at the local sound speed propagates from the wedge tips, forming a Mach cone not resolved in the schlieren images (due to being a weak feature and the complexity of the surrounding flow), and the low aspect ratio of the wedges exacerbates the influence of these Mach cones on the flow field. For more detailed treatment on the edge effects see Skews [9].
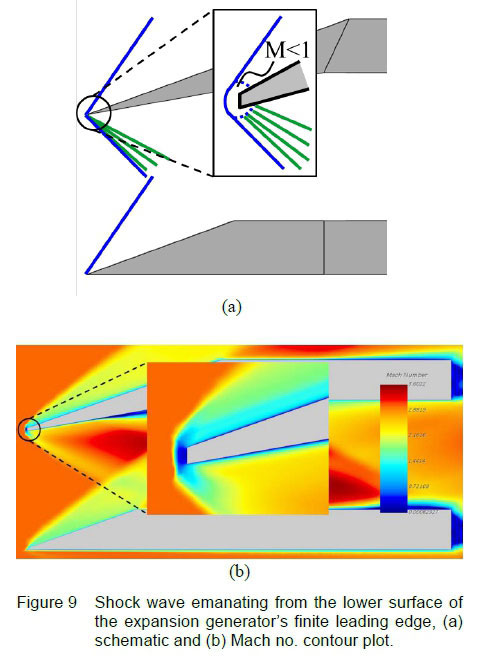
4.2 Shock Wave Emanating from Lower Surface of Expansion Generator
Emanating from the lower surface of the expansion generator is an additional shock wave, which influences the expansion fan/shock wave interaction. This shock wave develops because of the fact that the wedge leading edges, though sharpened, are still seen to have a finite edge by the flow. The finite leading edge causes a slightly detached shock to allow the fluid to flow around this edge, and this detached shock is propagated into the flow field below the expansion generator. Figure 9 shows a schematic with a magnified view of the expansion generator leading edge to explain this phenomenon, accompanied by a Mach number contour plot of the wedge symmetry plane from a numerical simulation where the wedges were modelled with finite leading edges to substantiate the explanation.
Taking into consideration the three-dimensional partially conical shock being imaged as a region rather than a line, and understanding that the finite leading edges of the wedges cause an additional shock to develop, propagate into, and influence the flow field below the expansion generator allows for an appropriate interpretation of the flow physics involved in an expansion fan/shock wave interaction - see Nel and Skews [10].
5 Conclusions
In the research into expansion fan/shock wave interactions, wind tunnel testing is an essential tool allowing controlled freestream conditions and variation of parameters of interest. However, certain considerations must be accounted for in the wind tunnel model design, data collection, and interpretation of the results in order to ensure good quality results and accurate interpretation thereof. Design of an original model for this study involved sizing of the model such that the tunnel is able to start, design of an attachment mechanism to allow mounting into the tunnel, prediction of the aerodynamic loads encountered by the model both on tunnel startup and during operation, and ensuring that the material strength of the model and support structure was sufficient to prevent failure. Schlieren flow visualization is the appropriate tool for the study of compressible flows, and careful attention was paid during setup to reduce the schlieren angle and place the cut-off at the correct location to minimise the optical aberrations of coma and astigmatism. When studying the schlieren results, visualization of the three-dimensional shock waves as regions, rather than lines, and the shock wave emanating from the lower surface of the expansion generator were taken into account for accurate interpretation. Adhering to these considerations allowed the physics involved in an expansion fan/shock wave interaction to be investigated.
References
[1] J. D. Anderson. Fundamentals of Aerodynamics, McGraw-Hill, New York, 3rd edition, 2001.
[2] R. J. Volluz. Handbook of Supersonic Aerodynamics, Section 20, Wind Tunnel Instrumentation and Operation (No. NAVORD-1488-VOL-6). Bureau of Naval Weapons, Washington DC, 1961.
[3] J. D. Anderson. Modern Compressible Flow: With Historical Perspective, McGraw-Hill, New York, 3rd edition, 2002.
[4] H. Kleine. Flow Visualization. In G. Ben-Dor, O. Igra, and T. Elperin, editors, Handbook of Shock Waves, volume 1, pages 683-740, Academic Press, San Diego, 2000.
[5] W. Merzkirch. Flow Visualization. Academic Press, San Diego, 2nd edition, 2012.
[6] G. Settles. Schlieren and Shadowgraph Techniques: Visualizing Phenomena in Transparent Media. Springer, Berlin, 2001.
[7] L. Nel, B. W. Skews, and K. Naidoo K. Schlieren techniques for the visualization of an expansion fan/shock wave interaction. Journal of Visualization, 18(3):469-479, 2015. [ Links ]
[8] W. Merzkirch. Techniques of Flow Visualization. No. AGARD-AG-302, Advisory Group for Aerospace Research and Development, Neuilly sur Seine, France, 1987.
[9] B. W. Skews. Three-dimensional effects in wind tunnel studies of shock wave reflection. Journal of Fluid Mechanics, 407:85-104, 2000. [ Links ]
[10] L. Nel and B. W. Skews. Investigation of an expansion fan/shock wave interaction between low aspect ratio wedges. In Ben-Dor G, Sadot O, and Igra O, editors, Proceedings: 30th International Symposium on Shock Waves, pages 1.581-1.586, Tel Aviv, Israel, 9-14 July 2017.
Received 28 November 2017
Revised form 22 May 2018
Accepted 22 September 2018

