


Services on Demand
Article
 English (pdf)
 Article in xml format
 Article references
Indicators

Related links
-
 Cited by Google
 -
 Similars in Google
Share

 Permalink
R&D Journal
On-line version ISSN 2309-8988
Print version ISSN 0257-9669
R&D j. (Matieland, Online) vol.33 Stellenbosch, Cape Town 2017
Upgrading the BMT120 KS micro gas turbine
F OppongI; SJ van der SpuyII; TW von BackströmIII
IDepartment of Mechanical and Mechatronic Engineering, University of Stellenbosch, South Africa. E-mail: oppong_francis@outlook.com
IIDepartment of Mechanical and Mechatronic Engineering, University of Stellenbosch, South Africa. E-mail: sjvdspuy@sun.ac.za
IIIDepartment of Mechanical and Mechatronic Engineering, University of Stellenbosch, South Africa. E-mail: twvb@sun.ac.za
ABSTRACT
This study evaluates the performance of the BMT 120 KS micro gas turbine engine. The analysis involves matching the existing engine components as well as redesigned elements using engine characteristic maps. An experimental investigation was conducted to measure the baseline performance parameters of the engine. Analytical calculations were used to review the thermodynamic cycle of the engine. A numerical component sensitivity analysis was also used to evaluate the engine's output. The performance predictions of the engine and its modifications showed good correlation with test results and available engine data.
Additional keywords: Micro gas turbine, Performance, Component matching, Flownex
Nomenclature
APU Auxiliary Power Unit
BMT Baird Micro Turbine
CFD Computational Fluid Dynamics
Fnet Net thrust [N]
EGT Exhaust Gas Temperature [K]
HV Heating Value of Fuel [MJ/kg]
MGT Micro Gas Turbine
TSFC Thrust Specific Fuel Consumption [g/Ns]
TIT Turbine Inlet Temperature [K]
R Gas Constant [J/kgK]
UAV Unmanned aerial vehicle
Greek
β Diameter ratio [-]
Δ Variation/ difference [-]
η Efficiency [%]
γ Heat ratio [-]
π Pressure ratio[-]
ρ Density [kg/m3]
Subscripts
a Air
c Compressor
cc Combustion chamber
d Discharge
f Fuel
m Mechanical
0 Total/stagnation
g Gas
1 Introduction
The deployment of micro gas turbine (MGT) engines in unmanned aerial vehicles (UAVs), hybrid electric vehicles, and small power plant applications is becoming popular due to their high power to weight ratio [1-3]. They are also used as auxiliary power units (APU) for modern aircraft [4,5]. Their multi-fuel capability and simplicity in design also makes them well suited for these applications [6-10]. An example of such an engine is the Baird Micro Turbine 120 Kerosene Start (BMT 120 KS) engine. These engines are non-linear in their performance [11,12]. Therefore, the engine overall performance output depends on the performance of the individual engine elements. Considerable research has been performed to improve the performance of the components of the BMT engine. Van der Merwe [13] redesigned and optimised the centrifugal compressor impeller of the BMT engine. He sought to achieve a total-to-total pressure ratio of 4.72 and an isentropic compressor efficiency of 79.8% at a mass flow rate of 0.325 kg/s. The new impeller performance was validated by comparing the mean-line, experimental and computational fluid dynamics (CFD) results for the compressor stage. He concluded that the experimental and numerical results showed good agreement. Krige [14] redesigned the BMT engine vaned diffuser. He aimed to maximise the compressor stage pressure recovery in order to increase the engine's total-to-static pressure ratio, mass flow and thrust output. The experimental and numerical investigation showed that the diffuser pressure recovery increased from 0.48 to 0.73 whereas the static-to-static pressure ratio across the diffuser increased from 1.39 to 1.44.
In 2014, De Villiers [15] employed a 1D (1-dimensional) mean-line code and CFD software codes FINETM/Turbo and FINETM/Design3D to design a centrifugal compressor stage for the BMT engine. He estimated that the new compressor stage would yield a total-to-static pressure ratio of 3.0, totalto-total efficiency of 76.5% and a thrust output of 170 N at a rotational speed of 119 000 rpm for the BMT engine. Basson [16] examined new turbine stages for the BMT 120 KS micro jet engine using ANSYS Fluent. He performed analytical and numerical evaluations for the new designs. Basson [16] calculated that the proposed designs predicted an efficiency improvement of 5%. Smit [17] manufactured Basson's turbines, and obtained experimental results for the newly designed turbines. The experimental investigations showed that the turbine stage inlet and outlet are dominated by highly fluctuating temperature profiles. The author suggested that extra instrumentation should be incorporated to measure the turbine inlet and outlet temperatures.
Experimental measurements of the BMT engine thermodynamic operating parameters have been conducted by Becker [18]. The purpose of the study was to determine the behaviour of the engine turbine stage inlet and exhaust temperatures. Recently, Burger [20] designed and optimised a crossover diffuser for the BMT engine. The diffuser combined with Van der Merwe's [13] impeller potentially improved the compressor stage of the engine total-to-static pressure ratio from 2.62 to 3.65. An extrapolated thrust output of 200 N was predicted for the new diffuser at an engine rotational speed of 120 000 rpm.
In spite of improved component performance, the effectiveness of the modified BMT engine has been limited due to high fuel consumption, high exhaust temperature, and the engine's inability to operate at high rotational speed. The possible reason for these issues might be due to mismatching of the engine components. In this paper, component matching, which incorporates compressor and turbine characteristic maps to assess engine performance, is used to investigate the BMT engine's performance. In this regard, analytical and numerical analyses are performed to review the BMT thermodynamic cycle as a basis for improved component matching. The paper focusses on the performance investigation of the standard BMT engine and the modifications (re-designed components) made by Basson [16] and Burger [20].
2 The BMT 120 KS Engine
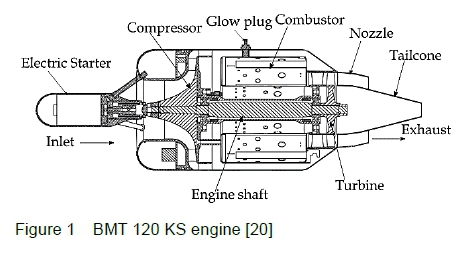
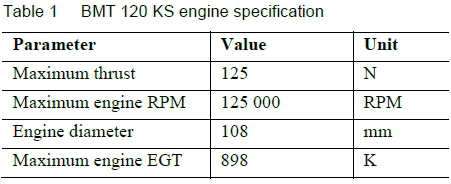
The BMT engine shown in Figure 1 is a single spool engine. The engine consists of a centrifugal compressor stage (radial impeller and wedge diffuser) a flow-through annular combustor equipped with vaporizer tubes, an axial flow turbine, and a fixed convergent nozzle. The centrifugal compressor increases the pressure and temperature of the air induced into it. The compressed air then mixes with fuel in the combustion chamber where it is ignited to further raise the working fluid temperature. The turbine expands the hot gas from the combustion process. The convergent nozzle accelerates the exhaust gases to increase the kinetic energy to produce thrust for propulsion. Table 1 displays the BMT 120 KS engine specifications.
3 Experimental Tests
An experimental test was performed for the BMT engine to evaluate the engine baseline performance values such as the thrust, fuel consumption, pressures, and mass flow rate and turbine inlet and outlet temperatures. The performance parameters were used to validate the engine simulation model. The experimental test was conducted from the engine idling speed of 35 000 rpm up to a maximum engine speed of 120 000 rpm. The test was repeated for two engine cycle runs and the data recorded using the HBM Catman® software and a personal computer. The results obtained for the two test runs are averaged to determine the final values of the measured engine parameters. The experimental test facility setup is displayed in Figure 2.

The BMT pressures, temperatures, thrust and fuel consumption were measured using the following transducers and thermocouples.
• K-type thermocouples were used to measure the engine exhaust temperatures. The thermocouples have an accuracy of ±2.2 °C.
• A P8AP pressure sensor was used for determining the pressures at the engine inlet. The pressure transducer has an accuracy of ±0.3%.
• The engine thrust was measured using a 500 N HBM® RSCC load cell, which is accurate to ±0.2% and was calibrated using a spring loaded weight scale. The accuracy of the scale is estimated to be within 2%.
• The engine fuel consumption was recorded using an HBM® U2A 50 kg/s load cell with an accuracy of ± 0.2%. It was calibrated by suspending various predefined weights from it and increasing the weights in 1 kg intervals.
Based on the above information, combined with the average values and standard deviation from experimental data at 120 000 rpm, the uncertainty of the thrust measurement is estimated to be 2%, the air mass flow measurement to be 0.32% and the fuel consumption to be 0.25%.
3.1 Air mass flow rate measurement
The mass flow rate of air into the engine was determined by measuring the difference between the local static and the ambient pressure of the air at the engine bell-mouth shown in Figure 3. The bell-mouth reduces mass flow rate measurement errors and mitigates the effect of any external flow factors that may occur upstream of the engine inlet. In addition, it provides stable and laminar airflow distribution at the engine inlet.

The velocity of the flow into the engine is given as [22] :
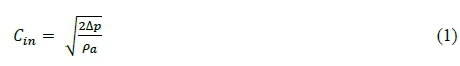
With the velocity of the flow known the mass flow rate of air is determined using the given equation:
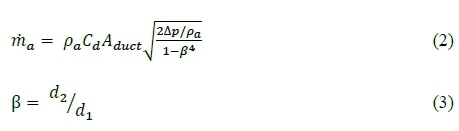
The Mach number of the flow at the bell-mouth inlet was found to be 0.12, 0.1, and 0.08 respectively for the various speeds. Therefore, the discharge coefficient was calculated using the equation for a bell-mouth or nozzle with incompressible flow. The discharge coefficient, Reynolds number, and diameter ratio are given as [22]:

The Reynolds number was estimated using the bell-mouth inner diameter, the velocity of the air at the bell-mouth inlet and the kinematic viscosity of the air.

where,
Δ𝑝 is the pressure difference at the bell-mouth.
pa is the air density.
Aduct is the bell-mouth area
d1and d2 are the inner and outer diameters of the bell-mouth (the outer diameter being of an infinite value).
vais the kinematic viscosity of air.
4 Theoretical Analysis
An analytical calculation was used to determine engine operational values such as the turbine inlet (TIT), exhaust temperature (EGT) and engine thrust. Table 2 depicts the engine parameters used for the calculations. Some of the parameters were assumed whereas others were acquired from the available BMT data measured by Krige [14], and literature. The BMT components were treated as separate control volumes. Using the standard open air Brayton cycle, the thermodynamic values at the interface between the engine components were evaluated. Figure 4 depicts the ideal T-s diagram of the Brayton open air cycle for a gas turbine engine. Station 0-3 shows the compressor stage of the engine while station 3-4 shows the combustion stage. Expansion of the working fluid occurs at station 4-5 in the turbine. Station 5-8 depicts the nozzle stage of the engine. The air is expelled into the atmosphere from point 8-0.


The engine was treated as a stationary test rig engine at standard sea level. Therefore, the free stream air velocity and Mach number are considered to be negligible (u0= 0 and M0= 0). Also, assuming no losses at the engine inlet, the compressor inlet stagnation pressure and temperature conditions are considered equal to the ambient conditions. An iterative computation was used to determine the engine performance variables. The cycle calculation equations are presented below.
4.1 Compressor stage parameters
The stagnation pressure and temperature at the compressor inlet are used to determine an estimated value for the inlet velocity of air into the engine. Using an iterative method the actual, static density, static temperature, static pressure as well as the velocity is then calculated. The compressor inlet velocity is given by:
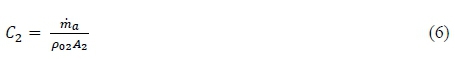
With a known compressor inlet velocity the static temperature, pressure and density are calculated using:
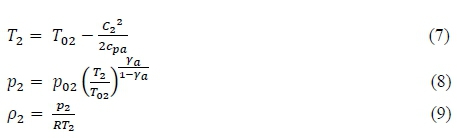
The compressor discharge stagnation pressure and temperature are computed using the equation.

where,
T02 is the compressor inlet total temperature.
p02 is the compressor inlet total pressure.
𝐴2 is the compressor inlet annulus area.
𝜋𝑐 is the compressor stage total-to-total pressure ratio
γ α is air the specific heat ratio.
4.2 Combustion chamber parameters
The maximum engine temperature is determine at the combustor outlet or turbine inlet. Using the heating value of the engine fuel, combustor efficiency, the fuel-air ratio, and the compressor outlet temperature the highest cycle temperature is determined using energy conservation. The turbine inlet temperature is given as [24] :
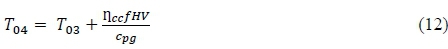
With a known combustor pressure loss and using T03 the total pressure after combustion is computed as:
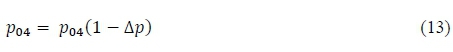
where,
Ƞcc is the combustion efficiency
𝑓 is the fuel-air ratio
𝐻V is the fuel heating value
cpg is the gas specific heat
Δp is the combustion pressure drop
4.3 Turbine stage and nozzle parameters
The turbine discharge stagnation temperature and pressure are estimated using the relation [25] :


Isentropic conditions are assumed at the inlet and exit of the engine converging propelling nozzle. Also, it was assumed that the engine exhaust is subsonic, therefore the engine exhaust gases expand to atmospheric pressure. The exhaust velocity and static temperature are given by:

where,
rm is the mechanical efficiency.
ya is the gas specific heat ratio.
4.4 Engine performance parameters
The engine thrust and the specific fuel consumed are determined from the equations [26] :
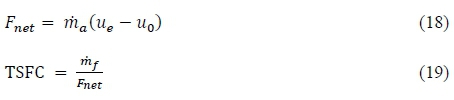
where,
Ƞ𝑚𝑚 is the fuel consumption.
Yg is the free stream velocity of air.
5 Numerical Analysis
The engine performance modelling and simulation were performed with Flownex SE. Flownex SE is used for thermodynamic and computational fluid dynamic analysis of turbomachinery and other industrial problems [27]. The program is well suited for simulating both industrial and aircraft gas turbine engines. It can accommodate gas turbine engines such as single and twin spool turbofan and turbojet engines as well as turboshaft engines. Flownex SE can be used for the design and off-design performance analysis of gas turbines. The program has built in gas turbine characteristic maps and it is easy to import specific engine components map for simulation. The program also has a design functionality and turbo power matching tool that enables easy assessment of engine operation at off-design points
Figure 5 illustrates the BMT engine arrangement in the Flownex simulation environment. The engine network model comprises of an inlet properties gauge, centrifugal compressor, a fuel source, combustion chamber, axial flow turbine, propelling thrust nozzle and outlet gauge connected with boundary nodes. The boundary nodes ensure smooth communication between the network components. The adiabatic flame combustion model is used in the Flownex simulation to compute the engine cycle peak temperature.

5.1 Engine simulation
The engine simulation phase constitutes the baseline engine modelling and simulation, as well as the simulation of standard engine turbine and compressor stages with the modified compressor and turbine stages designed by Burger and Basson. The initial engine simulation was performed for the baseline engine followed by the simulation for the redesigned components. The engine compressor and turbine characteristic maps published by Krige [14] and Basson [16] for the standard BMT engine were introduced into Flownex SE for the baseline simulation. Figure 6 and 7 show the compressor performance maps for the standard BMT engine developed by Krige. Figure 8 and 9 present the turbine performance maps generated by Basson for the standard BMT engine. The corrected mass flow referred to in these figures is of the form:

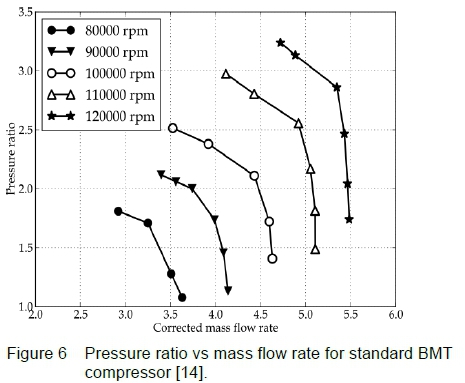
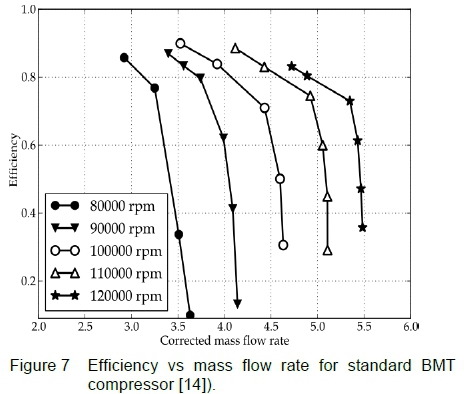
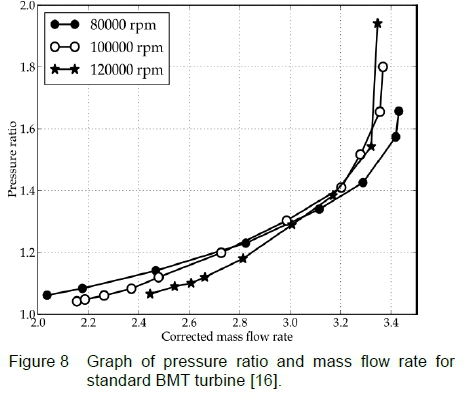

Similarly, the modified engine performance modelling and simulation was performed using the compressor characteristic maps published by Burger and the re-designed turbine maps of Basson.
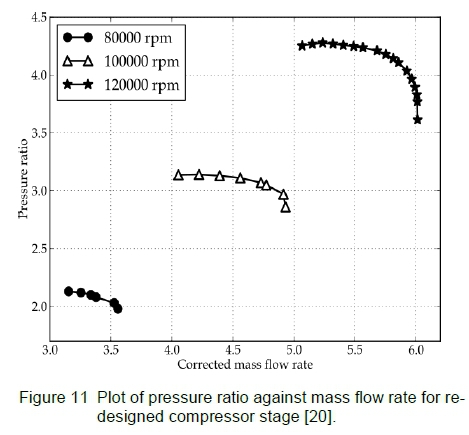
Figure 10 illustrates the compressor stage designed by Burger with the crossover diffuser.

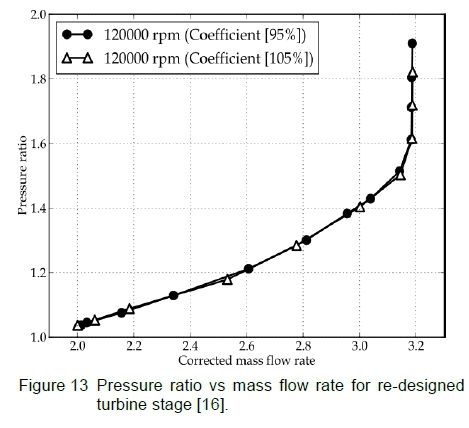
Figure 11 and 12 show the characteristic curves developed by Burger for a re-designed BMT compressor stage. Basson redesigned two additional turbines to replace the existing turbine stage of the BMT engine. Figure 13 and 14 display the turbine stage performance maps developed by Basson. The maps were generated at a rotational speed of 120 000 rpm. The turbines were designed with stage load coefficients of 95% and 105%. The turbines are labelled as turbine 1 and 2 respectively in accordance with the load coefficients. The turbines were simulated with the various compressor stages of the BMT engine in Flownex. The engine inlet conditions for the respective engine simulations were set to the individual ambient conditions measured by the authors.


6 Results and discussion
In order to compare the various experiments that were performed, the following keys are proposed:
• Configuration 1 - the standard BMT engine
• Configuration 2 - the standard BMT compressor with Basson's turbine 1
• Configuration 3 - the standard BMT compressor with Basson's turbine 2
• Configuration 4 - Burger's compressor stage with the standard BMT turbine
• Configuration 5 - Burger's compressor stage with Basson's turbine 1
• Configuration 6 - Burger's compressor stage with Basson's turbine 2
Table 3 summarizes the experimental and the analytical results of the standard BMT engine (configuration 1) at a maximum speed of 120 000 rpm. With reference to the table, the analytical baseline engine performance values were underestimated compared to the experimental test results. Percentage differences of between 1.0% and 17.0% were obtained when comparing the experiment and the theoretical results.

The configuration 1 experimental and Flownex simulation results are presented in Figure 15 to 18.


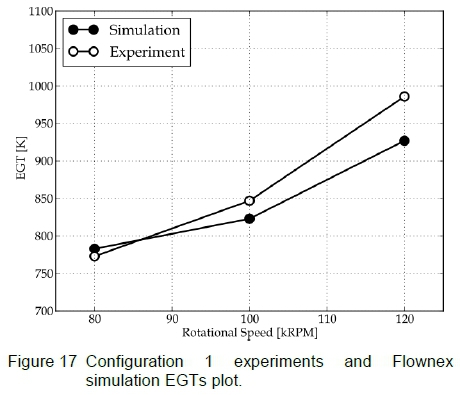

Figure 15 shows the engine thrust plot as a function of the rotational speed. A percentage difference in the range of 0.5-6% was obtained when comparing the simulated and experimental thrust values.
Figure 16 compares the simulation and experimental mass flow rates. The difference in the experimental mass flow rates at a speed of 80 000 and 100 000 rpm is minimal compared to that of the speed of 120 000 rpm. A percentage deviation of between 0.04% and 1.9% was observed when comparing the simulation and experimental mass flow rates. Figure 17 compares the configuration 1 experimental and simulated EGTs. The simulation results were under estimated at higher speeds compared to the experimental values. The experimental EGTs are 1.4-6% higher than the simulation EGTs. This is attributed to the uneven radial and circumferential distribution of the exhaust gases at the engine exhaust. This effect has been confirmed by other researchers using the same engine [17,18].
Figures 18 and 19 show a comparison of the simulated and the experimental thrust values for the configuration 2 and 3 engines. The experimental test data was measured by Smit [17].
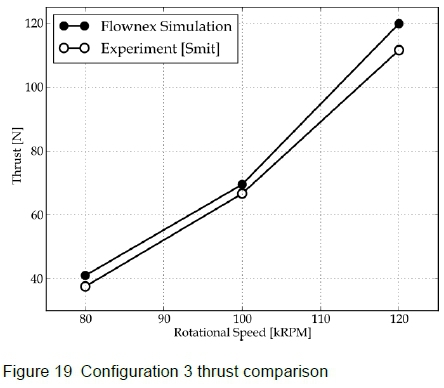
Figure 18 shows a comparison of the configuration 2 engine's simulated and experimental thrust values. A percentage difference of between 1.2% and 11% was obtained when the simulation and experimental test thrusts are compared. Table 4 collates configuration 2's experimental test data and numerical EGTs. The simulations predicted lower EGTs with temperature deviations between 112 K and 153 K observed compared to the experimental EGTs. As mentioned in previous paragraphs, the higher deviation in the EGTs could be caused by an uneven circumferential temperature profile at the turbine exhaust.
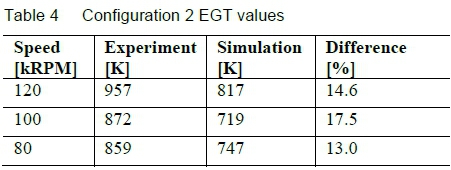
Figure 19 shows the correlation between configuration 3's thrust values. The simulation predicted thrust values of between 4.3% and 9.2% higher than the experiment. Table 5 also displays the correlation of the EGT values for the experiment and the simulation. The simulated EGTs were under predicted compared to the experimental EGTs. A temperature deviation of 110-220 K was obtained. The large difference can once again be attributed to the presence of cold and hot areas in the engine exhaust. Figure 20 depicts the comparison of simulation and experimental results for the configuration 4 engine. Comparing the simulated thrust to the experimental thrust a percentage deviation in the range of 812% is shown.

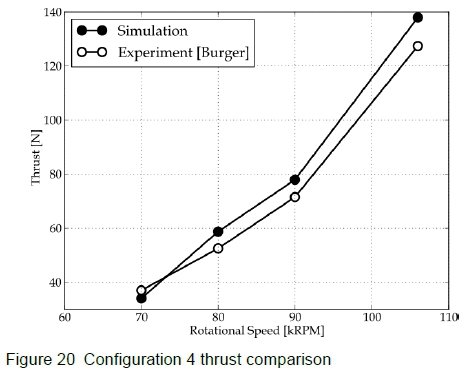
Figure 21 and 22 compare the performance of the configuration 4, 5 and 6 engines. Figure 21 gives a plot of the engine thrust against rotational speed. The simulation that made use of configuration 4 predicted a higher thrust value compared to the configuration 5 and 6 simulations. The configuration 4 and 5 simulation thrust values showed differences between 0.1% and 5% when compared. Configuration 6's thrust values differed by 3 to 5% when compared to the configuration 4 thrust values.
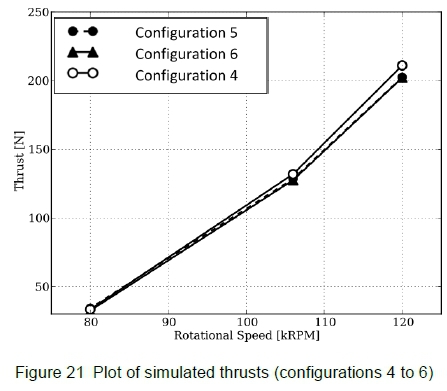

Figure 22 shows the engine's EGT graphed against the rotational speed. As shown in the figure, configuration 5 and 6's simulations predicted lower EGT values compared to the configuration 4 EGT values.
The engine performance simulation using Burger's compressor stage and the various turbines revealed that at higher speeds, the engine requires high fuel consumption to produce sufficient turbine power to drive the compressor. Increasing the fuel consumption to produce sufficient turbine power results in high turbine inlet and exhaust temperatures. Burger also encountered these difficulties during the experimental testing of the engine at the same rotational speeds. This limited the operation of the engine at higher speeds during the experiment, regardless of turbine configuration.
7 Conclusion
A detailed performance evaluation of a small gas turbine engine was assessed in this study. Analytical calculations and experimental investigations were performed to examine the thermodynamic baseline performance parameters of the engine. The experimental analysis disclosed that the engine exhaust depicts a fluctuating circumferential temperature profile.
Using Flownex SE a component matching and sensitivity analysis were undertaken to predict the performance of the engine at different operating conditions. The numerical results established from Flownex correlates well with the experimental results for the baseline engine. The Flownex simulations showed that an engine incorporating the redesigned compressor stage, combined with different turbine configurations, may have thrust values in the order of 200 N, compared to the original thrust value of 137 N. However, the analysis also showed that the engine suffers from high exhaust gas temperatures at high rotational speeds when using these compressor and turbine configurations. This is due to insufficient turbine work available to drive the compressor of the engine. Increasing the fuel flow rate in order to increase the turbine power resulted in excessive turbine inlet and exhaust temperatures.
It was found that Flownex can be used to investigate the effects of the modified compressor and the turbine stages on the performance of the engine. The results from the above investigations will be used to further study the successful integration of the modified components into the existing engine. This will involve further aerodynamic investigation into the turbine stage design and its performance analysis.
The experimental testing observed fuel leakage in the engine combustion chamber and flames at the periphery of the engine exhaust. Additionally, the turbine inlet and outlet temperature measurements showed different temperature readings which might due to the presence of cold or hot spots.
The presence of hot or cold spots in the combustor inlet and exhaust gases could be due to the un-equal mixing of air and fuel in the combustor.
Finally, the exhaust gas temperature value is a key control parameter used to evaluate engine operation. Therefore, the exhaust temperature measurements should be examined further using thermocouples with different sheaths and radiation shields.
8 References
1. A Marcellan, An Exploration into the Potential of Microturbine based Propulsion Systems for Civil Unmanned Aerial Vehicles, Master's Thesis, Delft University of Technology, 2015. [ Links ]
2. TWSimon and N Jiang, Micro- or Small- Gas Turbines, Proceedings of the International Gas Turbine Congress, 2003, 1-15.
3. E Benini and S Giacometti, Design, Manufacturing and Operation of a Small Turbojet-engine for Research Purposes, Applied Energy, 2007, 84(11), 1102-1116. [ Links ]
4. D Verstraete, P Hendrick, V Djanali, C Gonzalez, J Ling, KC Wong and S Armfield, Micro Propulsion Activities at the University of Sydney, PowerMEMS 2010 Conference, Australia, 2010, 1-4.
5. T Witkowski, S White, CO Duenas, P Strykowski and T Simon, Characterizing the Performance of the SR-30 Turbojet Engine, Proceedings of the 2003 American Society for Engineering Education Annual Conference & Exposition, 2003, 1-21.
6. M Badami, P Nuccio and A Signoretto, Experimental and Numerical Analysis of a Small-scale Turbojet Engine, Energy Conversion and Management, 2013, 76, 225-233. [ Links ]
7. Z Leylek, WS Anderson, G Rowlinson and N Smith, An Investigation into Performance Modeling of a Small Gas Turbine Engine, ASME Turbo Expo 2013: Turbine Technical Conference and Exposition, 2013, Volume 5A, V05AT23A007, GT2013-94405, 11p.
8. M Gieras and T Stankowski, Computational Study of an Aerodynamic Flow through a Micro-turbine Engine Combustor, Journal of Power Technologies, 2012, 92(2), 68-79. [ Links ]
9. M Chmielewski and M Gieras, Small Gas Turbine GTM- 120 Bench Testing with Emission Measurements, Journal of KONES Powertrain Transport, 2015, 22(1), 47-54, 2015. [ Links ]
10. J Ling, KC Wong and S Armfield, Numerical Investigation of a Small Gas Turbine Compressor, 16th Australasian Fluid Mechanics Conference, Gold Coast, Australia, 2007, 961-966.
11. R Decuypere and D Verstraete, Micro Turbines from the Standpoint of Potential Users, RTO-AVT VKI Lecture Series on Micro Gas Turbines, Neuilly-sur-Seine, France, Educational Notes RTO-EN-AVT-131, 2005, 1-14.
12. CH Yang, CC Lee and CH Chen, System Identification and Performance Improvement to a Micro Gas Turbine Applying Biogas, World Academy of Science, Engineering and Technology, 2009, 254-258. [ Links ]
13. BB van der Merwe, Design of a Centrifugal Compressor Impeller for Micro Gas Turbine Application, Master's Thesis, University of Stellenbosch, 2012. [ Links ]
14. DS Krige, Performance Evaluation of a Micro Gas Turbine Centrifugal Compressor Diffuser, Masters Thesis, University of Stellenbosch, 2013. [ Links ]
15. LCB de Villiers, Design of a Centrifugal Compressor for Application in Micro Gas Turbines, Master's Thesis, University of Stellenbosch, 2014. [ Links ]
16. GJT Basson, Design Methodology of an Axial - Flow Turbine for a Micro Jet Engine, Master's Thesis, University of Stellenbosch, 2014. [ Links ]
17. FV Smit, Investigating the Design of the Turbine Stage of a Specific Micro-gas Turbine Engine, Final year project, University of Stellenbosch, 2014.
18. PC Becker, Development of Velocity and Temperature Probes for a Micro Gas Turbine, Final year project, University of Stellenbosch, 2015.
19. C Burger, Design Procedure of a Compact Aerodynamic Crossover Diffuser for Micro Gas Turbine Application, Master's Thesis, University of Stellenbosch, 2015. [ Links ]
20. FM White, Fluid Mechanics, McGraw-Hill, 6th Edition, USA, 2008.
21. NA Cumpsty, Jet Propulsion: A Simple Guide to the Aerodynamic and Thermodynamic Design and Performance of Jet Engines, Cambridge University Press, 7th Edition, UK, 2009.
22. AF El-Sayed, Aircraft Propulsion and Gas Turbine Engines, CRC Press, USA, 2008.
23. H Cohens, GFC Rogers and HIH Saravanamuttoo, Gas Turbine Theory, Longman Group, 4th Edition, England, UK, 1996.
24. M-Tech, 2015. General User Manual. www.flownex.com.
Received 4 November 2016
Revised form 9 June 2017
Accepted 19 June 2017

