


Services on Demand
Article
 English (pdf)
 Article in xml format
 Article references
Indicators

Related links
-
 Cited by Google
 -
 Similars in Google
Share

 Permalink
R&D Journal
On-line version ISSN 2309-8988
Print version ISSN 0257-9669
R&D j. (Matieland, Online) vol.33 Stellenbosch, Cape Town 2017
A numerical evaluation of dunnage bag pressure drop subject to a single void reduction cycle
MP VenterI; G VenterII
ISAIMechE Member, Department of Mechanical and Mechatronic Engineering, Stellenbosch University, Stellenbosch, South Africa, mpventer@sun.ac.za
IISAIMechE Member, Department of Mechanical and Mechatronic Engineering, Stellenbosch University, Stellenbosch, South Africa, gventer@sun.ac.za
ABSTRACT
A method using a simple response model is used to replicate the results of an industry standard certification test for a dunnage bag. The method makes use of numerical optimization tools, standard commercial FEA software and a simple material response model to predict the pressure drop in a dunnage bag caused by material plastic deformation under a compressive cycled load. The results of the response model are evaluated to ensure that the overall response of the model matches that of the measured system. Calibration of the model is done by numerical optimization and the resulting model predicts the pressure drop over one cycle to within one standard deviation of the measured results.
Additional keywords: woven polypropylene fabric, finite element methods, dunnage bags, optimization, plastic deformation
1 Introduction
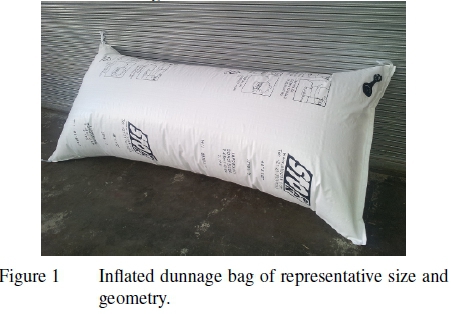
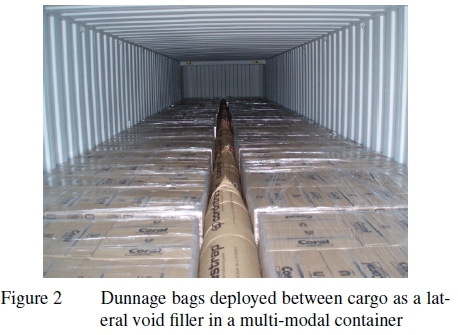
Dunnage, inits various forms, are products usedto protectand secure goods. Dunnage fills voids, protects from moisture, separates items and restrains the movement of goods. Goods transported in a multi-modal container are often protected by inflatable dunnage bags, typically pillow shaped inflatable tensile structures, such as those shown in Figures 1 and 2. The inflated bag is also capable of forcibly returning goods to their original position after an impact has dislodged them, as in the case of severe braking.
Current dunnage bag development is conducted by physical prototyping, requiring large minimum material orders (10 to 15 tons per material per order) for material changes and disruption to ongoing production. In addition to this there is a risk that a dunnage bag manufactured from a new material will not be suitable for the marketplace. The aim of the present research is to propose a method of providing a preliminary prediction of the internal pressure drop observed when a dunnage bag is subjected to an industry standard certification test. The method proposed is to make use of simple material tests, and standard commercial software. The research focuses on predicting only the response of the system as a whole. To achieve this aim the following research objectives were pursued:
• Define the test standard that will be applied
• Define the system characteristics that should be replicated
• Reproduce the standard test numerically
• Compare the results of the numerical model with the physical test
• Validate the numerical model of an extended void range The certification test recommended by industry is the
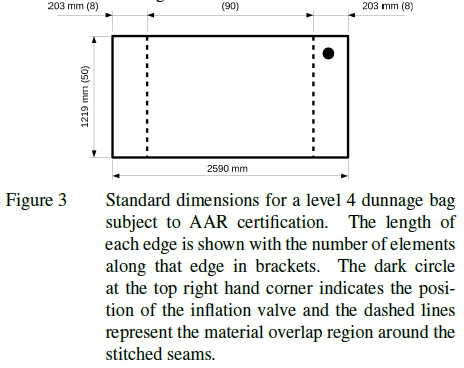
'Product Performance Profile for Pneumatic Dunnage' published by the Association of American Railroads (AAR).1 This is a simple pass/fail certification test for pneumatic dunnage for use on rail-roads in the USA. This test was replicated using a large hydraulic press available at Stellenbosch University. The dunnage bag selected for testing is a mid to high level bag (Level 4) with prescribed dimension, 2590 χ 1219 mm.
The AAR performance profile for pneumatic dunnage covers three areas of consideration: application, performance level and performance measures. The dunnage bag selected for testing is intended for use as a lengthwise void filler with a desired performance level 4, a typical high performance dunnage specification.
The performance of this dunnage bags is measured according to the results of three sequential tests: Part A: Leak Test, Part B: Cyclic Test and Part C: Burst Test. The standard for certification requires ten samples.
Part A-Leak Test: All ten samples are inflated into a 305 mm void to the required pressure of 70 kPa and held for 19 days. At the end of the 19 days no individual bag may have lost more than 7 kPa and the standard deviation for all ten samples cannot be more than 1 kPa.
Part B-Cyclic Test: Five samples from part A are then randomly selected for cyclic testing. The bag is inflated in a 305 mm void (between two parallel plates) to a pressure of 70 kPa. The bag is then loaded 10 times with load to 265 kN by reduction of the distance between the two parallel plates. The sample should not burst and the final pressure in the bag once returned to the 305 mm void should be within 10 % of the initial pressure.
Part C-Burst Test: At the completion of the dynamic test in part B, each of the five bags tested in Part B are then further inflated to burst while maintaining the 305 mm void. The bag should burst at a pressure greater than 207 kPa.
This paper will attempt to replicate only Part B of the AAR test, and only those parts of Parts A and B that are useful in light of Part-B. Some minor modifications were made to the test procedure due to practical limitations. The leak test is reduced to 24 hours and any leaking bags are excluded from further testing. The leak test is also preconditions the polypropylene by loading the material beyond the primary creep phase. The cyclic load testing is reduced to a single cycle, as the numerical model will not undergo further plastic deformation in subsequent load cycles.
2 Materials and Methods
In addition to the testing prescribed by the modified AAR test specification a preliminary series of tests must be conducted to bound the test envelope. The information required from the preliminary testing are: the in-situ strain in the warp (lengthwise) and weft (hoop) material directions, the strain rate of the testing, and the burst pressure of the dunnage bag.
Surface strain was measured using digital image correlation (DIC), the pressure in the bag was measured using a pressure transducer and the test was timed. The warp and weft direction strains were measured as 4.9 % and 1.3 % respectively. The maximum strain rates in the warp and weft material directions were recorded to be 0.25  and 0.066 respectively. All test bags surpassed the required minimum burst pressure of 207 kPa with an average burst pressure of 237 kPa. For the bags tested the dominant failure mode is a mid-side material failure.
The in-situ strain and strain rates were used to define the test envelope for the sample material tests using fabric swatches. These values are used as guidelines to set a range of reasonable values within which the numerical model will operate. For alternative applications suitable ranges should be determined. The burst pressure is used to ensure that the simulations run at least past the pressure at which the physical bags fail since the failure of the bag itself is not simulated.
3 Modelling
The modified AAR test is reproduced using a numerical model with a representative geometry, homogenized material properties for the plain woven polypropylene reinforcing cover, and
an inflation model which accounts for the volume of air within the bag. The bag bladder is excluded from the simulation as it is designed to be compliant and provides little additional strength to the bag. The effect of the seams and valve is not included in the scope as they do not participate in the mid-side failures described here.2
Explicit solvers such as LS-DYNA3 are the recommended finite element solvers for modelling the inflation of thin shell or membrane structures undergoing large displacements. This class of tension structure is prone to wrinkling. When wrinkling occurs the body undergoes an apparent rigid body movement that could cause an implicit analysis to terminate pre-maturely.4 A similar effect is observed when the number of wrinkles along the edge of the bag changes.5
It is assumed that dynamic effects do not contribute strongly to the physical problem. As such the simulation is assumed to be quasi-static. To ensure that this assumption is met the internal and kinetic energy components of the simulation should be compared and the kinetic energy component should be much lower than the internal energy component. In this case a maximum of 0.5 % was chosen.
3.1 Geometry and Meshing
Figure 3 shows the overall dimensions of the evaluation bag selected. Also seen in the figure are two 203 mm overlap regions where the woven polypropylene is folded back onto itself producing two double-thick sections, indicated by the dashed lines in the figure.
The mesh has an orthogonal two-layered construction forming a simple closed pillow shape. The central cavity defines a control volume used in the inflation of the simulated bag. The mesh density was selected based on a mesh refinement study that accounted for convergence of the restraining load, internal pressure, bag volume and maximum principal strain.
3.2 Bag Inflation
The hybrid airbag model available in LS-DYNA was selected for the numerical simulation. The inflation model requires that the rate at which mass is added into the control volume over time be defined as a curve. The inflation model makes use of simple gas properties and the Ideal Gas Law to calculate the pressure in the bag using the calculated volume and mass of the gas in the bag.
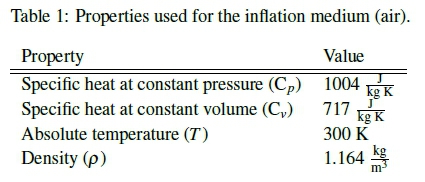
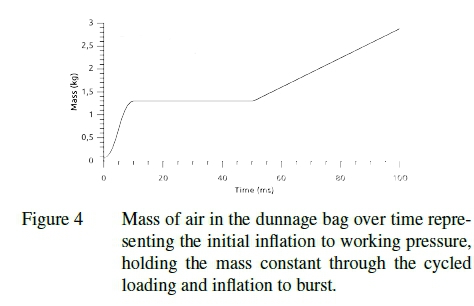
Table 1 shows the properties used for the inflation medium. Ambient pressure is taken to be 100 kPa. Figure 4 shows the mass of air in the bag over time. Three stages can be seen: an initial inflation phase where the mass increases, a constant mass phase, and a second inflation phase.
The hybrid airbag inflation model and a conventional pressure load were compared and found to produce the same results. However, the hybrid airbag model provides the advantage of directly accounting for the compressible nature of the inflation medium, simplifying the cycled loading of the numerical model.
In order for the numerical model to correctly calculate the pressure within the bag the simulation should account for the influence of the ambient gas conditions. To this end the temperature, pressure and gas properties of the external gas as well as the internal gas should be added to the simulation. If this is not done the calculated mass of air inside the inflated bag will be lower than expected, and as such the pressure in the bag in its compressed state will be lower than expected.
3.3 Material Representation
The reinforcing cover of the dunnage bags investigated in this study is manufactured from plain woven polypropylene. This is an anisotropic, noncontinuous, non-homogeneous material, with several time and rate dependent properties, and is sensitive to a number of environmental conditions including temperature.
The physical dunnage bag tests are restricted to ambient temperatures between 16 and 23 ° C and take approximately 10 minutes. The temperature and speed of the test is such that material creep does not play a significant role in the plastic deformation of the material. The temperature range over which the tests are performed is narrow enough that the temperature dependency of the material need not be considered. The strain range and rate in the full bag test was measured using DIC and were both matched during testing of the small representative material samples (swatches), removing the need to account for strain rate dependency in the numerical model. In producing the simplified material representation, the full application range should be used in the calibration of the material.
With these considerations in mind the method proposed by Venter and Venter6 for a simple implementation of plain woven polypropylene fabric was selected to capture the macro-mechanical response of this material sufficiently for a full bag simulation. This study was limited to using only standard material models and element formulations available in current commercially available software. The woven polypropylene was approximated as a combination of spring and membrane elements.
To calibrate the material response model an optimizer is asked to run the equivalent numerical swatch model with given parameter values and extract histories for the load applied to each edge of the numerical swatch and the displacement of each edge of the swatch. The load-elongation curves generated by the numerical model are then compared to those measured during the swatch testing. The optimizer is tasked with minimizing the difference between the response curves produced by the numerical model and the response curves generated in physical tests, by varying the parameters defined in the numerical model.
The optimizer selected is LS-OPT7 which is an integrated optimizer for LS-DYNA. The inverse problem described above was solved using a genetic algorithm as a direct method using a curve matching metric that delivers a single value describing the area between two curves.8 This method has been recommended over the traditional least squares method because of its superior ability to handle curves that double back on themselves as the load-elongation curves do here.
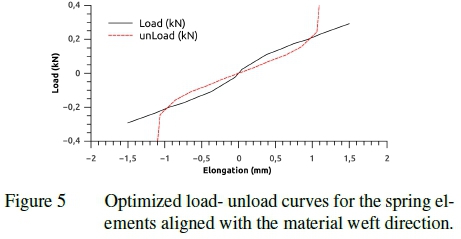
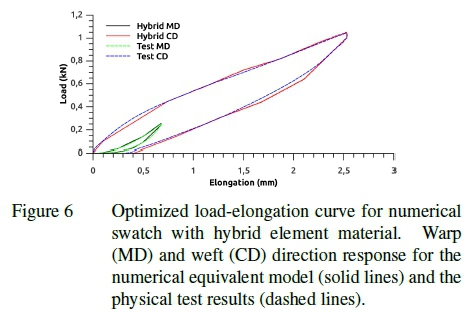
Figure 5 shows an example load and unload curve generated for the non-linear springs aligned with either the material warp or weft direction. Both the load and unload curves are symmetric and function independently in tension and compression. That is when the software detects an increase in strain the load curve is used and when a decrease in strain is detected the unload curve is used. Figure 6 shows the load-displacement curves resulting from physical material tests in the material warp and weft directions as well as the load-displacement curve for the simulated test. In each case the load-unload curve is shown. The method described for calibrating a material response is suitable for most material rep-reservations.9
3.4 Load Case and Boundary Conditions
The numerical dunnage bag is loaded in three phases: inflation to operating pressure, compression, and over-inflation. The bag is loaded by an internal pressure and constrained by two analytical surfaces defined for contact. These analytical surfaces represent the two parallel plates defined in the test specification. In this way the bag is inflated into a static void of 305 mm to the desired pressure of 70 kPa using the hybrid airbag inflation model. Before and after the compression stage, the bag is left in a static void with no additional gas mass being added. During these phases global numerical damping attenuates any unwanted dynamic effects that might produce erroneous results.
Once the bag has been inflated to the desired working pressure and the unwanted dynamic effects have dissipated, the parallel void into which the bag is inflated is reduced from 305 mm to 200 mm where the restraining load reaches the prescribed load. The void is then held for a short time and returned to its initial position at 305 mm.
After the compression cycle the mass of gas in the bag is increased until the pressure in the bag is 250 kPa to ensure that the pressure in the numerical model exceeds the measured burst pressure of the preliminary test.
4 Results and Discussion
Ten physical tests were performed on standard level 4 dunnage bags where pressure, restraining load, and void size were recorded. These results are then compared to the results obtained from the numerical simulation.
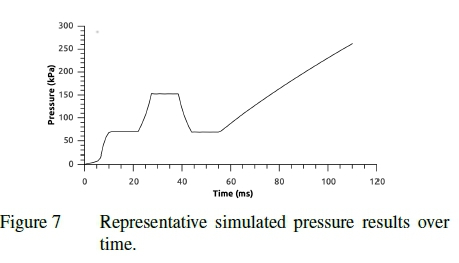
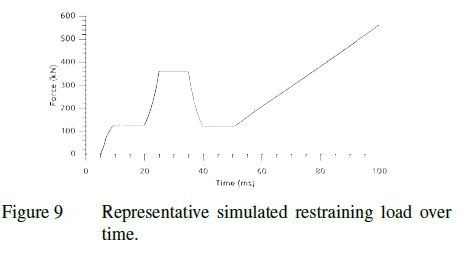
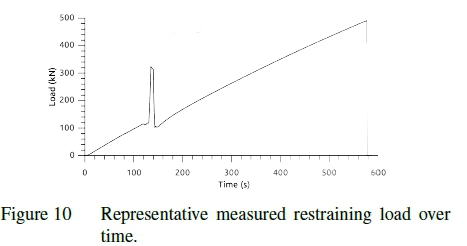
Figures 7 through 10 show the pressure and restraining load recorded for the simulated and measured dunnage bag tests. The figures show the inflation to operating pressure, compression cycle and further inflation. After the compression cycle is completed, the pressure in the bag is lower than before the cycle started which corresponds to plastic deformation occurring in the material. It can be seen that though there is good correlation between the measured and simulated results the time scales and relative duration of the three test phases differ. This is because the simulation has been optimized to reduce the computational resource requirement. The difference in time scales and relative duration of the test phases do not impact the results since no rate or time dependent phenomena are included.
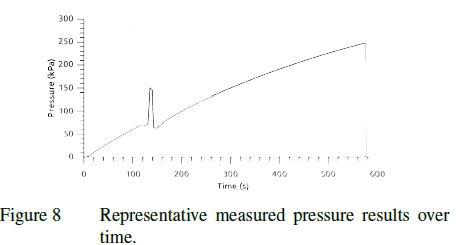
It should also be noted that even though the bags were preconditioned the drop in pressure at the sustained minimum void is indicative of creep. This can be attributed to the preconditioning occurring at a pressure lower than that experience at maximum load. Even though creep has not explicitly been accounted for the total plastic deformation has still been maintained due to the consistent rate and duration of the full bag, swatch and numerical tests. This is an inherent limitation of the material representation used, time is not directly accounted for and as such the time and rate dependencies controlled in the experimental design. If other load rates are of interest the material response should be recalibrated.
4.1 Model Evaluation
Before the predictive capability of the model is assessed a simple model evaluation is undertaken where the model is compared with the expectations of a thin walled pressure vessel and evaluated for self-consistency.
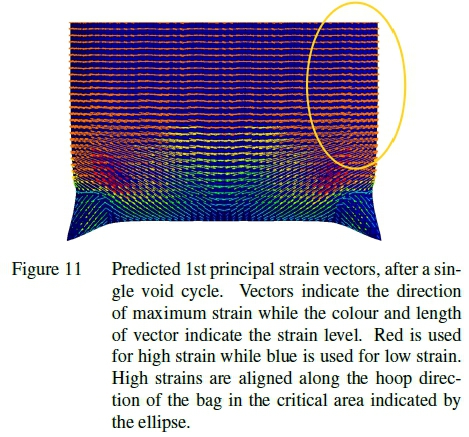
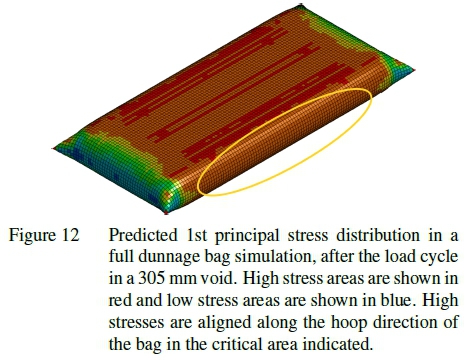
Figure 11 shows a vector plot of the strain predicted by the numerical model. It can be seen by the general alignment of each arrow that the primary loading direction for the bag material along the edge of the bag, indicated by the ellipse, is in the hoop direction of the bag. This matches expectations because the load in the hoop direction should be double that of the lengthwise direction. This also aligns with the weaker weft material direction. This is further confirmed in Figure 12 which shows a high stress along the folded seam corresponding to the long edge of the bag indicated by the ellipse in the figure. This was also found to be the region of the bag most likely to fail during burst testing. It should be noted that the values of the stress predicted by this simulation have no physical meaning. This is due to the homogenization used in the material representation. The stress distribution is however still a useful qualitative tool for evaluating the load distribution.
To investigate the consistency of the numerical model, stress was selected as an indicator metric within the simulation. Areas of high stress in the simulation predict areas of high load in a physical sample. As it was not possible to directly compare the stress in the physical sample with those in the simulation it was decided to use the burst pressure of the physical test and the maximum stress in the simulation for comparison.
The stress along the mid-span of an edge is recorded during the course of a simulated inflation test in a 305 mm void. The failure stress is then selected to be the stress at which the numerical model is subjected to the average measured burst pressure observed in the physical tests, 237 kPa. Even though the underlying polymer is considered to be plastic the discontinuous nature of the material limits the utility of plastic failure criteria. First principal stress though more commonly used to describe brittle materials was used to describe the stress state. The stress corresponding to burst is found to be 142 MPa. Again, this stress should not be interpreted in a physical sense.
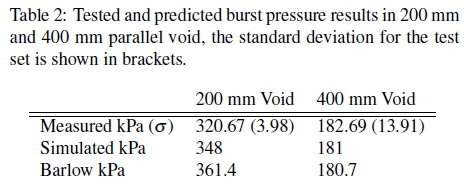
The effectiveness of stress as a predictor of failure is tested in two different voids: a reduced void of 200 mm and an increased void of 400 mm. The reduced void corresponds to the minimum void in the cycle test and is a common inflation void in industry and the increased void is a potential new application being investigated. Two new simulations were performed using each of the two prototype models. The burst pressure in each of the two voids is predicted to be the pressure corresponding to the failure stress defined above.
It was observed in the preliminary tests that in areas not adjacent to the stitched edges of the bag the material load is similar to that of a thin walled pressure vessel. Applying Barlow's formula:
where P is the internal pressure, S is the allowable strength of the material, t is the wall thickness of the material, and D is the diameter. In this case the diameter is equal to the void size and the allowable strength and thickness are assumed to be constant between the three test sets.
The results for burst testing in a parallel void are compared to the burst pressures predicted using Barlow's formula and the simulation in Table 2. These results behave as expected, as the void increases the burst pressure decreases. Both predictors work well in the larger void but vary in the smaller void. The difference seen in the case of Barlow's formula might be accounted for by the fact that the formula is based on a circular cross section. As the void is reduced the actual geometry deviates more significantly from the assumed circular cross section with even stress distribution. As a result the high stress becomes more localized.
The restraining load produced, when the dunnage bag is inflated to operating pressure, was used as a further evaluation metric for the numerical model. During physical testing the restraining load at operating pressure was measured at an average of 116 kN. This is compared to 126 kN predicted by the simulation. The comparison of restraining load takes into account both the geometry changes and material deformation. The difference in the restraining load is accounted for by the material representation under-predicting the stiffening characteristic of the weft direction tows in favour of more accurately reproducing the response of the warp tows.
Based on these results, the model meets the expectations of a thin walled structure and is self-consistent.
4.2 Pressure Drop
The numerical model was then used to predict the pressure drop caused by plastic deformation over a single compression load cycle of the AAR test for pneumatic dunnage.
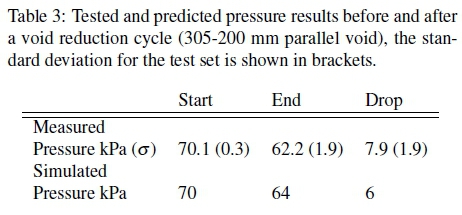
Table 3 compares pressure in the bag at key points during the test. The pressure predicted by the simulation is presented with the physical test data for comparison. The value of interest is the drop in internal pressure due to a single reduction in void size. This is taken as the difference in pressure before the start and after the end of the void reduction cycle. The pressure predicted by the numerical model after the compression cycle is within one standard deviation of the physical testing.
5 Conclusions
A method is proposed for using a simplified numerical model for predicting the pressure drop caused by material plastic deformation in a dunnage bag subjected to a cycled compression load. The method centres on the use of a simplified numerical model that makes use of standard commercial software and replicates the overall response of the system subjected to a test based on the standard industry certification test of the AAR. Numerical optimization is used for calibration of the model, shifting the burden of work away from the analyst in what can become a black-box operation.
The industry test recommended is the AAR 'Product Performance Profile for Pneumatic Dunnage' which requires a cycled compression loading of an inflated dunnage bag and put standards in place governing the allowable pressure drop.
A series of preliminary tests were done to find order level operating ranges for the simplified tests.
A simple bi-axial load-unload test is performed on a material swatch. The load-elongation response of this representative swatch is mapped to a material response model based on a repeating unit cell of non-linear springs. A numerical optimizer is used to perform the mapping. This method provides a good representation of material response without attempting to match the reality of the material itself.
A numerical model with representative geometry was then constructed as per the AAR specification to replicate the physical test. The numerical model made use of moving analytical boundaries to represent the void into which the bag is inflated, an airbag model to calculate the pressure within the bag, and the material representation calibrated earlier.
This full test replica was then evaluated to ensure that it produces the expected results and is self-consistent. The evaluation showed that the general relationship between allowable internal pressure and maximum diameter of the curved region follows Barlow's formula and that the burst pressure predicted by the model approximates the measured burst pressures. In addition the numerical model also approximates the restraining load at operating pressure, which is strongly tied to both the inflated geometry and material response.
The predicted pressure drop calculated using the numerical model was then compared to the pressure drop measured during physical testing. The numerical model was found to predict the pressure drop due to material plastic deformation to within one standard deviation of the measured results. It has been shown that a simple response model can be used to provide application specific answers in a near black-box method, replicating the overall response of the system.
References
[1] AAR, Product Performance Profile for Pneumatic Dunnage. 2004.
[2] Venter MP and Venter G, Development and Validation of a Numerical Model for an Inflatable Paper Dunnage Bag, Packaging Technology and Science, 25, 467-483, 2012. [ Links ]
[3] Hallquist JO, LS-DYNA Theory Manual, Livermore Software Technology Corporation, Livermore, USA, 2006.
[4] Suhey JD, Kim NH and Niezrecki C, Numerical Modeling and Design of Inflatable Structures - Application to Open-Ocean-Aquaculture Cages, Aquaculture Engineering, 2005, 33(4), 285-303. [ Links ]
[5] Cerda E and Mahadevan L, Geometry and Physics of Wrinkling, Physical Review Letters, 90(7), 074302-1-074302-4, 2003. [ Links ]
[6] Venter MP and Venter G, Simple Implementation of Plain Woven Polypropylene Fabric, Journal of In dustrial Textiles, 2016, Advance online publication. Doi:10.1177/1528083716665627.
[7] Stander N, Roux W, Goel T, Eggleston T and Craig K, LS-OPT User's Manual - A Design Optimization and Probabilistic Analysis Tool for the Engineering Analyst, Livermore Software Technology Corporation, Livermore, USA, 2012.
[8] Witowski K, Feucht M and Stander N, An Effective Curve Matching Metric for Parameter Identification using Partial Mapping, 8th European LS-DYNA Users Conference, Strasbourg, 2011.
[9] Venter MP, A Methodology for Numerical Prototyping of Inflatable Dunnage Bags, PhD Thesis, Faculty of Engineering at Stellenbosch University, Stellenbosch, South Africa, 2015. [ Links ]
Received 3 March 2017
Revised form 7 July 2013
Accepted 13 July 2017

