


Servicios Personalizados
Articulo
 Inglés (pdf)
 Articulo en XML
 Referencias del artículo
Indicadores

Links relacionados
-
 Citado por Google
 -
 Similares en Google
Compartir

 Permalink
South African Journal of Libraries and Information Science
versión On-line ISSN 2304-8263
versión impresa ISSN 0256-8861
SAJLIS vol.88 no.1 Pretoria 2022
http://dx.doi.org/10.7553/88-1-1857
RESEARCH ARTICLES
Measuring perceived and actual e-visibility of researchers in environmental science at a South African university
Leslie AdriaanseI; Chris RensleighII
IPersonal Librarian (Science Library) at the University of South Africa. Iadriaan@unisa.ac.za ORCID: 0000-0001-5363-5059
IIProfessor (Information and Knowledge Management) at the University of Johannesburg. crensleigh@uj.ac.za ORCID: 0000-0002-0577-4852
ABSTRACT
This research on e-visibility aims at enhancing research impact and encapsulates the e-visibility themes: 1) research online presence, 2) researcher discoverability, and 3) online research output accessibility. This article reports on the perceived and actual e-visibility to establish the inclusive research impact of researchers based at the School of Environmental Sciences at the University of South Africa. Bibliometric and altmetric data were collected from citation resources, the Web, academic social networking tools and an online survey. The results show a preference towards utilising free information resources and websites above fee based as part of the research online presence, researcher discoverability, research output accessibility and to ascertain their inclusive research impact. In addition, the results of the e-visibility survey reported positive responses and overall positive attitude and perceptions towards the e-visibility training. This research emphasises e-visibility training as part of an e-visibility strategy to increase research online presence, researcher discoverability and online research output accessibility in an attempt to enhance the researchers' e-visibility.
Keywords: E-visibility, research online presence, researcher discoverability, online research output accessibility, researcher e-profiles
1 Introduction
The advances in information and communication technologies allow scientific peer-reviewed research to be readily available online to researchers, thereby empowering researchers to embrace online research practices and become digital citizens of research communities using online avenues (Jeng, He & Jiang 2015). The creation of academic social networking tools for research purposes originates from the need of researchers to utilise social networking technology with the focus on academia and research (Arda 2012; Mangan 2012). The proliferation of academic social networking tools and the adaption to new research processes in a digital environment, enables researchers to not only discover scholarly peer-reviewed information via online research communities, but also to collaborate with like-minded researchers (Lin & Tsai 2011; Redden 2010), in addition to creating and curating scholarly information within academic online research communities (Kortelainen & Katvala 2012).
Research by Cann, Dimitriou and Hooley (2011), as well as Goodier and Czerniewicz (2012) advocate the creation of a research online presence, stressing the importance of increased research impact associated with research available online, with the implication that research output available online is more likely to be downloaded and cited (Lawrence 2001). Researchers are encouraged to focus on publishing in online high-impact journals with the purpose of increasing their visibility to improve discoverability and accessibility (Ale-Ebrahim & Salehi 2013), as visibility is associated with increased downloads and citations of the research (Ale-Ebrahim, Salehi, Embi, Danaee, Mohammadjafari, Zavvari, Shakiba & Shahbazi-Moghadam 2014). The introduction of the concept of e-visibility encapsulating online presence, researcher discoverability and the accessibility of research output, can be seen as a strategy to help improve the research impact of a researcher using e-visibility as the vehicle.
The research for this article represents the final phase of a comparative longitudinal study aiming at developing an e-visibility strategy for researchers in the Department of Environmental Sciences (SES) focussing on the perceived and actual e-visibility of the participants with bibliometric and altmetric data sourced from an e-visibility survey which was collected during December 2016 and completed in April 2017 after being exposed to an e-visibility awareness training strategy. The objectives include investigating the e-visibility indicators, that is, online presence, researcher discoverability and accessibility of the research output of environmental science researchers at Unisa to establishing their perceived and actual e-visibility and giving an inclusive reflection of their research impact. The perceived e-visibility is measured by an online survey distributed to SES researchers and the actual e-visibility is represented by actual indicators sourced from various citation resources and online research communities independently from researchers.
2 Research e-visibility
E-visibility embraces three elements: (1) research online presence, (2) researcher discoverability, and (3) research output accessibility via professional online communities and academic social networking tools and websites. The underlying argument is that by increasing their research online presence, researchers are enhancing their online discoverability and enhancing the research output accessibility of their research. The three elements of e-visibility will be elaborated on in the following section.
2.1 Research online presence
Cheek and 0by (2018) and Norman (2012) suggest that researchers are obliged to adopt online research practices on online research communities to ensure that their research is mentioned, available online and thereby more visible to a wider audience. According to Chung and Park (2012: 207), researcher online presence on the Web is described as "the number of Web mentions of a researcher" and translates to the number of times a researcher is mentioned on the Web or retrieved via an online search. Research online presence therefore alludes to the online mentions of the individual researcher and their associated research output on the various Internet websites, online databases, and repositories. Online presence mentions include traditional citation resources (Web of Science, Scopus, and Google Scholar); academic social networking tools (Mendeley, ResearchGate and Academia.edu); and repositories (UnisaIR); general online mentions on Internet websites (Google, Yahoo & Bing); and professional online mentions on professional websites (LinkedIn).
2.2 Research output accessibility
Various studies indicate that research output should be accessible and available on the various online platforms, for example, research communities for dissemination, sharing and archival purposes (Ale-Ebrahim et al. 2013; De Ridder, Bromberg, Michaut, Satagopam, Corpas, Macintyre & Alexandrov 2013; Laakso, Lindman, Shen, Nyman & Bjbrk 2017; Norman 2012; Repanovici 2010). Further, Czerniewicz and Wiens (2013) suggest that other researchers should be able to retrieve and download research output to allow perusal and citing of the research, and self-archiving of research output on online research communities and repositories (Ale-Ebrahim et al. 2013). Research output accessibility includes the availability of research output linked to e-profiles on online databases and traditional citation resources (Web of Science, Scopus and Google Scholar); academic social networking tools (ResearchGate, Academia.edu and Mendeley); and repositories (UnisaIR); on the Web via online search engines and websites (Google, Yahoo and Bing); and on professional websites (LinkedIn).
Figure 1 represents e-visibility as a process illustrating three themes: research online presence, researcher discoverability and research output accessibility. In essence, e-visibility allows a researcher and their research output to be discovered by conducting online searches, that is, a research online presence, via websites and online research tools and platforms via research e-profiles, that is, the researcher is discoverable, and any research output linked to the research e-profiles can be accessed and downloaded, that is, the research output is accessible. Enhancing research e-visibility becomes vital for researchers to increasing their research impact.
Research by Ale-Ebrahim et al. (2014) and Lawrence (2001) revealed a relationship between the visibility of an article and the citation counts suggesting that the visibility of an article increases the opportunity to attract citations hence increasing research impact. This implies that increasing e-visibility of researcher increases the research impact of researcher and places emphasis on the importance of increasing research e-visibility.
3 Research impact
Various studies have indicated that the measurement of research performance is conducted using bibliometric data (Bornmann 2014a 2014b; Lawrence 2001; Roemer & Borchardt 2012). It is generally accepted that an increased citation rate translates to an increased research performance and consequently increased research impact. Although traditionally, the research impact of researchers was produced by the analysis of citation data sourced exclusively from traditional citation resources, the advent of altmetrics has allowed for the incorporation of altmetric data sourced from various online sources and online platforms into the equation of measuring research impact. The bibliometric data represents the citation data (i.e., citation counts, h-index) recorded by traditional citation resources giving a reflection of actual citations received, hence giving a reflection of the traditional research impact.
The altmetric data (views, downloads, readers, tweets) represents the attention given to the research by a larger audience of research society, with access to online sources and platforms hence giving a reflection of the societal impact of the research (Caberra, Roy & Chisolm 2017; Kjellberg, Haider & Sundin 2016). The adoption of altmetrics is seen as an attempt to provide a more inclusive reflection to the measurement of research impact, where both the traditional research impact and the societal impact paint a more complete picture of a researchers impact in a discipline, that is, inclusive research impact (Bornmann 2015; Bornmann & Marx 2014; Costas, Zahedi & Wouters 2014; Yeong & Abdullah 2012).
4 Introducing an e-visibility awareness training strategy as intervention
The vision of an e-visibility strategy to enhance research e-visibility for researchers is considered a crucial outcome and involves an instructional component as part of implementation, using an action plan in the development of an e-visibility strategy. Action plans have traditionally been successfully employed as part of instructional programmes in library training (Foxon 1994); and form part of the academic librarian's mandate to creating awareness of the understating and importance of inclusive comprehensive research metrics to enhancing e-visibility (Hobbs 2011; Johnson 2009; Persson & Svenningsson 2016).
Academic librarians as active members of research support team within in academic environments, have a role to play by becoming change agents and facilitators to the enhancement of the understanding and importance of research metrics of researchers in research performance evaluation (Corrall 2014; Enis 2015; Renn 2016). This involves firstly, taking the initiative, as academic librarians to learn more and gain understanding research metrics and how to incorporate it? them? into as part of research support, and secondly, actively planning and promoting comprehensive research metrics as part of research support to researchers by using marketing and educational material and technologies to researchers (Enis, 2015; Konkiel, Sutton & Levin-Clark 2015; Miles et al. 2018; Corrall 2015).
The PDCA (Plan-do-check-act) was employed as guidelines to the development of an e-visibility strategy allowing for defining the objectives, target group and the choice of tools to use as the intervention (Persson & Svenningsson 2016). Utilising the PDCA and incorporating appropriately identified websites and tools with social media functionalities, an effective e-visibility strategy was introduced as intervention to enhance e-visibility (Persson & Svenningsson 2016; Hobbs 2011; Johnson 2009). This culminates in an e-visibility training as part of the librarians training plan with formal training sessions for the academic year with a predetermined target group, in this case, science researchers affiliated with CAES (College of Agriculture and Environmental Sciences).
Selection of relevant and appropriate content and building on existing experiences was key to the implementation of the e-visibility intervention. It became evident that the content should enhance awareness around research e-visibility as to its importance and the benefits; research and performance traditional and alternative metrics; and research profiles as enhancers of research e-visibility. The content for e-visibility training focussed on a theoretical and practical "hands-on" section increasing understanding of research metrics and its importance in research performance evaluation.
Existing literature (popular and scholarly) on research metrics was consulted and utilised to develop the theory component of the relevant and appropriate content for the e-visibility training. The theoretical sections about digital technologies in research support, e-visibility and the e-visibility themes were consulted (Corrall 2015; Caberra et al. 2017; Nolin 2013; Thompson & French 2016; Zohoorian-Fooladi & Abrizah 2014) and the theoretical section about research metrics were consulted (Caberra et al. 2017; Crotty 2014; Malone & Burke 2016; Pradhan & Dora 2015; Reed et al. 2016; Suiter & Moulaison 2015).
The "hands-on section of the training allowed for the theory to be applied during the registration of the research profiles with a focus on formal research e-profiles such as ResearcherID, Scopus, AuthorIDs, Google Scholar Citation Profiles and ORCID, to informal research e-profiles on academic social media such as ResearchGate, Academia.edu, Mendeley, and Twitter.
The promotion of the e-visibility training was conducted along existing channels. The creation of an online support training tool with 24/7 online availability for training and awareness support on the e-visibility strategy as suggested by Konkiel et al. (2015), where library guides can be used successfully in creating awareness and for instructional support by academic librarians. The research e-visibility awareness and training intervention for the Environmental Sciences researchers at Unisa was introduced during January 2015 and December 2016.
5 Research Methodology
The aim of this article is to measure the perceived and actual e-visibility after introducing an e-visibility awareness and training intervention with the purpose of developing a research e-visibility strategy for researchers in an attempt to enhance and increase research e-visibility. This article reports on the perceived and actual e-visibility of the SES researchers between December 2016 and April 2017, comprising a total of 76 researchers at Unisa as part of the client base for research support for academic librarian, after implementing an e-visibility strategy for environmental science researchers.
The data collected during December 2016 and April 2017, for the e-visibility study employed a quantitative research approach focussing on a survey collecting data to determine the perceived e-visibility, and the collection of altmetric-bibliometric data of the SES researchers at during the two-year period, to ascertain the actual e-visibility of the researchers from the Department of Environmental Sciences. The bibliometric and altmetric data comprised of the indicators, that is, researcher representation, the number of publications, citation counts per researcher on citation resources (Web of Science, Scopus & Google Scholar); altmetric counts on alternative citation resources (reads from ResearchGate, views from Academia.edu, readers from Mendeley). The data were extracted during the online searches with statistical analysis conducted using the SPSS software to ascertain actual e-visibility.
The data representing perceived e-visibility, was collected from 62 participants (82%) representation of SES researchers) via an online survey in April 2017 using a semi-structured questionnaire. The e-visibility survey collected e-visibility related data to ascertain research online presence, researcher discoverability, online research output accessibility, research presence on social networking tools, determining traditional and alternative research impact and perceptions of e-visibility training. The survey responses were recorded, coded and SPSS software was used for the analysis to derive the descriptive statistics used to ascertain the perceived e-visibility.
6 Results and Discussions of e-visibility study
The results for perceived e-visibility and actual e-visibility of the SES researchers are presented for consideration.
6.1 Biographical profile on SES researchers
The e-visibility survey indicated a completion rate of 66% of the SES researchers participating. The results indicate 67% of the respondents were older than 41 years, with the majority (95%) of the respondents had postgraduate qualifications with the predominant qualification being a master's degree (39%). Regarding post levels, the highest distribution was for lecturer 28%, followed by researcher 26%, associate professor 13%, junior lecturer 8%, manager 3%, and other 3%. The majority (51%) of the respondents identified themselves as being appointed as researchers, associate professors, and professors with purpose to conduct research with 59% of respondents identified themselves as emerging researchers and 26% as established researchers.
6.2 Results for actual and perceived e-visibility
Following a summary of the actual and perceived e-visibility indicators, that is, research online presence, researcher discoverability and research output accessibility in Table 1.
6.2.1 Results for researcher online presence
The representation of the perceived and actual e-visibility of the SES researchers, sourced from Table 1, is shown in Figure 2.
The perceived online presence from survey indicates a high distribution on online search engines and social media (freely available on the Web) on Google Scholar (90%), Google (82%), Facebook (66%), and ResearchGate (62%), to ascertain online research presence. The results further show lower percentages of usage on fee-based traditional citation resources in ascertaining their online presence and research related information on Scopus (59%) and Web of Science (36%). Regarding the preference of online search engine and tools to search for research output, the majority (67%) of the respondents indicated preference to Google Scholar, followed by Google (23%) and Scopus (8%). Further, the results indicate that 44% of respondents made use of Mendeley as an online reference management tool, followed by 3% using CrossRef and CiteuLike respectively.
The actual online presence results showed a high percentage of distribution on Google (100%), followed by Yahoo (98%) and Bing (94%) representing online search engines. The Unisa institutional website indicted a 74% distribution for Unisa affiliation. Facebook (84%), LinkedIn (89%) and Google+ (60%) reported high distributions for online presence representing social networking tools, with Academia.edu (55%) and ResearchGate (69%) representing academic social networking tools. Scopus (52%) and Web of Science (47%), both representing fee-based traditional citation resources, indicated a lower percentage of online presence.
6.3 Results for researcher discoverability
Using results from Table 1, the SES respondents perceived, and actual discoverability is illustrated in Figure 3.
The results for perceived discoverability pertaining to the online websites and databases used to create or register online profiles, show that the majority (85%) used ResearchGate. The results indicate that LinkedIn had a distribution of 64%, followed by Google Scholar (54%), ORCID and Academia.edu (49% each), Scopus (36%), Mendeley and ResearcherID (18% each). Further, 5% of the respondents indicated non-usage regarding utilising online websites and databases to create or register e-profiles. Regarding the actual discoverability with data sourced from the research e-profiles, LinkedIn indicated the highest percentage of research e-profiles (89%), followed by ResearchGate (69%), Google Scholar (61%), Academia.edu (58%), Mendeley (55%), Scopus and ORCID with 53% respectively, and ResearcherID with 44%. Regarding the perceived discoverability, the largest distribution of the profiles was found on free social networking tools and traditional citation resources such as ResearchGate, LinkedIn and Google Scholar. Regarding online research profiles, the results report a preference for the creation of e-profiles on free above traditional citation resources (Web of Science, Scopus, Google Scholar and ORCID).
ResearchGate (39%) was ranked the most preferred tool to create an online research e-profile followed by Google Scholar (31%). Further, 87% of the respondents also indicated ResearchGate (44%) to be deemed the most useful research e-profile. The respondents indicated Mendeley (44%) as the most used tool and most useful to create a research presence on an academic social networking tool.
The results representing the actual discoverability of the SES researchers indicated that 79% of the respondents presented three or more research e-profiles, followed by 10% having two research e-profiles, and 8.1% having only one research e-profile and 3% having no research e-profiles. The largest overlap was between LinkedIn and ResearchGate with 61% of the respondents having research e-profiles. Mendeley and ORCID presented with the minimum overlap on research e-profiles with 27% respectively.
6.4 Results for research output accessibility
Of the respondents, 67% indicated archiving journal articles, 33% book chapters, 31% reviewed papers from conference proceedings, 15% books, 10% slide presentations, 8% conference papers and unpublished research, and 5% pictures/photos/figures. The results pertaining to accessibility, report that 26% of the researchers did not archive research output. In addition, 35% of the respondents indicated archiving their research output on academic social networking tools (Academia.edu, ResearchGate and Mendeley), followed by 21% for institutional repositories, 19% for traditional research e-profiles (ResearcherID and Google Scholar), and ORCID (10%).
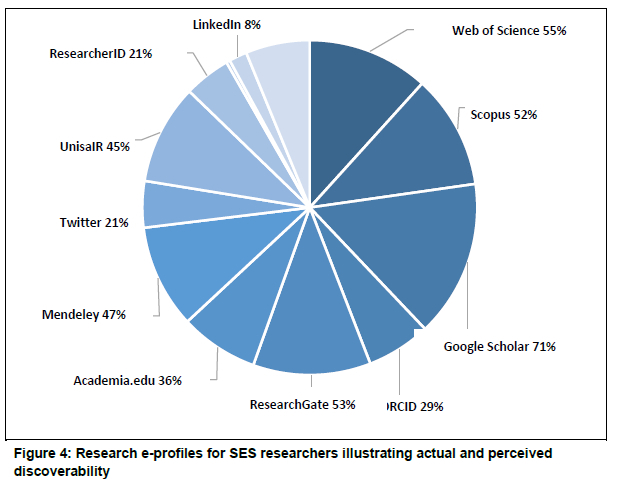
The actual accessibility of the SES respondents revealed that Google Scholar (71%), followed by Web of Science (55%), ResearchGate (53%), and Scopus (52%), reported the highest distribution of research output per researcher. This translates to research output accessibility of more than 50% accessibility. The actual online accessibility of the respondents on the various databases, websites and social networking tools was illustrated in Figure 4.
The results also found 26% of the respondents did not archive their research output.
6.5 Online research impact
Table 2 includes a summary of the actual and perceived e-visibility indicators, that is, research online presence, researcher discoverability and research output accessibility.
Google Scholar (67%), followed by Scopus (36%) and Web of Science (26%), represented the perceived online research impact distribution, with 28% of the respondents not making use of traditional citation resources to ascertain traditional research impact. Regarding the perceived alternative research impact results, the respondents indicated ResearchGate (46%), followed by Academia.edu (18%), to ascertain non-traditional research impact.
The results show a total of 1157 citations for the SES respondents on Web of Science, with a maximum of 303 citations per researcher and an average per researcher of 18.7 citations output. The results also show a total of 1623 citations from Scopus, with, a maximum of 337 citations per researcher and an average of 26.6 citations output per SES researcher. In addition, the results show a total of 3536 citations for the SES respondents on Google Scholar, a maximum of 667 citations per researcher and an average of 57 citations per SES researcher.
The actual traditional research impact results show a larger distribution of citations on Google Scholar, with a larger maximum number of citations per researcher for the SES respondents and a higher average of citations per researcher than Web of Science and Scopus representing traditional citation resources. Table 2 includes the results representing the actual alternative impact report the altmetrics data derived from websites and academic social networking tools specific identified for the study.
The results show a total of 14327 views for the SES respondents on Academia.edu, with a maximum of 6160 views per researcher and an average of 231 views per SES researcher. The results further show a total of 34826 reads for the SES researchers on ResearchGate, with a maximum of 5486 reads per researcher and an average of 562 reads per SES researcher.
The actual non-traditional research impact results show a larger distribution of altmetrics on UnisaIR, a larger maximum number of altmetrics per researcher for the SES respondents and a higher average of altmetrics per researcher than on the social networking tools Academia.edu, ResearchGate and Mendeley.
6.6 E-visibility training
The results from the e-visibility survey which focussed on feedback on e-visibility awareness training as part of the e-visibility strategy, gave insight into the attitudes and perceptions of e-visibility of the SES respondents, as 84.6% of the researchers responding to the questions posed on e-visibility training.
The majority (73%) of respondents indicated that e-visibility training enhanced their research online presence. In addition, 69% indicated that the e-visibility training enhanced their researcher discoverability. The majority (76%) of the survey respondents also indicated that e-visibility training enhanced their research output accessibility. The majority (76%) indicated that the e-visibility training enhanced their e-visibility as a whole.
Feedback from the SES researchers participating in the survey delivered interesting insights into their perceptions on the e-visibility training. Most of the responses to the survey across the sub-themes were positive apart from three negative remarks.
7 Discussion of e-visibility results
The following is a discussion of some of the results around the perceived e-visibility from e-visibility survey and data representing the actual e-visibility of the SES researchers as at the end of the study in December 2016.
7.1 Discussion of results for research online presence
Taking the results for research online presence of the SES researchers into consideration, it can be deduced that there is a high distribution for perceived and actual online presence on websites and social networking tools freely available on the Web. The results suggest that the SES researchers prefer using the search engines and Web resources freely available on the Web. Similar results were reported for the first phase of the e-visibility study with the SES researchers indicating a higher participation on websites and academic social networking tools that are freely available on the Web (Adriaanse & Rensleigh 2017).
Studies by Nicholas, Boukacem-Zeghmouri, Rodríguez-Bravo, Xu, Watkinson, Abrizah, Herman and Swigoñ (2017) found early career researchers used Google Scholar as a popular free discovery tool and for initial discovery searching for research purposes and 53% of participating researchers in a survey by Hemminger, Lu, Vaughn and Adams (2007). Similarly, research by Niu, Hemminger, Lown, Adams, Level, McLure, Powers, Tennant and Cataldo (2010) found that researchers had a preference to using free search engines when conducting meta-searching as they were familiar with search engines. The research above supports the results of the research study at hand.
7.2 Discussion of results for researcher discoverability
Pertaining to the perceived online discoverability, the largest distribution of the profiles was found on free social networking tools and traditional citation resources such as ResearchGate, LinkedIn and Google Scholar indicating a preference to using e-profiles which are freely available on the Web above traditional citation resources (Web of Science, Scopus, Google Scholar and ORCID). The actual researcher discoverability representing the research e-profiles of the SES researchers, reported a uniform distribution on LinkedIn and ResearchGate, that is, free social networking tools. However, a smaller distribution was represented on Scopus, that is, subscription-based citation resources.
Similar results were reported in research by Mikki et al. (2015) with the highest distribution of e-profiles in ResearchGate. The high distribution of research e-profiles on LinkedIn, ResearchGate and Google Scholar indicates a uniform distribution of research e-profiles between the free social networking tools and citation resources. Greifeneder, Pontis, Blandford, Attalla, Neal and Schlebbe (2017) and Nicholas, Clark and Hermanet (2016) report in their research, that researchers using LinkedIn to create a research presence for networking with other researchers on a professional level. Research by Menendez, de Angeli, and Menestrina (2012) and Jamali, Russell and Nicholas (2014), indicated similar results with a large distribution of research e-profiles available on professional websites such as LinkedIn and social networking tools such as ResearchGate and Academica.edu that are freely available on the Web.
The implications of the results for the researcher discoverability results include a high online discoverability on professional and social networking tools which are freely available on the Web and a lower distribution regarding the online discoverability on traditional resources. Regarding ResearchGate deemed the most useful for creating a research presence using a research e-profile as part of perceived research discoverability similar results were found by Nicholas et al. (2016) and Van Noorden (2014) where ResearchGate was the most preferred tool, and the most popular (Ali & Richardson 2017; Van Noorden 2014). Regarding Mendeley deemed to be the most useful social reference tool to create a research presence on, research by Haustein, Lariviére et al. (2014) reported Mendeley as the most popular, and Bar-Ilan et al. (2012) reported Mendeley as the most preferred social referencing tool. With reference to the overlap of research profiles, similar results were reported in studies by Mikki et al. (2015), which conveyed an overlap of more than 50% for the research profiles on ResearchGate and Academia.edu, with the results from the current study indicating a slightly smaller overlap for ResearchGate and Academia.edu of 48%.
7.3 Discussion of results for research output accessibility
The low levels of research output being archived implies low levels of research output accessibility an online research community and translates to research output not discoverable for retrieval. Cullen and Chawner (2011) reported similar concerns for academics regarding low participation in self-archiving practices at a New Zealand institution with a focus on institutional repositories, and Jantz and Wilson (2008) and Lercher (2008) reported low use of digital repositories for archiving research output. According to Muscanell and Utz (2017) and Tenopir, Christian, Anderson, Estelle, Allard and Nicholas (2017), self-archiving on academic social networking tools such as ResearchGate is deemed useful for disseminating research output online. Jantz and Wilson (2008) and Lercher (2008) proposed low self-archiving practices translates to the significance of an institutional repository is not realised and poses as obstacle in the success of an institutional repositories. The importance of convincing researchers for self-archiving practices is deem as essential part of research practices (Swan & Carr 2008; Ale-Ebrahim et al. 2014).
7.4 Online research impact
Regarding the results for actual traditional research impact, it was evident that SES researchers maintained lower representation on traditional citation resources than on free citation resources. The perceived traditional research impact results show that the majority of the respondents used Google Scholar to determine their traditional research impact which implies using a free tool to ascertain their research impact. Similarly, there was a lower representation on traditional citation resources than on free citation resources. Nicholas et al. (2016) indicated similar results with early career researchers considered Google Scholar as a popular search engine and discovery tool and deemed it a "good starting point for researchers" (Grey, Hamilton, Hauser, Janz, Peters & Taggart 2012: 7). Studies by Harzing and Alakangas (2008), and Harzing and Van der Wal (2016) reported similar results with Google Scholar having higher citation counts than Web of Science.
Taking the actual non-traditional research impact results into consideration, similar findings are reported for higher distribution of altmetrics on institutional repositories. Obrien, Arlitsch, Sterman, Mixter, Wheeler and Borda (2016) suggested a symbiotic relationship between Google Scholar and institutional repositories. They suggested that the referrals from Google Scholar to repositories 48%-66% occur as a result of researchers conducting searches on Google Scholar for research publications. Additionally, Google Scholar is renowned to be a popular research discovery tool (Nicholas et al. 2017: 19). Given the above, the study suggests that the higher number of UnisaIR views (altmetrics) for the SES respondents can be as a result of the wider coverage of research publications on Google Scholar and the consequent search traffic and popularity of Google Scholar as a research discovery tool.
Further, the higher numbers of citations on Google Scholar, representing the maximum number of citations per researcher compared to Web of Science and Scopus, indicates that the higher count of citations can be attributed to a wider coverage of research publications on Google Scholar than both Web of Science and Scopus (Hilbert, Barth, Gremm, Gros, Haiter, Henkel, Reinhardt & Stock 2015). The utilisation of citation resources with bibliometric information has become a crucial element of measuring of the traditional research impact and performance of researchers, that is, citation counts and average citation counts (Bornmann 2014a; Bornmann 2014b; Roemer & Borchardt 2012), and determining the h-index of the researcher for individual performance (Hirsch 2005) as well as ascertaining the various impact factors for the performance of journals such as the Clarivate Journal impact Factor and CiteScore factors by SciMago (Waltman 2016).
7.5 Discussion on the results for e-visibility training
The results for the survey suggest that the majority of the SES researchers participating in the survey perceived the e-visibility training to have enhanced their e-visibility. The majority of the responses to the survey across the sub-themes were positive and suggest that the e-visibility training was perceived as positive by the SES researchers participating in the survey. Given the positive responses, it can be deduced that there is an overall positive attitudes and positive perceptions towards the e-visibility training. The study therefore recommends using the e-visibility awareness training as part of a strategy to enhance e-visibility and bridge the gap between the perceived and actual e-visibility of the SES researchers.
8 Conclusions and Recommendations
This article highlighted the perceived and actual e-visibility of the SES researchers at the University of South Africa which was represented by the themes: research online presence, researcher discoverability and accessibility of research output, which embodies the e-visibility.
Regarding research online presence, free websites and social networking tools indicated a higher distribution of the majority of the SES respondents whereas fee-based Web resources reported a lower distribution on online presence. Therefore, suggesting the preference to using free search engines, that is, Google Scholar therefore implying a preference towards using the free search engines to establish a research online presence.
Regarding the researcher discoverability, free social networking tools for research e-profiles such as LinkedIn, ResearchGate and Academia.edu, were used more than Web of Science, Scopus, Google Scholar and ORCID, to ascertain the perceived online discoverability. Concerning the research e-profiles representing the actual researcher discoverability, a uniform distribution on LinkedIn and ResearchGate, of which both professional and social networking tools are freely available on the Web, are reported, where Scopus and Web of Science, representative of traditional citation resources, report a lower representation of research e-profiles. Therefore, a high researcher discoverability is implied on professional and social networking tools which are freely available on the Web and lower researcher discoverability from traditional resources.
Regarding the research output accessibility of the SES researchers, the perceived research output accessibility indicates a low percentage of researchers uploading or archiving research output online translating to a low percentage of self-archiving. The actual research output accessibility of the SES researchers revealed that the largest distribution of research output per researcher accessible was located on websites and social networking tools freely available on the Web, with a preference for Google Scholar and ResearchGate with and a distribution of above 50% on the traditional citation resources such as Web of Science and Scopus.
Regarding the traditional research impact, the perceived traditional research impact indicates that the majority of the researchers used traditional citation resources such as Google Scholar to determine their traditional research impact. This implies that the respondents preferred using Google Scholar to ascertain their traditional research impact. The actual traditional research impact indicates a larger distribution of citations, a higher maximum number of citations per researcher for the SES respondents and a higher average of citations per researcher on Google Scholar, than Web of Science and Scopus representing citation resources.
The perceived alternative research impact suggests a utilisation of ResearchGate to ascertain alternative research impact. The actual non-traditional research impact of the SES researchers suggests a larger distribution of altmetrics, a larger maximum number of altmetrics per researcher and a higher average of altmetrics per researcher on UnisaIR, than on the social networking tools such as Academia.edu, ResearchGate and Mendeley. This implies a preference to using ResearchGate to ascertain alternative research impact.
The majority of the SES researchers' responses perceived the e-visibility training as positive and therefore implies there is an overall positive attitudes and positive perceptions towards the e-visibility training.
Research e-visibility embodies the research online presence of the SES researchers located on online research communities and the Internet, the researcher discoverability represented by online research e-profiles, and the research output accessibility of the researcher's online research availability.
This study reports on the e-visibility indicators of the SES researchers establishing the research online presence; researcher discoverability and research output accessibility to illustrate the extent of research e-visibility and give an overview of the inclusive research impact of the SES researchers. Further research would need to be conducted to ascertain whether the research e-visibility strategy used for the SES researchers would be applicable to researchers in other subject disciplines in an tempt to enhance research e-visibility.
References
Adriaanse, L.S and Rensleigh, C. 2017. E-visibility of environmental science researchers at the University of South Africa. South African Journal of Libraries and Information Science, 83(2): 30-41. [ Links ]
Ale-Ebrahim, N and Salehi, H. 2013. Maximize visibility: a way to increase citation frequency. University of Malaysia High Impact Research Special feature, May:1-5. [Online]. http://works.bepress.com/aleebrahim/77/ (10 August 2015).
Ale-Ebrahim, N., Salehi, H., Embi, M.A., Gholizadeh, H., Motahar, S.M and Ordi, A. 2013. Effective strategies for increasing citation frequency. International Educational Studies, 6(11):93-99. [Online]. http://papers.ssrn.com/sol3/Papers.cfm?abstractid=2344585 (10 August 2015). [ Links ]
Ale-Ebrahim, N.A., Salehi, H., Embi, M.A., Danaee, M., Mohammadjafari, M., Zavvari, A., Shakiba, M and Shahbazi-Moghadam, M. 2014. Equality of Google Scholar with Web of Science Citations: Case of Malaysian Engineering Highly Cited Papers. Modern Applied Science, 8(5):63-69. [Online]. http://www.ccsenet.org/journal/index.php/mas/article/view/37570 (2 August 2019). [ Links ]
Ale-Ebrahim, N., Salehi, H., Embi, M.A., Tanha, F.H., Gholizadeh, H and Motahar, S.M. 2014. Visibility and Citation Impact. International Education Studies, 7(4):120-126. [Online]. http://www.ccsenet.org/journal/index.php/ies/article/view/33984 (2 August 2019). [ Links ]
Ali, M.Y and Richardson, J. 2017. Pakistani LIS scholars' altmetrics in ResearchGate. Program, 51(2):152-169. [Online]. https://www.emerald.com/insight/content/doi/10.1108/PROG-07-2016-0052/full/html (10 June 2019). [ Links ]
Arda, Z. 2012. Academicians on online social networks: Visibility of academic research and amplification of audience. Estudios sobre el mensaje periodístico, 18:67-75. [Online]. http://dialnet.unirioja.es/servlet/articulo?codigo=4213526 (10 August 2015). [ Links ]
Bar-Ilan, J. 2012. JASIST@mendeley. In Proceedings of the ACM Web Science 2012 Workshop held in Evanstan, Ill.: Conducted by the Altmereics12 Congress.
Bornmann, L. 2014a. Do altmetrics point to the broader impact of research? An overview of benefits and disadvantages of altmetrics. Journal of Informetrics, 8(4):895-903. [Online]. http://www.sciencedirect.com/science/article/pii/S1751157714000868 (10 June 2019). [ Links ]
Bornmann, L and Marx, W. 2014b. How should the societal impact of research be generated and measured? A proposal for a simple and practicable approach to allow interdisciplinary comparisons. Scientometrics, 98(1):211-219. [Online]. http://link.springer.com/article/10.1007/s11192-013-1020-x (29 May 2014). Available: [ Links ]
Cann, A., Dimitriou, K and Hooley, T. 2011. Social media: a guide for researchers. London: Research information network. [Online]. http://derby.openrepository.com/derby/handle/10545/196715 (14 August 2016). [ Links ]
Caberra, D., Roy, D and Chisolm, M.S. 2017. Social media scholarship and alternative metrics for academic promotion and tenure. Journal of the American College of Radiology, 15(1PB): 135-141. Available from: https://doi.org/10.1016/j.jacr.2017.09.012 (Accessed 7 June 2018). [ Links ]
Cheek, J and 0by, E. 2018. "Getting attention" creating and presenting the visible, online and researcher self. Qualitative Inquiry, 1-12. [Online]. http://journals.sagepub.com/doi/10.1177/1077800418806593 (4 November 2018).
Chung, C and Park, H. 2012. Web visibility of scholars in media and communication journals. Scientometrics, 93(1):207-215. [Online]. http://www.akademiai.com/doi/abs/10.1007/s11192-012-0707-8 (14 February 2015). [ Links ]
Corrall, S. 2015. Capturing the contribution of subject librarians. Library Management, 36(3): 223-234. Available from: http://doi.org/http://dx.doi.org/10.1108/LM-09-2014-0101 (Accessed 2 August 2016). [ Links ]
Costas, R., Zahedi, Z and Wouters, P. 2014. Do "altmetrics" correlate with citations? Extensive comparison of altmetric indicators with citations from a multidisciplinary perspective. Journal of the Association for Information Science and Technology, 66(10): 2003-2019. [ Links ]
Crotty, D. 2014. Altmetrics: Finding meaningful needles in the data haystack. Serials Review, 40(3): 141-146. Available from: https://doi.org/10.1080/00987913.2014.947839 (Accessed 1 October 2018). [ Links ]
Cullen, R. & Chawner, B. 2011. Institutional repositories, open access, and scholarly communication: A study of conflicting paradigms. The Journal of Academic Librarianship, 37(6):460-470. [ Links ]
Czerniewicz, L. & Wiens, K. 2013. The online visibility of South African knowledge: searching for poverty alleviation: Building the information society. The African Journal of Information and Communication, August:30-41. [Online]. http://reference.sabinet.co.za/saepublicationarticle/afjicn13a4 (10 August 2015).
De Ridder, J., Bromberg, Y., Michaut, M., Satagopam, V.P., Corpas, M, Macintyre, G. & Alexandrov, T. 2013. The Young PI Buzz: Learning from the organizers of the junior principal investigator meeting at ISMB-ECCB 2013. PLoS Computational Biology, 9(11): e1003350. [ Links ]
Enis, M. 2015. Altmetrics ambassadors. Library Journal, October: 30-32.
Foxon, M. 1994. A process approach to the transfer of training: Part 2. Australian Journal of Education Technology, 10(1): 118. [ Links ]
Goodier, S and Czerniewicz, L. 2012. Academics' online presence: a four-step guide to taking control of your visibility. [Online]. http://openuct.uct.ac.za/sites/default/files/Online_Visibility_Guidelines.pdf (10 August 2015).
Greifeneder, E., Pontis, S., Blandford, A., Attalla, H., Neal, D and Schlebbe, K. 2018. Researchers' attitudes towards the use of social networking sites. Journal of Documentation. 74(1):119-136. [Online]. https://www.emerald.com/insight/content/doi/10.1108/JD-04-2017-0051/full/html (10 June 2019). [ Links ]
Grey, J.E., Hamilton, M.C., Hauser, A., Janz, M.M., Peters, J.P and Taggart, F. 2012. Scholarish: Google Scholar and its value to the sciences. Science and Technology Librarianship, summer 2012:1-10.
Harzing, A.W. & Alakangas, S. 2016. Google Scholar, Scopus and the Web of Science: a longitudinal and cross-disciplinary comparison. Scientometrics, 106(2):787-804. [Online]. https://link.springer.com/article/10.1007/s11192-015-1798-9 (10 June 2019). [ Links ]
Harzing, A.K and Van der Wal, R. 2008. Google Scholar as a new source for citation analysis. Ethics in science and environmental politics, 8(1): 61-73. [ Links ]
Haustein, S., Larivière, V., Thelwall, M., Amyot, D and Peters, I. 2014. Tweets vs. Mendeley readers: How do these two social media metrics differ? IT-Information Technology. 56(5):207-215. [Online]. http://www.degruyter.com/view/j/itit.2014.56.issue-5/itit-2014-1048/itit-2014-1048.xml (23 August 2016). [ Links ]
Hemminger, B.M., Lu, D., Vaughn, K.T.L and Adams, S. 2007. Information seeking behavior of Academic Scientists. Journal of the American Society for Information Science and Technology, 58(14):2205-2225. [ Links ]
Hilbert, F., Barth, J., Gremm, J., Gros, D., Haiter, J., Henkel, M., Reinhardt, W and Stock, W.G. 2015. Coverage of academic citation databases compared with coverage of scientific social media. Online Information Review. 39(2):255-264. [Online]. https://www.emerald.com/insight/content/doi/10.1108/OIR-07-2014-0159/full/html (10 June 2019). [ Links ]
Hirsch, J.E. 2005. An index to quality an individual's scientific research output. Proceedings of the National Academy of Sciences of the United States of America, 102(46):16569-16572. [ Links ]
Hobbs, R. 2011. Empowering learners with digital and media literacy. Knowledge Quest, 39(5): 12-17. [ Links ]
Jamali, H.R., Russell, B and Nicholas, D. 2014. Do online communities support research collaboration? Aslib Journal of Information Management, 66(6):603-622. [Online]. http://www.emeraldinsight.com/doi/abs/10.1108/AJIM-08-2013-0072 (19 August 2016). [ Links ]
Jantz, R.C and Wilson, M.C. 2008. Institutional repositories: Faculty deposits, marketing, and the reform of scholarly communication. The Journal of Academic Librarianship, 34(3):186-195. [ Links ]
Jeng, W., He, D and Jiang, J. 2015. User participation in an academic social networking service: a survey of open group users on Mendeley. Journal of the Association for Information Science and Technology, 66(5):890-904. [Online]. http://onlinelibrary.wiley.com/doi/10.1002/asi.23225/abstract;jsessionid=BE19B6F1FC975B9C31777DDE033E2EFE.f04t02?userIsAuthenticated=false&deniedAccessCustomisedMessage= (10 August 2015). [ Links ]
Kjellberg, S., Haider, J and Sundin, O. 2016. Researchers' use of social network sites: A scoping review. Library and Information Sciences Research, 38: 224-234. [ Links ]
Johnson, W.G. 2009. Developing an information literacy action plan. Community & Junior College Libraries, 15: 212-216. [ Links ]
Konkiel, S., Sutton, S and Levin-Clark, M. 2015. Myth vs. reality: Altmetrics & librarians. Paper presented at the Altmetrics15 Conference held in Amsterdam. Available from: https://docs.google.com/presentation/d/1zXF_Jsl_oCYn-kpseV4¡5n¡LWELU0thFKWEz9dJpMgk/pub?start=false&loop=false&delayms=3000&slide=id.p (1 June 2018).
Kortelainen, T and Katvala, M. 2012. "Everything is plentiful-Except attention". Attention data of scientific journals on social web tools. Journal of Informetrics, 6(4):661-668. [Online]. http://www.sciencedirect.com/science/article/pii/S1751157712000478 (11 December 2013). [ Links ]
Laakso, M., Lindman, J., Shen, C., Nyman, L and Bjõrk, B.C. 2017. Research output availability on academic social networks: implications for stakeholders in academic publishing. Electronic Markets, 27(2):125-133. [Online]. https://link.springer.com/article/10.1007/s12525-016-0242-1 (10 June 2019). [ Links ]
Lawrence, S. 2001. Free online availability substantially increases a paper's impact. Nature, 411(6837):521-521. [Online]. http://www.nature.com/nature/journal/v411/n6837/full/411521a0.html (10 August 2015). [ Links ]
Lercher, A. 2008. A Survey of attitudes about digital repositories among faculty at Louisiana State University at Baton Rouge. The Journal of Academic Librarianship, 34(5):408-415. [Online]. http://www.sciencedirect.com/science/article/pii/S009913330800102X (27 November 2013). [ Links ]
Lin, C.C and Tsai, C.C. 2011. Applying social bookmarking to collective information searching (CIS): an analysis of behavioral pattern and peer interaction for co-exploring quality online resources. Computers in Human Behaviour, 27(3):1249-1257. [ Links ]
Mangan, K. 2012. Social networks for academics proliferate, despite some scholars' doubts - technology - The chronicle of higher education. Chronicle for Higher Education, 29 April: 1. [Online]. http://chronicle.com/article/Social-Networks-for-Academics/131726/ (27 November 2013).
Malone, T. & Burke, S. 2016. Academic librarians' knowledge of bibliometrics and altmetrics. Evidence Based Library and Information Practice, 11(3): 34-49. [ Links ]
Menendez, M., Angeli, A and Menestrina, Z. 2012. Exploring the virtual space of academia. In Springer Research to Practice in the Design of Cooperative systems: Results and Open Challenges, edited by P. Dugdale, J., Masclet, C., Grasso, M.A., Boujut, J.F. and Hassanaly, P. 49-63. [Online]. http://link.springer.com/chapter/10.1007/978-1-4471-4093-1 4 (25 May 2016).
Mikki, S., Zygmuntowska, M., Gjesdal, 0.L and Al Ruwehy, H.A. 2015. Digital presence of Norwegian scholars on academic network sites--Where and who are they? PloS one, 10(11): e0142709. [ Links ]
Miles, R.A., Konkiel, S and Sutton, S. 2018. Scholarly communication librarians' relationship with research impact indicators: An analysis of a national survey of academic librarians in the United States. Journal of Librarianship and Scholarly Communication, 6(1): eP2212: 1-37. Available from: http://doi.org/10.7710/2162-3309.2212 (Accessed 31 July 2018). [ Links ]
Muscanell, N. and Utz, S. 2017. Social networking for scientists: an analysis on how and why academics use ResearchGate. Online Information Review. 41(5):744-759. [Online]. https://www.emerald.com/insight/content/doi/10.1108/OIR-07-2016-0185/full/html?af=R (10 June 2019). [ Links ]
Nicholas, D., Boukacem-Zeghmouri, C., Rodríguez-Bravo, B., Xu, J., Watkinson, A., Abrizah, A., Herman, E and Swigoh, M. 2017. Where and how early career researchers find scholarly information. Learned Publishing. 30(1):19-29. [Online]. https://onlinelibrary.wiley.com/doi/full/10.1002/leap.1087 (10 June 2019). [ Links ]
Nicholas, D., Clark, D and Herman, E. 2016. ResearchGate: Reputation uncovered. Learned Publishing. 29(3):173-182. ). [Online]. https://onlinelibrary.wiley.com/doi/full/10.1002/leap.1035 (10 June 2019). [ Links ]
Niu, X., Hemminger, B.M., Lown, C., Adams, C., Level, A., McLure, M., Powers, A., Tennant, M.R and Cataldo, T. 2010. National study of information seeking behaviour of academic researchers in the United States. Journal of the American Society for Information Science and Technology, 61(5):869-890. [ Links ]
Nolin, J. 2013. The special librarian and personalized meta-services: Strategies for reconnecting librarians and researchers. Library Review, 62(8/9): 508-524. Available from: http://www.emeraldinsight.com/doi/abs/10.1108/LR-02-2013-0015 (30 October 2013). [ Links ]
Norman, E. 2012. Maximizing journal article citation online: readers, robots, and research visibility. Politics & Policy, 40(1):1 12. [Online]. http://onlinelibrary.wiley.com/doi/10.1111/i.1747-1346.2011.00342.x/full (18 June 2015). [ Links ]
Obrien, P., Arlitsch, K., Sterman, L., Mixter, J., Wheeler, J and Borda, S. 2016. Undercounting File Downloads from Institutional Repositories. Journal of Library Administration, 56(7):854-874. [Online]. https://www.tandfonline.com/doi/full/10.1080/01930826.2016.1216224 (10 June 2019). [ Links ]
Persson, S. and Svenningsson, M. 2016. Librarians as advocates of social media for researchers: A social media project initiated by Linkõping University Library, Sweden. New Review of Academic, 22(2-3): 304-314. Available from: http://doi.org/10.1080/13614533.2016.1184693 (2 August 2016). [ Links ]
Pradhan, P. and Dora, M. 2015. Altmetrics: An alternative view-point to assess scholarly research impact. International Journal of Information Dissemination and Technology, 5(2): 123-130. Available from: http://search.proquest.com/openview/08d24c4a7c60ed3421d5a0b89a47a0f5/1?pq-origsite=gscholar (2 August 2016). [ Links ]
Redden, C.S. 2010. Social bookmarking in academic libraries: Trends and applications. The Journal of Academic Librarianship, 36(3):219-227. [ Links ]
Renn, O. 2016. Librarians as change agents in navigating the new publishing and open science terrain. Library Connect. Available from: https://libraryconnect.elsevier.com/articles/librarians-change-agents-navigating-new-publishing-and-open-science-terrain (10 December 2018).
Reed, K., McFarland, D and Croft, R. 2016. Laying the groundwork for a new library service: Scholar-practitioner & graduate student attitudes toward altmetrics and the curation of online profiles. Evidence Based Library and Information Practice, 11(2): 87-96. [ Links ]
Repanovici, A. 2010. Measuring the visibility of the universities' scientific production using scientometric methods. In The 6th WSEAS/IASME International Conference on Educational Technologies, (EDUTE'10), 123-128. [Online]. http://www.wseas.us/e-library/conferences/2010/Tunisia/EDUTE/EDUTE-22.pdf (10 August 2015).
Roemer, R.C. and Borchardt, R. 2012. From bibliometrics to altmetrics. College & Research Libraries News, (November):596-600. [Online]. http://crln.acrl.org/content/73/10/596.sh. (10 June 2019).
Suiter, A.M. and Moulaison, H.L. 2015. Supporting scholars: An analysis of academic library websites' documentation on metrics and impact. The Journal of Academic Librarianship, 41(6): 814-820. [ Links ]
Swan, A. and Carr, L. 2008. Institutions, Their Repositories and the Web. Serials Review. 34(1):31 -35. [Online]. http://www.sciencedirect.com/science/article/pii/S0098791307001542 (27 November 2013). [ Links ]
Tenopir, C., Christian, L., Anderson, R., Estelle, L., Allard, S and Nicholas, D. 2016. Beyond the Download: Issues in Developing a Secondary Usage Calculator. Qualitative and Quantitative Methods in Libraries (QQML), 5:365-377. [ Links ]
Thompson, E.E. and French, S. 2016. Pimp my profile and the researcher profile health check: Practical, individualised researcher support initiatives co-created by library and faculty. Proceedings of the ALIA National Conference held in Adelaide, Australia. Available from: https://eprints.qut.edu.au/98649/ (Accessed 2 August 2017).
Van Noorden, R. 2013. Twitter buzz about papers does not mean citations later. Nature News. 1-2. [Online]. http://www.nature.com/news/twitter-buzz-about-papers-does-not-mean-citations-later-1.14354. (10 June 2019).
Waltman, L. 2016. A review of the literature on citation impact indicators. Journal of Informetrics. 10(2):365-391. [Online]. https://ideas.repec.org/a/eee/infome/v10y2016i2p365-391.html (10 June 2019). [ Links ]
Ward, J., Bejarano, W and Dudas, A. 2015. Scholarly social media profiles and libraries: A review. LIBER Quarterly, 22(4):174-204. [Online]. http://liber.library.uu.nl/index.php/lq/article/view/9958/10504 (12 May 2015). [ Links ]
Yeong, C.H. and Abdullah, B.J.J. 2012. Altmetrics: The right step forward. Biomedical Imaging and Intervention Journal, 8(3): 1-2. [ Links ]
Zohoorian-Fooladi, N. and Abrizah, A. 2014. Personifying academic librarians' social media presence. Malaysian Journal of Library & Information Science, 19(3): 13-26. [ Links ]
Received: 10 November 2019
Accepted: 24 February 2022

