


Services on Demand
Article
 English (pdf)
 Article in xml format
 Article references
Indicators

Related links
-
 Cited by Google
 -
 Similars in Google
Share

 Permalink
Journal of the Southern African Institute of Mining and Metallurgy
On-line version ISSN 2411-9717
Print version ISSN 2225-6253
J. S. Afr. Inst. Min. Metall. vol.124 n.3 Johannesburg Mar. 2024
http://dx.doi.org/10.17159/2411-9717/3042/2024
COMPUTATIONAL MODELLING PAPERS
Prediction of burden distribution and electrical resistance in submerged arc furnaces using discrete element method modelling
S.J. BaumgartnerI, III; Q.G. ReynoldsII, III; G. AkdoganIII
ISamancor Chrome, Dikwena Chrome, South Africa
IIMintek, South Africa
IIIStellenbosch University, South Africa. ORCID: G. Akdogan: http://orcid.org/0000-0003-1780-4075
SYNOPSIS
A computational model of a submerged arc furnace (SAF) used in the production of ferrochrome is presented. The model's intended use is to investigate the extent to which intrinsic and extrinsic properties of the raw materials affect burden distribution and electrical resistance within the furnace. The model is built on the discrete element method and calculates the mechanical interactions of particle distributions resulting from the flow motion of typical raw materials used in the smelting of chromium ore. This model excludes the effects of thermodynamics, furnace chemistry, and heat transfer. It illustrates how the consumption of materials (chromite pellets, flux, and reductant) is affected by changes in electrode length, reductant fractions, and reductant sizing and density during the formation of a reductant bed. The resistance calculation algorithm developed by Mintek was applied to construct networks developed from particle contacts, which can quantitatively generate estimates of the electrode-to-electrode and electrode-to-bath electrical conduction conditions.
Keywords: submerged arc furnace, resistance, ferrochrome, segregation.
Introduction
Ferrochrome is an essential source of elemental chromium for the production of stainless steel, to which it imparts increased corrosion resistance, hardness, and toughness. South Africa is a primary producer of ferrochrome and possesses 72-80% of the world's total chromite ore reserves (Beukes, Dawson, and van Zyl, 2010). The industry contributes approximately R42 billion in GDP per annum and employs over 200 000 people directly or indirectly (Africa Mining IQ, 2019). Recently, the ferrochrome industry has been placed under severe strain due to increasing electricity tariffs and a decaying electrical infrastructure that poses a threat to the sustainability of high-energy processes.
Researchers such as Kajiwara, Jimbo, and Sakai, (2006) and Shi et al. (2016) have studied burden distribution in blast furnaces used in the steel industry and developed prediction models that have been used in the understanding and optimization of blast furnace operations. However, these models failed to consider the influence of raw material properties on the charge, which would influence in the burden distribution due to the changes in the properties of the raw materials used (Mio et al., 2020). In addition, Mio et al. (2020) included the specifications of the equipment used to dictate burden behaviour and developed these models using discrete element modelling (DEM). The study by Mio et al. (2020) investigates the influence of particle segregation during the charge flow within a blast furnace. The authors found that DEM can analyse in detail the behaviour of the charge particles, and can inform researchers on the behaviour of the charge layers and time series changes that would be impossible to observe via traditional experimental methods. In addition, the use of DEM in blast furnace studies clarifies control mechanisms and the influence of design operations on the process (Mio et al., 2020). Mio et al. acknowledge the influence of material properties on the dynamics of segregation and advise that these findings from studies be compared against actual process phenomena.
Considering the similarities in burden flow between blast furnace and SAF operations, along with the lack of studies specifically conducted on SAFs for ferrochrome production regarding material flow and resulting segregation, it was decided to investigate the behaviour of the burden using DEM modelling. Mio et al. (2020) effectively contrasted DEM simulations with real blast furnace performance and subsequently implemented their findings in real blast furnace operations. In addition, the DEM simulations were conducted to analyse the behaviour of the burden in a ferrochrome furnace. This study also considered the electrical behaviour of the burden, taking into account various properties of the raw materials.
Model description
DEM governing equations and force models
Both the translational and rotational motion of granular particles can be defined by Newton's second law of motion in combination with the force-displacement correlation at the points of contact between particles (Wei et al., 2019; Zhao et al., 2015). An appropriate time step of 1 x 10⁻⁴ seconds was adopted for the simulations. The time step depends on the damping coefficient, particle mass, and normal stiffness and is defined by Equation [1]:
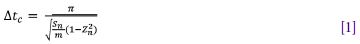
where Δtc is the critical time step (s), Sn is the normal stiffness (N/m), m represents the mass of the particle (kg), and Zn is a dimensionless coefficient.
Software implementation
LIGGGHTS-PUBLIC* (CFDEMresearch GmbH, 2022), which is available as an open-source computational software package, was used as the modelling tool for the present work. Reynolds et al. (2021) describe the model as based on the time-step of soft sphere algorithms and it can introduce a broad range of friction and collision force models. An advantage of using LIGGGHTS-PUBLIC* is that the software allows flexibility in the application thereof and the implementation of other models as subcomponents.
To perform the electrical resistance calculations based on the particle assemblies resulting from the DEM modelling, Python (Python Software, 2022) was used to process the electrical contact network algorithm. The construction and manipulation methodology was implemented using the Network X package (Network X, 2022). The SciPy package (SciPy, 2022) was used to optimize and increase the efficiency of the matrix algorithm of the linear system, and to speed up the resistance calculation, parallel computing was exploited through the mpi4py Python library (mpi4py, 2021).
The use of the resistance calculation algorithm
The methodology employed in this study, to determine the resistance of the cases , is proprietary to Mintek and is known as the resistance calculation algorithm (RCA) (Reynolds et al., 2021).
Utilizing the RCA, the resistance between the three electrodes and the surrounding burden is estimated. At each time step, DEM simulations yield the particle assemblies, which are defined as the coordinates of the individual particles within the array and the number of distinct surfaces that some of the particles make contact with.
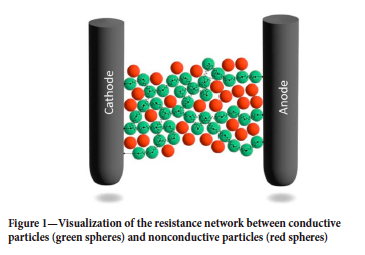
The algorithm takes into account pairings of particles that are in mutual contact within the given system. In the current study, the collection of paired particles was arranged to exclude any interaction with nonconductive particles, including flux and pellets (sintered and pelletized chromite concentrate). The remaining sets of particle pairings in the contact network are utilized to graphically construct a contact network by constituting nodes as edges on the graph. The resistance network between a pair of electrodes and conductive and nonconductive particles is depicted conceptually in Figure 1.
Thereafter, the graphed data is analysed for connections and contacts between the cathode and anode surfaces, and where there are legitimate relationships, the data is processed to determine the resistance network. The resistance network is structurally identical to the graph generated for the contact networks; however, in this case each edge is represented by the electrical resistance of each pair of particles. Thereafter, Kirchoff's Circuit laws are used to convert the resistance network into a matrix equation containing the voltage of each particle node, which is finally solved using linear algebra methodology.
When particles touch each other, they have a shared surface, which allows for the calculation of the electrical resistance between the pairs of particles. This is accomplished by integrating the combination throughout the entirety of the particle pair's volume, starting at the centre of each particle and extending to the point where they make contact. Figure 2 depicts the concept by showing the geometric configuration of spherical particles i and j. Each particle has a radius of ri and rj, respectively, and separation is defined as rij < ri + rj. aij represents the shared radius between the two particle.
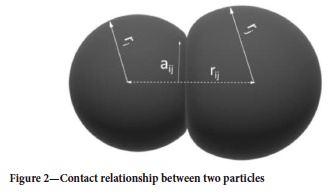
The current density vectors are assumed to be parallel to the axis where all the points are in contact between the particle pair, thus the net resistance Ωij between the particle centres is defined by Equation [2] below. The normal force is implicitly accounted for by the rij; however, the normal force contributing to the interparticle resistance is not accounted for in the equation.
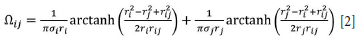
Here the electrical conductivities of the two particles, i and j, are represented by σi (S/m) and σj (S/m), respectively (Reynolds et al., 2021).
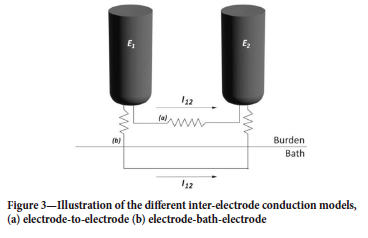
Two electrical burden conduction models were used to determine the inter-electrode resistances of the SAF DEM model simulation outcomes for various model situations. One model examines the direct conduction between electrodes, as depicted in Figure 3a. The other model analyses conduction from the electrode through the molten phases, slag, and alloy, and then back to the neighbouring electrode, bypassing the burden, as shown in Figure 3b. To measure the resistance of the two models, the electrode surfaces were designated as the cathode, while any other surface was selected as the anode within the resistance calculation algorithm (Reynolds et al., 2021).
Particle consumption model
The particle consumption region in the DEM simulation can be found in one of three areas in the furnace: directly below the electrode tip, in the intermediate zone between the charge and the liquid phase (consisting of slag and alloy), or in the molten slag phase. Figure 4 depicts this configuration. Using the information given:
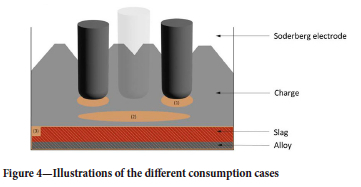
(1) Indicates the region where particles are consumed below the electrode tip.
(2) the area within the furnace where partial slag consumption occurs, situated in the intermediate region.
(3) Illustrates the entire area of consumption, encompassing the entirety of the molten phase, including slag and alloy phases.
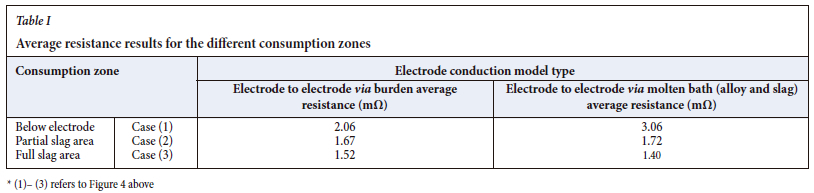
A comparative analysis was conducted to identify the best realistic consumption scenario that closely mimics the typical behaviour found in an industrial furnace. This investigation entailed assessing the resistances between electrode and electrode, as well as between the electrode and bath, for all three scenarios. Furthermore, the study examined the rates of consumption and their corresponding patterns for these three scenarios to determine the conditions that are most likely to imitate the consumption patterns of raw materials within a SAF, with a specific emphasis on the flow of burden. The model that best matches the observed furnace consumption behaviour was chosen based on the comparative results acquired during the post-processing of the data.
The post-processing results of the DEM electrode resistances for the three cases of the particle consumption zones are shown in Figure 5, where the electrode-to-electrode resistance through the burden and the electrode resistance through the molten bath,are shown.
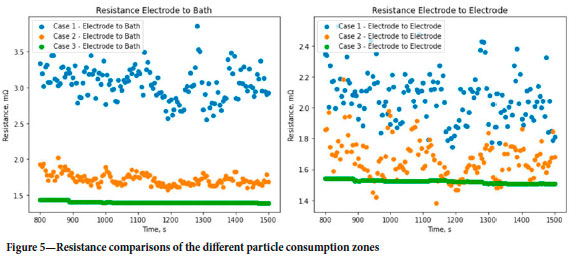
The cumulative duration of all simulations (the total runtime) was 2000 seconds, during which the initial conditions reached a pseudo-steady dynamic state (or in cases 1 and 2, a state of fluctuating stability). Table I provides a thorough analysis of the average resistance results for every model and occurrence throughout the pseudo-steady dynamic state.
If the model had considered the resistances related to the slag and metal, the results would have indicated that the conduction model between the electrodes was mostly affected by conduction through the molten bath. In this situation, the resistance value would have been significantly reduced in comparison to the conduction model, as the current flows from one electrode to another through the burden (Reynolds et al., 2021). However, in the present study the conduction caused by the slag and metal is ignored. The main objective of this research is to examine the material segregation and resistance that may be completely attributed to the burden. The expected result of the inter-electrode conduction for both models is anticipated to be similar. This is grounded on the consistency of the material composition across the entire model, along with the measurements of the distance between the electrode tip and the molten bath (1.50 m) and the electrode pitch radius (2.25 m). The most closely related results for this condition are found in the case of a complete slag consumption zone (case 3), where the resistances from electrode to electrode via the burden and through the molten bath are measured at 1.52 mΩ and 1.40 mΩ, respectively.
To eliminate the inclusion of material thermodynamics and heat transmission, it is beneficial to utilize a technique that effectively accommodates the consumption zone, hence ensuring the validity of the present study.
Results and discussion
Base case model
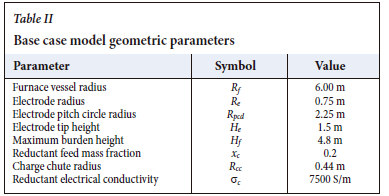
The geometry of the generic model was based on the design parameters of a common mid-sized industrial SAF used in South Africa, which are summarized in Table II.
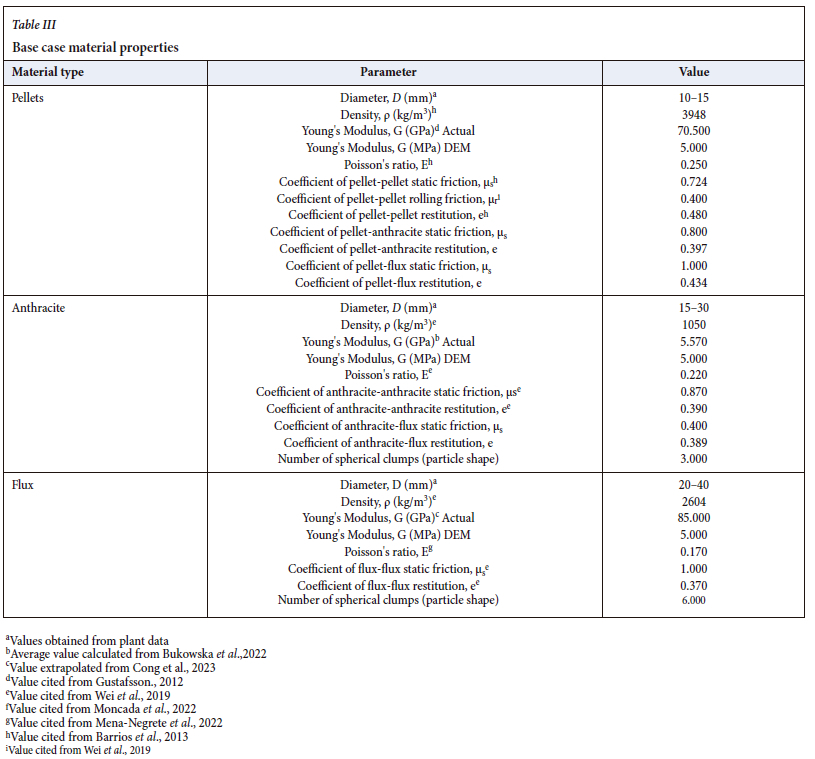
The electrical conductivity of the reductant was derived from studies by Surup et al. (2020) and Nhiwatiwa and Cromarty (2021). Consult Table III for the particle properties and parameters, which include the calibrated parameters.
Figure 6 is a graphical depiction of the simulation model's geometry, illustrating the arrangement of the charge chutes and electrode layout.
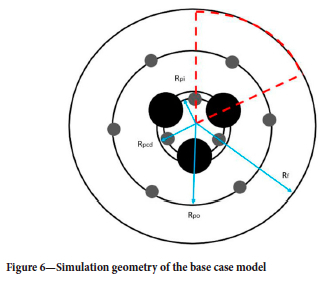
Figure 7 provides a 360 deg view of the base case furnace DEM model profile. An essential element in the model is the placement of the electrode tip, which presents challenges in the SAF environment due to the several variables that impact the electrical performance of the electrodes and the alignment of the tip with the metal heel. The variables being considered encompass characteristics such as burden resistance, slag composition, and tapping cycles, along with other pertinent parameters. Various endeavours have been made to employ data and methodologies, such as electrode hydraulic pressure, data analysis, modelling, and acoustics, to precisely ascertain the length and positioning of the electrode tip. Nevertheless, this endeavour is additionally impeded by numerous external and internal factors, as well as complex interactions involving mechanical, electrical, and chemical components.
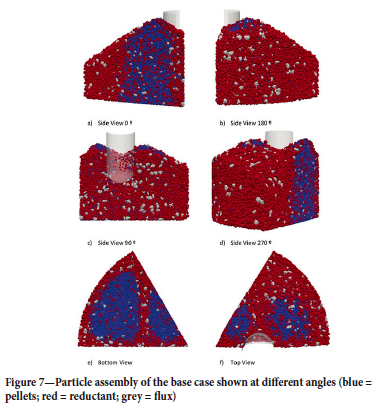
Yoneka et al., (1981) investigated the reduction burden of ferroalloys and highlighted the significance of maintaining an ideal position for the electrode tip, particularly in larger furnaces. They state that the electrode tip has a crucial function in controlling and improving furnace operations. Hence, it was imperative in this study to determine the optimal parameters for the baseline scenario, which could then be compared to the actual furnace values of a system that conforms to design criteria. The electrode tip position was evaluated by utilizing operational expertise and employing the information from design specifications provided in confidential documentation. The electrode tip height, as measured from the metal heel, was determined to be 1.5 m.
In its initial state the model volume is empty, and it is gradually filled with particles introduced through the charge chutes. The total number of particles introduced into the DEM simulation ranged between 180 000 and 200 000. These particles enter the furnace and are then continuously generated, with the rate of supply being directly proportional to the rate at which the burden is consumed. The models were simulated for a duration of 650 seconds until stable pseudo-steady dynamic conditions were achieved. Similarly, Reynolds et al. (2021) assumed that the electrodes exhibit symmetry. To make the computational model feasible, the size of the region was scaled down by a factor of 5.
A summary of material properties determined and used in the base case model is given in Table III.
Effect of electrode length on model behaviour
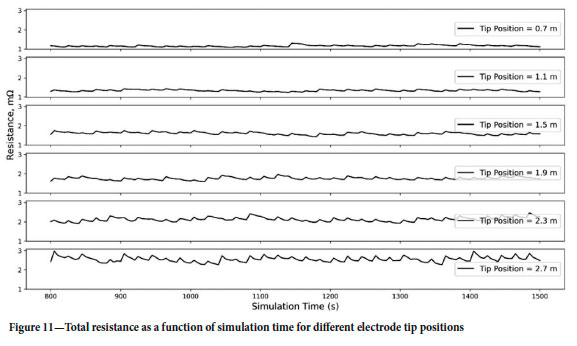
A pivotal control mechanism in ferrochrome SAF furnaces and one that efficiencies depend upon is the electrode positions. In industrial ferrochrome furnaces, the electrode position is controlled by automation and relates to the electrodes' secondary current and resistance. Therefore, studying and understanding the impact that electrode tip position relative to the metal heel has on the burden structure and the electrical behaviour is of importance to improve electrode control on an industrial scale to increase alloy throughput, provide consistent and even power distribution, and allow for consistent and stable electrode penetration to maintain optimum metallurgical conditions for improved smelting. DEM simulations were run where the electrode tip position relative to the metal heel was varied between static positions ranging between 500-2900 mm, while keeping all other parameters in the model constant as per the base case model in Tables II and III. The comparison simulations are provided in Figure 8.
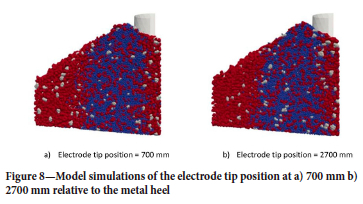
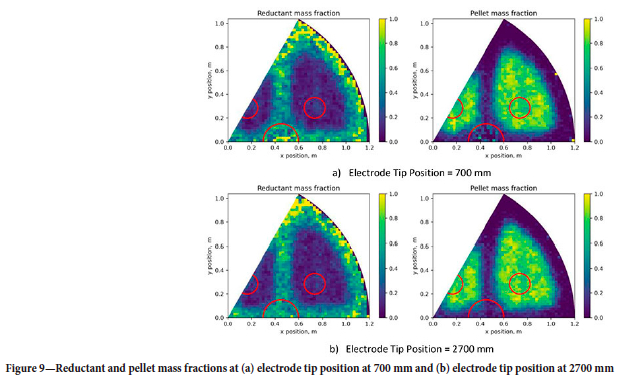
A notable observation is the consistent distribution and separation of the burden with electrode tip positions 700 mm and 2700 mm from the heel. While the position of the electrode may vary, the composition of the raw materials remains constant. This is because the characteristics of the raw materials remain consistent regardless of the electrode tip position. Although the degree to which this regularity in the burden distribution is visually apparent (Figure 8) may be limited, a more precise demonstration of this consistency has been conducted. This involved directly calculating the mass fractions of the reductant and FeCr pellets at different positions within the simulated areas. The resulting quantitative data is visually presented in a two-dimensional format in Figure 9, providing a more precise representation of the level of consistency. The red circles in the figure indicate the positions of the electrodes and the feed ports. The representation consists of a composite of all the planes through the burden .
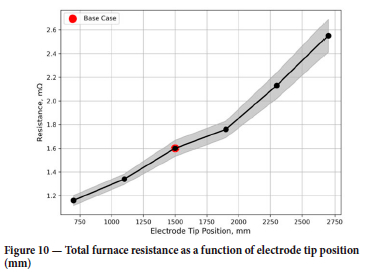
Figure 10 demonstrates a clear trend: as the electrode tip* location increases, the resistance also increases. The connection between 1250 and 1900 mm demonstrates a variance in the trend, as seen in Figures 10 and 11. However, it may be argued that the values within this range are in the expected range of resistance values. The anomaly is most likely caused by approximations made in the model, leading to numerical noise. Specifically, there may be a disproportionality between the compact model, designed for computing efficiency, and the effects of physical contact regions.
Effect of change in reductant fractions on model behaviour
To investigate the impact of varying reductant concentrations on the flow characteristics and electrical resistance in different scenarios, simulations were conducted with reductant fractions ranging from 10% to 40% of the total mass. All other parameters were held constant, aligning with the base case model, as outlined in Tables II and III.
The fraction range chosen to simulate the reductant fractions was purely for experimentation purposes to observe and study the behaviour of resistance of the reductant contribution in a comprehensive manner.
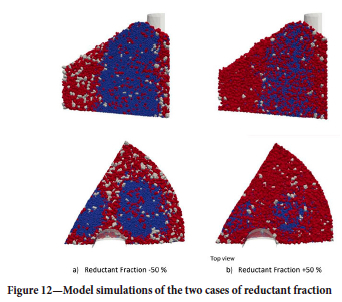
Visualizations of the particle assemblies for reductant fractions of -50% and +50% are shown in Figure 12. An increase in the reductant fractions leads to the formation of a larger reductant bed, which will result in better contact with the electrodes, and it reduces the occurrence of the reductant depleted pockets.
The changes in the burden structure are indicated by the resistance calculation results. With a richer reductant bed, the resistance is reduced as shown in Figures 13 and 14.
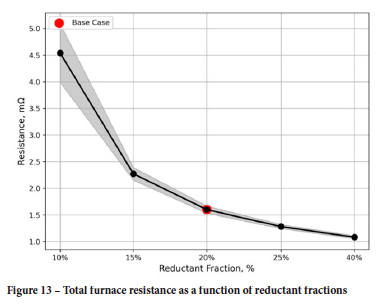
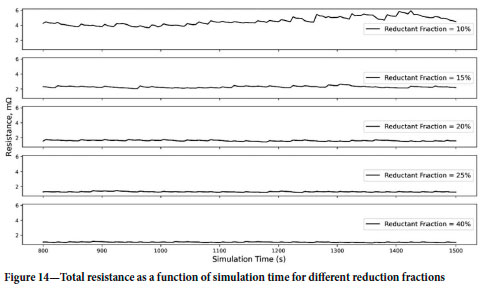
Another interesting observation is the large range in which the resistance of the furnace charge can fall when the reductant mass fraction is set between 15% and 20%. This is most likely attributable to a more randomized and discontinuous stable reductant bed.
Effect of change in reductant sizing on model behaviour
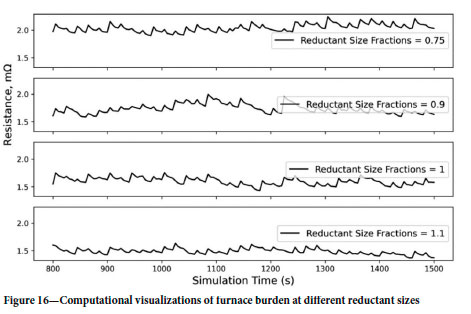
The effect of reductant particle size on the bed resistance is summarized in Figures 15 and 16. There is a notable correlation between electrical resistance and the sizing of reductant particles, with an increase in reductant size resulting in a decrease in furnace resistance.
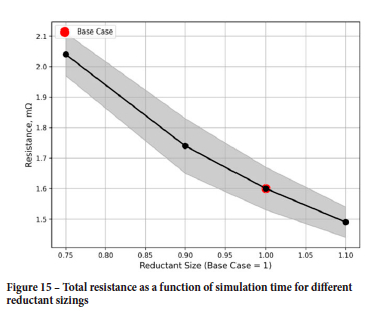
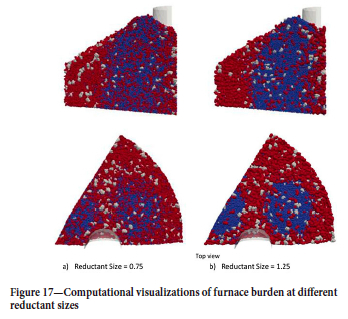
Visualizations of the particle assembly are shown in Figure 17 for a sizing ranging from -25% to +25% of the base case reductant size of 30 mm (base case = 1). A reduction in the reductant sizing results in a more even distribution of reductant particles with distinct pellet voids interrupting the continuous electrical paths between the reductant particles, thereby imparting a high resistance to the bed. Comparing the case with +25% larger reductant sizing, segregation of the reductant particles towards the contours of the electrodes and the delta region between the electrodes (the area to the left of the visualizations) is dominant and the electrical paths formed between the reductant particles between the electrodes and across the bed are concentrated, leading to a lower bed resistance.
The above observation is significant for industrial furnace operations as the reductant sizing is a parameter that can be manipulated to suit the required resistance of a reductant bed for optimum efficiencies.
Effect of change in reductant density on model behaviour
An investigation was conducted to examine the influence of density on the segregation of particles and the resulting resistance.
The findings indicate a significant correlation between density and resistance, with resistance values ranging from 0.90 mΩ to 2.67 mΩ with increasing density. This suggests that changes in reductant density have a impact on furnace resistance, as illustrated in Figure 18.
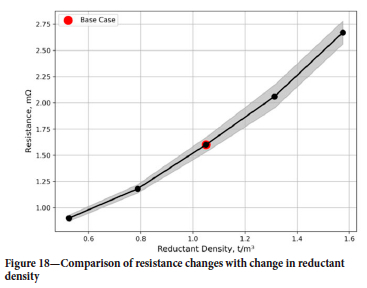
The observed phenomenon can be ascribed to the extent of segregation, which intensifies with increasing density. as reductant particles of lower density tend to aggregate prominently on the surface of the furnace simulation, as illustrated in Figure 19c. Concurrently, it is noteworthy that particles of lower density contribute to a more uniform dispersion of particles close to the electrode and beneath it, as depicted in Figure 19a. In contrast, reductant particles of higher density form a less concentrated zone, leading to a greater degree of segregation among FeCr pellets, as evident in Figure 19d. Specifically, higher-density reductant particles exhibit increased concentration, featuring well-defined voids amid FeCr pellets and flux particles, as portrayed in Figure 19b.
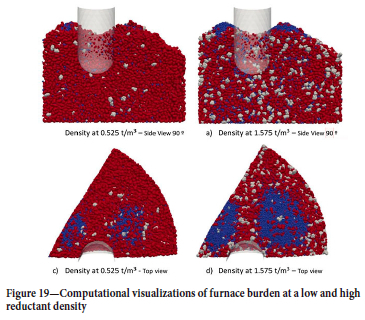
These findings align with the conclusions drawn by Gray and Ancey (2015), whose investigations revealed a prevalence of regions rich in the lowest density particles near the free surface, with a notably limited presence of particles from other species.
A discernible trend emerges towards the base, wherein the concentration of the lightest species decreases, while that of the highest-density particles undergoes a corresponding increase - a correlation congruent with the empirical observations made in the present study.
Conclusion
This study aimed to develop models for understanding solid particle flow behaviour in a submerged arc furnace, with a focus on establishing relationships between material properties and electrical resistance. The discrete element method (DEM) was employed for investigating furnace burden properties, with accurate results dependent on appropriate parameter values. Calibration involved direct measurements, cold flow experiments, and bulk calibration methodology, using the angle of repose as a primary foundation.
Following the establishment of key parameters, a scaled-down DEM model was developed to simulate a submerged arc furnace (SAF) used for smelting ferrochrome (FeCr) ores. This model acts as a foundational reference for conducting parametric studies. The study revealed a complex correlation between electrical properties and raw material attributes, establishing a clear relationship between reductant size and furnace resistance. A 27% increase in resistance was observed with an increase in sizing, aligning with prior research findings. Altering the reductant charge fraction led to a 76% change in resistance. The study also explored the impact of particle morphologies on segregation and resistance, aligning with prior observations. Increased reductant density resulted in a 66% resistance increase.
Future work
The current research will be enhanced by investigating several factors. Firstly, the effects of intrinsic material properties, such as Young's modulus, the coefficient of friction, and the restitution coefficient, will be examined. Secondly, the study will explore the impact of furnace geometry. This includes analysing the pitch circle diameter, electrode diameter, and furnace diameter. These aspects will be evaluated for their influence on particle segregation in SAFs and their subsequent impact on electrical resistance relationships.
Acknowledgements
This paper is published by permission of Mintek and Samancor Chrome Ltd. The authors acknowledge the Centre for High Performance Computing (CHPC), South Africa, for providing computational resources.
The authors would like to thank the following institutions, companies, and individuals for their contributions and support:
> Samancor Chrome for providing the authors with operational data
> Stefan Swanepoel and Markus Erwee from Samancor Chrome for their technical guidance and support.
References
Adema, A., Yang, Y., and Boom, R. 2009. Coupled DEM-CFD modeling of the ironmaking blast furnace. Proceedings of the Seventh International Conference on CFD in the Minerals and Process Industries, CSIRO, Melbourne, Australia, 9-11 December 2009. 6 pp. https://www.cfd.com.au/cfd_conf09/PDFs/138ADE.pdf [ Links ]
Africa Mining IQ. 2019. Chrome mining in South Africa. https://www.projectsiq.co.za/chrome-mining-in-south-africa.htm [accessed 22 February 2020], [ Links ]
Amberger, S., Freidl, M., Goniva, C., Pirker, S., and Kloss, C. 2012. Approximation of objects by spheres for multisphere simulations in DEM. Proceedings of the European Congress on Computational Methods in Applied Sciences and Engineering, Vienna, 10-14 September. Vienna University of Technology. [ Links ]
Barrios, G.K.P., De Carvalho, R.M., Kwade, A., and Tavares, L.M. 2013. Contact parameter estimation for DEM simulation of iron ore pellet handling. Powder Technology, no. 248. pp. 84-93. https://doi.org/10.1016/j.powtec.2013.01.063 [ Links ]
Baumgartner, S.J., Reynolds, Q.G., Bergmann, C., Akdogan, G., and Coetzee, C.J. 2022. Toward discrete element modelling of material flow in submerged arc furnaces. Proceedings of APCOM 2021. pp. 205-214. [ Links ]
BenSaïda, A. 2023. Shapiro-Wilk and Shapiro-Francia normality tests. MATLAB Central File Exchange. https://it.mathworks.com/matlabcentral/fileexchange/13964-shapiro-wilk-and-shapiro-francia-normality-tests?tab=reviews [accessed 10 November 2023]. [ Links ]
Beukes, J.P., Dawson, N.F., and van Zyl, P.G. 2010. Theoretical and practical aspects of Cr(VI) in the South African ferrochrome industry. Journal of the Southern African Institute of Mining and Metallurgy, vol. 110, no. 12. pp. 743-750. [ Links ]
Blender Software. 2023. OpenCV. https://www.blender.org/ [accessed 15 August 2023]. [ Links ]
Bukowska, M., Kasza, P., Moska, R., and Jüreczka, J. 2022. The Young's Modulus and Poisson's Ratio of hard coals in laboratory tests. Energies, vol. 15. p. 2477. https://doi.org/10.3390/en15072477 [ Links ]
CFDEMresearch GmbH. 2022. LIGGGHTS open source discrete element particle simulation code. https://www.cfdem.com/liggghts-open-source-discrete-element-method-particle-simulation-code [accessed 30 January 2023]. [ Links ]
Chakrabarty, A., Basu, S., Nag, S., Ghosh, U., and Patra, M. 2021. Model study of centre coke charging in blast furnace through DEM simulations. ISIJ International, vol. 61. pp. 782-791. https://doi.org/10.2355/isijinternational.ISIJINT-2020-498 [ Links ]
Coaplen, J., Stronge, W.J., and Ravani, B. 2004. Work equivalent composite coefficient of restitution. International Journal of Impact Engineering, vol. 30, no. 6. pp. 581-591. https://doi.org/10.1016/j.ijimpeng.2003.10.038 [ Links ]
Coetzee, C.J. 2016. Calibration of the discrete element method. Powder Technology, no. 297. pp. 50-70. https://doi.org/10.1016/j.powtec.2016.04.003 [ Links ]
Cong, R., Yang, R., Li, G., Hüang, Z., Gong, Y., Jing, M., and Lu, M. 2023. Geomechanical properties of thinly interbedded rocks based on micro- and macro-scale measurements. Rock Mechanics and Rock Engineering, vol. 56. pp. 1-19. https://doi.org/10.1007/s00603-023-03360-w [ Links ]
Dhainaut, M. 2004. Simulation of the electric field in a submerged arc furnace. Proceedings of INFACONX, Cape Town, South Africa, 1-4 February 2004. pp. 605-613. https://www.pyrometallurgy.co.za/InfaconX/079.pdf [ Links ]
Dijs, H.M. 1979. A laboratory investigation of reducing agents for use in the electric smelting industry. National Institute for Metallurgy, Randburg, South Africa. [ Links ]
idem, EA. 2008. Electrical resistivity of coke beds. Doctoral thesis, Norwegian University ofScience and Technology. http://ntnu.diva-portal.org/smash/get/diva2:132857/FULLTEXT01 [ Links ]
Eidem, P.A., Tangstad, M., and Bakken, J.A. 2007. Measurement of material resistivity and contact resistance of metallurgical coke. Proceedings of INFACON XI: Innovations in the Ferroalloys Industry, New Delhi, India, 18-21 February 2007. Indian Ferro Alloy Producers' Association. pp. 561-571. [ Links ]
EiDEM, P.A., Tangstad, M., and Bakken, J.A. 2008. Determination of electrical resistivity of dry coke beds. Metallurgical and Materials Transactions B, vol. 39. pp. 7-15. https://doi.org/10.1007/s11663-007-9105-7 [ Links ]
EiDEM, P.A., Runde, M., Tangstad, M., Bakken, J.A., Zhou, Z.Y., and Yu, A.B. 2009. Effect of contact resistance on bulk resistivity of dry coke beds. Metallurgical and Materials Transactions B, vol. 40. pp. 388-396. doi: 10.1007/s11663-009-9235-1 [ Links ]
EiDEM, P.A., Tangstad, M., Bakken, J.A., and Ishak, R. 2010. Influence of coke particle size on the electrical resistivity of coke beds. INFACON XII: Proceedings of the Twelfth International Ferroalloys Congress, Helsinki, Finland, 6-9 June 2010. Outotek Oyj. pp. 349-358. [ Links ]
Gray, J. and Ancey, C. 2015. Particle-size and -density segregation in granular free-surface flows. Journal of Fluid Mechanics, no. 779. pp. 622-668. doi: 10.1017/jfm.2015.438 [ Links ]
Gustafsson, G. 2012. Mechanical characterization and modelling of iron ore pellets. PhD dissertation, Luleâ Tekniska Universitet. https://urn.kb.se/resolve?urn=urn:nbn:se:ltu:diva-17284 [ Links ]
Al-Hashemi, H.M.B. and Al-Amoudi, O.S.B. 2018. A review on the angle of repose of granular materials. Powder Technology, vol. 330. pp. 397-417. https://doi.org/10.1016/j.powtec.2018.02.003 [ Links ]
Hockaday, S.A.C. and Bisaka, K. 2010. Some aspects of the production of ferrochrome in pilot AC arc furnaces at Mintek. INFACONXII: Proceedings of the Twelfth International Ferroalloys Congress, Helsinki, Finland, 6-9 June 2010. Outotek Oyj. pp. 367-376. [ Links ]
Jingchun, L. 2001. Discussion of ideal smelting model of submerged-arc furnace. Infacon IX: Proceedings of the Ninth International Ferroalloys Congress, Quebec City, Canada, 3-6 June 2001. The Ferroalloys Association, Wahington, DC. pp. 121-130. [ Links ]
Kajiwara, T., Jimbo, T., and Sakai, T. 2006. Development of a simulation model for burden distribution at blast furnace top. Transactions ISIJ, vol. 23. pp. 1045-1052. [ Links ]
Kapure, G., Kari, C., Mohan Rao, M., and Raju, K.S. 2007. Use of chemical energy in submerged arc furnace to produce ferrochrome: prospects and limitations. Proceedings of INFACONXI: Innovations in the Ferroalloys Industry, New Delhi, India, 18-21 February 2007. Indian Ferro Alloy Producers' Association. pp. 165-170. [ Links ]
Krogerus, H., Lintumaa, T., and Jokinen, P. 2006. Laboratory investigations of the electrical resistivity of cokes and smelting charge for optimizing operation in large ferrochrome furnaces. Proceesings of Southern African Pyrometallurgy 2006. Jones, R.T. (ed.). South African Institute of Mining and Metallurgy, Johannesburg. pp. 309-328. [ Links ]
Mena-Negrete, J., Valdiviezo-Mijangos, O.C., Nicolás-López, R., and Coconi-Morales, E. 2022. Characterization of elastic moduli with anisotropic rock physics templates considering mineralogy, fluid, porosity, and pore-structure: A case study in Volve field, North Sea. Journal of Applied Geophysics, vol. 206. 104815. doi: 10.22201/igeof.00167169p.2021.60.4.2118 [ Links ]
Mitra, T. and Saxén, H. 2015. Discrete element simulation of charging and mixed layer formation in the ironmaking blast furnace. Computational Particle Mechanics, vol. 3. https://doi.org/10.1007/s40571-015-0084-1 [ Links ]
Mio, H. and Narita, Y. 2018. Simulation of particle behavior in charging process of blast furnace by discrete element method. Nippon Steel & Sumitomo Metal Technical Report no. 120. December 2018. https://www.nipponsteel.com/en/tech/report/nssmc/pdf/120-11.pdf [ Links ]
Mio, H., Narita, Y., Nakano, K., and Nomura, S. 2020. Validation of the burden distribution of the 1/3-scale of a blast furnace simulated by the discrete element method. Processes, vol. 8, no. 1. https://doi.org/10.3390/pr8010006 [ Links ]
Moncada, M., Betancourt, F., Rodriguez, C., and Toledo, P. 2022. Effect of particle shape on parameter calibration for a discrete element model for mining applications. Minerals, vol, 13, no. 1. 40. https://doi.org/10.3390/min13010040 [ Links ]
mpi4PY. 2022. Python bindings for MPI. https://pypi.org/project/mpi4py/ [accessed 15 January 2023]. [ Links ]
Ndiaye, B.C., Gao, Z., Fall, M., and Zhang, Y. 2021. Effect of the rolling friction on the heap formation of dry and wet coarse discs. Applied Sciences, vol. 11. 6043. https://doi.org/10.3390/app11136043 [ Links ]
NetworkX. 2022. NetworkX: Network analysis in Python. https://networkx.org/ [accessed 15 January 2023]. [ Links ]
Nhiwatiwa, J. and Cromarty, R. 2022. Evaluation of Coke Resistivity for the Manganese Alloy Market. Materials, vol. 15. 2897. https://doi.org/10.3390/ma15082897 [ Links ]
Olsen, S.E., Tangstad, M., and Lindstad, T. 2007. Production of Manganese Ferroalloys. Tapir Academic Press, Trondheim, Norway. [ Links ]
OpenCV Python. 2023. OpenCV. http://opencv-python • PyPI [accessed 15 August 2023] [ Links ]
PyMeshlab. 2023. OpenCV. https://www.meshlab.net/ [accessed 15 August 2023] [ Links ]
Python Software Foundation. 2022. Python. https://www.python.org/ [accessed 15 January 2023]. [ Links ]
Reynolds, Q., Baumgartner, S., Erwee, M., Swanepoel, S., Geldehuys, I., and Akdogan, G. 2021. Computational modelling of electrical conduction in ferroalloy furnace burdens. INFACON XVI: Proceedings of the 16th International Ferro-Alloys Congres, Trondheim, Norway, 27-29 September 2021. http://dx.doi.org/10.2139/ssrn.3926638 [ Links ]
Reynolds, Q.G. and Bisaka, K. 2013. Computational modelling of submerged-arc furnace burden behaviour. Infacon XIII: Proceedings of the Thirteenth International Ferroalloys Congress, Almaty, Kazakhstan, 9-12 June 2013. https://www.pyrometallurgy.co.za/InfaconXIII/0821-Reynolds.pdf [ Links ]
Ringdalen, E., Rocha, M., Ramos Neto, J., and Malvik, T. 2013. The high carbon ferrochromium process, reduction mechanisms. SINTEF Materials and Chemistry, Trondheim, Norway. [ Links ]
Sakia, R. 1992. The box-cox transformation technique: A review. The Statistician, vol. 41. doi: 10.2307/2348250 [ Links ]
Scikit Image. 2023. Scikit: Image processing in Python. http://scikit-image [accessed 15 August 2023]. [ Links ]
SciPy. 2022. SciPy. https://www.scipy.org/ [accessed 15 January 2023]. [ Links ]
Shi, P.Y., Zhou, P., Fu, D., and Zhou, C.Q. 2016. Mathematical model for burden distribution in blast furnace. Ironmaking & Steelmaking, vol. 43. pp. 74-81. doi: 10.1016/j.apm.2015.02.054 [ Links ]
Sithole, N.A., Rambuda, N., Steenkamp, J.D., Hayman, D.A., and Hockaday, C. 2018. Silicomanganese production at Mogale Alloys. Journal of the Southern African Institute of Mining and Metallurgy, vol. 118, no. 11. pp. 1205-1216. http://www.scielo.org.za/scielo.php?script=sci_arttext&pid=S2225-62532018001100013&lng=en&nrm=iso [ Links ]
Surup, G.R., Pedersen, T.A., Chaldien, A., Beukes, J.P., and Tangstad, M. 2020. Electrical resistivity of carbonaceous bed material at high temperature. Processes, vol. 8. 933. https://doi.org/10.3390/pr8080933 [ Links ]
Tripathi, A., Kumar, V, Agarwal, A., Tripathi, A., Basu, S., Chakrabarty, A., and Nag, S. 2021. Quantitative DEM simulation of pellet and sinter particles using rolling friction estimated from image analysis. Powder Technology, vol. 380. pp. 288-302. doi: 10.1016/j.powtec.2020.11.024 [ Links ]
Wei, H., Tang, X., Ge, Y., Li, M., Saxen, H., and Yu, Y. 2019. Numerical and experimental studies of the effect of iron ore particle shape on repose angle and porosity of a heap. Powder Technology, vol 353. pp. 526-534. [ Links ]
Wensrich, C.M. and Katterfeld, A. 2012. Rolling friction as a technique for modelling particle shape in DEM. Powder Technology, vol. 217. pp. 409-417. https://doi.org/10.1016/j.powtec.2011.10.057. [ Links ]
Wójcik, A., Klapa, P., Mitka, B., and Sladek, J. 2018. The use of the photogrammetric method for measurement of the repose angle of granular materials. Measurement, vol. 115. pp. 19-26. [ Links ]
Wolf, P.R., DeWitt, B.A., and Wilkinson, B.E. 2014. Elements of Photogrammetry with Applications in GIS. 4th edn. McGraw-Hill Education, New York. https://www.accessengineeringlibrary.com/content/book/9780071761123. [ Links ]
Yamagishi, K., Endo, K., and Saga, J. 1974. A comprehensive analysis of the furnace interior for high-carbon ferrochromium. Infacon I: Proceedings of the First International Congress on Ferro-Alloys, Johannesburg, South Africa, 22-26 April 1974. https://www.pyro.co.za/InfaconI/143-Yamagishi.pdf [ Links ]
YoNEKA, S., Harada, K., Kojima, K., and Nakagawa, K. 1981. Considerations of electric furnace dimension& dynamic operation based on research. Journal francais de l'électrothermie, vol. 1. pp. 2 9-34. [ Links ]
Yu, Y. and Saxén, H. 2012. Effect of DEM parameters on the simulated inter-particle percolation of pellets into coke during burden descent in the blast furnace. ISIJ International, vol. 52. pp. 788-796. [ Links ]
Yu, Y. 2013. The experimental and discrete element simulation studies of bell-less charging system on blast furnace. PhD thesis, Abo Akademi University, Finland. [ Links ]
Zhao, T., Dai, F., Xu, N.W., Liu, Y., and Xu, Y. 2015. A composite particle model for non-spherical particles in DEM simulations. Granuar Matter, vol. 17. pp. 763-774. [ Links ]
Zheng, C., Yao, Q., Li, X., Hudson-Edwards, K., Shan, C., Shang, X., and Li, Y. 2022. Experimental investigation of mechanical characteristics of coal samples at different drying temperatures. Drying Technology, vol. 40, no. 16. https://www.tandfonline.com/doi/abs/10.1080/07373937.2022.2060999 [ Links ]
Zhou, Z.Y., Yu, A.B., Ng, C., Standish, N., and Xie, Z. 2006. Determination of contact forces in ball mills. Powder Technology, vol. 167. pp. 69-78. [ Links ]
 Correspondence:
S.J. Baumgartner
Email: shana.baumgartner@samancorcr.com
Received: 18 Aug. 2023
Revised: 15 Jan. 2024
Accepted: 22 Jan. 2024
Published: March 2024

