


Serviços Personalizados
Artigo
 Inglês (pdf)
 Artigo em XML
 Referências do artigo
Indicadores

Links relacionados
-
 Citado por Google
 -
 Similares em Google
Compartilhar

 Permalink
Journal of the Southern African Institute of Mining and Metallurgy
versão On-line ISSN 2411-9717
versão impressa ISSN 2225-6253
J. S. Afr. Inst. Min. Metall. vol.124 no.2 Johannesburg Fev. 2024
http://dx.doi.org/10.17159/2411-9717/1528/2024
PROFESSIONAL TECHNICAL AND SCIENTIFIC PAPERS
Predicting the strength, density, and porosity of rocks from roll crusher tests
S. KahramanI; I. InceII; M. RostamiIII; B. DibavarIII
IHacettepe University, Mining Engineering Department, Ankara, Turkey. ORCID: S. Kahraman http://orcid.org/0000-0001-7903-143X
IIKonya Technical University, Geological Engineering Department, Konya, Turkey. ORCID: I. Ince: http://orcid.org/0000-0002-6692-7584
IIIGraduate School of Science and Engineering, Hacettepe University, Ankara, Turkey. ORCID: M. Rostami: http://orcid.org/0000-0001-5411-6939. B. Dibavar http://orcid.org/0000-0002-2680-4192
SYNOPSIS
The density, porosity, and strength of rocks are fundamental in the design of geo-engineering projects. Determining these properties requires the preparation of smooth core samples, which is usually impossible for soft rocks. Besides, only fragmented samples may be available in some projects. A method for predicting rock properties from rock particles such as drilling debris would therefore be useful. This study was undertaken to develop prediction equations for compressive strength (UCS), tensile strength (BTS), density, and porosity values from the crushability index (CI) obtained from rock fragments. The results showed that UCS, BTS, density, and porosity were strongly correlated with the CI. The physical characteristics and strength of rocks may be predicted with the help of the derived equations. The CI test is a valuable tool for estimating rock properties in drilling projects and in situations where core specimens are not available.
Keywords: crushability index, rock properties, roll crusher.
Introduction
Rock engineers make extensive use of the physico-mechanical characteristics of rocks in engineering projects. However, the direct measurement of these properties requires smooth-cut core samples, and the testing process is tedious and time-consuming. Therefore, indirect testing methods such as the Schmidt hammer test, point load test, block punch index test, and sonic velocity test have been applied widely to estimate rock properties, especially for pre-feasibility investigations (Kahraman, 2001; Ulusay, Gokceoglu, and Sulukcu, 2001; Altindag, 2012; Mishra and Basu, 2012; Khandelwal, 2013; Karakul and Ulusay, 2013; Azimian, Ajalloeian, and Fatehi, 2014; Singh, Kainthola, and Venkatesh, 2012; Karaman and Kesimal, 2015). However, core samples or rock blocks might not be available in some cases such as drilling projects. Hence, the prediction of rock properties from small rock fragments (i.e., drilling debris) will be helpful for practitioners.
Several researchers have tried to estimate rock characteristics using easy and practical methods performed on drilling debris (Santarelli et al., 1996; Ringstad et al., 1998; Uboldi, Civolani, and Zausa, 1999; Schei et al., 2000; Meyers et al., 2005; Mateus et al., 2007; Haftani et al., 2015). The crushability index (CI) test may be an alternative for the estimation of the characteristics of rock from such materials. The CI test was first defined by Kahraman and Toraman (2008). In the test, 500 g rock fragments at particle sizes of 19.0-9.52 mm are fed to a jaw crusher with an outlet gap of 4-8 mm. The material that passes through the crusher is screened through a 9.52 mm sieve, and the percentage of undersized material is defined as the CI. Kahraman and Toraman (2008) correlated the CI value with the Los Angeles abrasion loss value and established a good relationship between the two parameters. The predictability of CI from the Protodyakonov index was investigated by Toraman, Kahraman, and Cayirli (2010), and a high inverse correlation was established between the two variables. Kahraman, Toraman, and Cayirli (2018) defined the CI as the percentage of oversized material after crushing by a jaw crusher. They established good linear models between the CI and the unconfined compressive strength (UCS), the Brazilian tensile strength (BTS), and a brittleness concept. Köken and Özarslan (2018) proposed a compressive crushing value (CCV) test method to evaluate the crushability of hard rocks. They found strong correlations between the CCV, the UCS, the brittleness index (S20), and aggregate impact value (AIV). Comakli and Cayirli (2019) investigated the effects of textural properties of rocks on the CI value. They showed that there were strong inverse correlations between textural properties and the CI value. Recently, Comakli (2023) studied the effects of water saturation on the CI value for nine different rock types. He showed that the influence of water saturation on the CI value was different from its effects on the other mechanical rock properties.
Jaw crushers have been used in previous CI experiments. Kahraman, Toraman, and Cayirli (2018) stated that there are several factors controlling the amount of oversize generated, and therefore, influencing the CI parameter obtained by jaw crushing. The open side and closed side discharge settings of the jaw platens and eccentricity control the CI value. The shape of the fragments that are charged also affects CI. Particles with an elongated shape can pass through a jaw crusher despite being coarser than the setting. However, the aforementioned factors controlling CI are not applicable in crushing tests performed using a roll crusher. In this study, CI tests were carried out on igneous rocks using a roll crusher, and the predictability of UCS, BTS, density, and porosity based on the CI was investigated.
Sampling
Thirty-five types of rocks sampled from various sites or stone processing plants in Türkiye were used in this study. The samples included granite, granodiorite, basalt, syenite, andesite, diabase, limestone, marble, and pyroclastics. The rock types included are listed in Table I along with their properties.
Experimental studies
Physico-mechanical tests
Cylindrical specimens were cored from large boulders for the USC, BTS, density, and porosity tests. The ISRM (2007) suggested methods were followed to conduct the experiments. The UCS and BTS experiments were repeated six or seven times and the average values taken as the strength values.
Crushability index (CI) test
The crushability experiments were carried out using a laboratory-type roll crusher (Figure 1) driven by a 3 kW motor. The rolls had flat surfaces, and their diameters were 25 cm. The rotational speed of the rolls was 160 r/min.

After the coring of the blocks, the remaining pieces were utilized in the CI tests. First, the pieces were broken into small blocks using a hand hammer and charged to a laboratory jaw crusher for primary crushing. The crushed materials were fed into the roll crusher for secondary crushing. The crushed material was sieved for 60 seconds to obtain 100 g samples in the size range of 4.00-5.60 mm for the CI test. Some of the specimens ready for the tests are illustrated in Figure 2. The gap between the two rolls was set to 3 mm, and the fragments were fed slowly by hand to the roll crusher.

The fragments that passed through the crusher were sieved using a 1 mm screen size for 60 seconds, and the percentage of oversized particles was defined as the CI. The average values of the results of the experiments were accepted as the CI values.
Assessment of the experimental data
Some relationships should exist among the physico-mechanical characteristics of rocks. For this reason, a general evaluation of the data was first performed by investigating the correlation between the physico-mechanical properties identified in this study. As shown in Figure. 3, very strong correlations were found.

In Figures 3a and 3b, it is seen that the UCS and BTS values differ greatly at density values of 2.5-3.0 g/cm3. Although this may seem abnormal, it is a result of the inherent nature of rocks. There are many different types of rocks with density values ranging from 2.5 to 3.0 g/cm3. Although these rocks have the same or very similar density values, their properties such as brittleness and modulus of elasticity differ, and their strength and CI values also vary accordingly. Burkhardt, Kim, and Nelson (2018) found the same to be true for the UCS-density and BTS-density relationships, based on extensive data (3900 cases for UCS, 490 for BTS). In fact, it has been shown that the strength of gypsum samples with almost the same density values can vary between 4 MPa and 42 MPa.
First, a simple regression analysis was performed to derive the prediction equations for rock properties. The CI was correlated with the strength, density, and porosity parameters. Very strong exponential relationships were established between CI and both strength parameters (Figures 4, 5). The more the CI value increased, the more the UCS and BTS increased. The formulae of the simple regression curves and the correlation coefficients (r) were as follows:
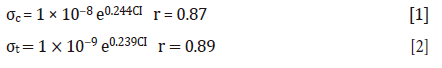


where, σc is the UCS (MPa), σt is the BTS (MPa), and CI is the crushability index (%).
The CI value was strongly correlated with density (Figure 6). The correlation was represented by a linear equation. The equation of the line and the correlation coefficient (r) were as follows:


where ρ is the density and CI is the crushability index (%).
The CI value was inversely correlated with the porosity (Figure 7). The relationship was linear, with a good correlation coefficient. The equation of the line and the correlation coefficient (r) were


where n is the porosity (%), and CI is the crushability index (%).
A multiple regression analysis was also performed with the aim of developing stronger equations than the simple regression equations. The CI, density, and porosity values were incorporated into the regression analysis to construct the prediction formulae for UCS and BTS. The developed equations were as follows:

The correlation coefficients of the multiple regression equations were closely similar to those of the simple regression formulae. For this reason, the simple regression equations are recommended for their simplicity.
Validation of the derived equations
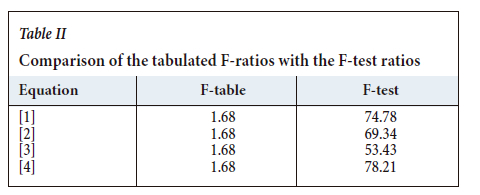
Equations [1-4] had strong correlation coefficients. However, a strong correlation coefficient does not always indicate a valid model. Student's t-test and the F-test are common methods used for the validation of a regression equation. For the t-test, the variables should have a normal distribution. The histogram analysis showed that the variables had a non-normal distribution as shown in the examples in Figures 8 and 9. Therefore, the t-test was not carried out.


The analysis of variance method can be used for checking the significance of regressions. The confidence intervals were selected as 95% in the analyses. In the F-test, when the test values of the F-ratios are greater than the critical F-ratio found in the standard table, the null hypothesis is rejected, suggesting a significant correlation between the two variables. The calculated F-ratios (F-test) were greater than the critical ratios of F (Table II). For this reason, it may be stated that the constructed formulae are valid.
Conclusions
The experimental data for the 19 different igneous rocks was assessed to investigate the predictability of UCS, BTS, density, and porosity from CI. Very good exponential relationships were established between CI and the strength parameters. Good relationships were also determined between CI and both density and porosity. In conclusion, the UCS, BTS, density, and porosity values of rocks can be predicted from their CI values. The CI test is particularly valuable for drilling projects and situations where block samples are not available for the preparation of cores. However, it should not be forgotten that the results obtained may vary depending on the crusher characteristics.
Conflict of interest
On behalf of all authors, the corresponding author states that there is no conflict of interest.
References
Altindag, R. 2012. Correlation between P-wave velocity and some mechanical properties for sedimentary rocks. Journal of the Southern African Institute of Mining and Metallurgy, vol. 112. pp. 229-237. http://www.scielo.org.za/pdf/jsaimm/v112n3/14.pdf [ Links ]
Azimian, A., Atalloeian, and Fatehi, L. 2014. An empirical correlation of uniaxial compressive strength with P-wave velocity and point load strength index on marly rocks using statistical method. Geotechnical and Geological Engineering, vol. 32. pp. 205-214. https://link.springer.com/article/10.1007/s10706-013-9703-x [ Links ]
Burkhardt, M., Kim, E., and Nelson, P.P. 2018. EMI database analysis focusing on relationship between density and mechanical properties of sedimentary rocks. Geomechanics and Engineering, vol. 14, no. 5. doi: 10.12989/gae.2018.14.5.491 [ Links ]
Comakli, R. and Cayirli, S. 2019. A correlative study on textural properties and crushability of rocks. Bulletin of Engineering Geology and the Environment, vol. 78, no. 5. pp. 1-17. https://doi.org/10.1007/s10064-018-1357-8 [ Links ]
Comakli, R. 2023. Investigating the effects of water saturation on the crushability of rocks used in aggregate production. Bulletin of Engineering Geology and the Environment, vol. 82. p. 197. https://doi.org/10.1007/s10064-023-03221-4 [ Links ]
Haftani, M., Bohloli, B., Nouri, A., Javan, M.R.M., Moosavi, M., and Moradi, M. 2015. Influence of penetration rate and indenter diameter in strength measurement by indentation testing on small rock specimens. Rock Mechanics and Rock Engineering, vol 48. pp. 527-534. https://link.springer.com/article/10.1007/s00603-014-0563-3 [ Links ]
ISRM. 2007. The Complete ISRM Suggested Methods for Rock Characterization, Testing and Monitoring: 1974-2006. Ulusay, R. and Hudson, J.A. (eds). Commission on Testing Methods, International Society for Rock Mechanics (ISRM), Turkish National Group, Ankara, Turkey. 628 pp. [ Links ]
Kahraman, S. 2001. Evaluation of simple methods for assessing the uniaxial compressive strength of rock. International Journal of Rock Mechanics and Mining Sciences, vol. 38. pp. 981-994. https://www.sciencedirect.com/science/article/pii/S1365160901000399 [ Links ]
Kahraman, S. and Toraman, O.Y. 2008. Predicting the Los Angeles abrasion loss of rock aggregates from crushability index. Bulletin of Materials Science, vol. 31. pp. 173-177. https://www.ias.ac.in/article/fulltext/boms/031/02/0173-0177 [ Links ]
Kahraman, S., Toraman, O.Y., and Cayirli, S. 2018. Predicting the strength and brittleness of rocks from a crushability index. Bulletin of Engineering Geology and the Environment, vol. 77. pp. 1639-1645. https://link.springer.com/article/10.1007/s10064-017-1012-9 [ Links ]
Köken, E. and Özarslan, A. 2018. New testing methodology for the quantification of rock crushability: Compressive crushing value (CCV). International Journal of Minerals, Metallurgy and Materials, vol. 25, no. 11. pp. 1227-1236. https://doi.org/10.1007/s12613-018-1675-7 [ Links ]
Karakul, H. and Ulusay, R. 2013. Empirical correlations for predicting strength properties of rocks from P-wave velocity under different degrees of saturation. Rock Mechanics and Rock Engineering, vol. 46. pp. 981-999. https://link.springer.com/article/10.1007/s00603-012-0353-8 [ Links ]
Karaman, K. and Kesimal, A. 2015. A comparative study of Schmidt hammer test methods for estimating the uniaxial compressive strength of rocks. Bulletin of Engineering Geology and the Environment, vol. 74, no. 2. pp. 507-520. https://link.springer.com/article/10.1007/s10064-014-0617-5 [ Links ]
Khandelwal, M. 2013. Correlating P-wave velocity with the physico-mechanical properties of different rocks. Pure and Applird Geophysics, vol. 170. pp. 507-514. https://link.springer.com/article/10.1007/s00024-012-0556-7 [ Links ]
Mateus, J., Saavedra, N-F., Calderón-Carrillo, Z., and Mateus, D. 2007. Correlation development between indentation parameters and unaxial compressive strength for Colombian sandstones. CTyF - Ciencia Tecnología y Futuro, vol. 3. pp. 125-135. http://www.scielo.org.co/scielo.php?script=sci_arttext&pid=S0122-53832007000100008 [ Links ]
Meyers, A.G., Hunt, S.P., Frick, R., and Behr, S. 2005. Point load testing of drilling debris for the determination of rock strength. Proceedings of the 40th U.S. Symposium on Rock Mechanics, Anchorage, Alaska, 25-29 June 2005. Paper no. ARMA/USRMS 05-712. https://onepetro.org/ARMAUSRMS/proceedings-abstract/ARMA05/All-ARMA05/ARMA-05-712/117733 [ Links ]
Mishra, D.A. and Basu, A. 2012. Use of the block punch test to predict the compressive and tensile strengths of rocks. International Journal of Rock Mechanics and Mining Sciences, vol. 51. pp. 119-127. https://www.sciencedirect.com/science/article/pii/S1365160912000287 [ Links ]
Ringstad, C., Lofthus, E.B., Sonstebo, E.F., Fjær, E., Zausa, F., and Fuh, G-F. 1998. Prediction of rock parameters from micro-indentation measurements: The effect of sample size. Proceedings of EUROCK '98, Trondheim, Norway, 8-10 July. https://onepetro.org/SPEEROK/proceedings-abstract/98EROK/All-98EROK/SPE-47313-MS/190279 [ Links ]
Sachapazis, C.I. 1990. Correlating Schmidt hardness with compressive strength and Young's modulus of carbonate rocks. Bulletin of the International Association of Engineering Geology, vol. 42. pp. 75-83. https://link.springer.com/article/10.1007/BF02592622 [ Links ]
Santarelli, F.J., Marshala, A.F., Brignoli, M., Rossi, E., and Bona, N. 1996. Formation evaluation from logging on cuttings. Proceedings of the SPE Permian Basin Oil and Gas Recovery Conference, Midland, TX, 27-29 March. SPE 36851. https://onepetro.org/REE/article-abstract/1/03/238/170144/Formation-Evaluation-From-Logging-on-Cuttings?redirectedFrom=fulltext [ Links ]
Schei, G., FjæR, E., Detournay, E., Kenter, C., Fuh, G.F., and Zausa, F. 2000. The scratch test: An attractive technique for determining strength and elastic properties of sedimentary rocks. Proceedings of the SPE Annual Technical Conference and Exhibition, Houston, TX, October 2000. https://onepetro.org/SPEATCE/proceedings-abstract/00ATCE/All-00ATCE/SPE-63255-MS/132202 [ Links ]
Singh, T.N., Kainthola, A., and Venkatesh, A. 2012. Correlation between point load index and uniaxial compressive strength for different rock types. Rock Mechanics and Rock Engineering, vol. 45, no. 2. pp. 259-264. https://link.springer.com/article/10.1007/s00603-011-0192-z [ Links ]
Toraman, O.Y., Kahraman, S., and Cayirli, S. 2010. Predicting the crushability of rocks from the impact strength index. Minerals Engineering, vol. 23. pp. 752-754. https://www.sciencedirect.com/science/article/pii/S0892687510001123 [ Links ]
Uboldi, V, Civolani, L., and Zausa, F. 1999. Rock strength measurements on cutting as input data for optimizing drill bit selection. Proceedings of the SPE Annual Conference and Exhibition, Houston, TX, 3-6 October. SPE, ENI SpA 56441. https://onepetro.org/SPEATCE/proceedings-abstract/99ATCE/All-99ATCE/SPE-56441-MS/60114 [ Links ]
Ulusay, R., Gokceoglu, C., and Sulukcu, S. 2001. Draft ISRM suggested method for determining block punch strength index (BPI). International Journal of Rock Mechanics and Mining Sciences, vol. 38. pp. 1113-1119. https://www.sciencedirect.com/science/article/pii/S1365160901000788 [ Links ]
 Correspondence:
S. Kahraman
Email: sairkahraman@yahoo.com
Received: 14 Feb. 2021
Revised: 23 Oct. 2023
Accepted: 28 Nov. 2023
Published: February 2024

