


Servicios Personalizados
Articulo
 Inglés (pdf)
 Articulo en XML
 Referencias del artículo
Indicadores

Links relacionados
-
 Citado por Google
 -
 Similares en Google
Compartir

 Permalink
Journal of the Southern African Institute of Mining and Metallurgy
versión On-line ISSN 2411-9717
versión impresa ISSN 2225-6253
J. S. Afr. Inst. Min. Metall. vol.124 no.1 Johannesburg ene. 2024
http://dx.doi.org/10.17159/2411-9717/1695/2024
PROFESSIONAL TECHNICAL AND SCIENTIFIC PAPERS
Lean construction: Implementing the Last Planner System on mining projects
T. Govindasamy; M.C. Bekker
Graduate School of Technology Management, University of Pretoria, Pretoria, South Africa
SYNOPSIS
The potential benefits of implementing the Last Planner System (LPS) on mining infrastructure projects were explored through two case studies in the South African mining industry.
The first part of the study involved measurement of the impact of LPS through earned value techniques on secondary project data. The second part sought to establish the lean construction success factors leading to improvements in construction performance. This was done by means of a research questionnaire distributed to the project owner's teams, contracted parties, and the LPS facilitators.
The results revealed a positive correlation between LPS application and planned percentage complete. However, the performance achieved during the LPS pilot was not sustained. The success factors and benefits considered most evident in the case study pilot differed among the three stakeholder groups.
The findings are expected to guide construction stakeholders to better define performance measures and focus on factors required to make LPS implementation more effective in the South African mining sector.
Keywords: Last Planner System (LPS), success factors, earned value management (EVM), construction.
Introduction
Completing construction projects within time and budget remains elusive, with only 25% of large construction projects achieving these goals (Abbas, Din, and Farooqui, 2016). Abbas, Din, and Farooqui (2016) refer to a study by Project Management South Africa (PMSA) which reveals that 'out of 300 global megaprojects with budgets of over $1 billion, 65% failed to meet the objectives established at final investment stage.
A projects performance can be viewed from two perspectives. Firstly from a business perspective, which is normally the project owner's view, and secondly from an execution efficiency perspective associated with the contractors interest (Enshassi, Mohamed, and Abushaban, 2009). The ability to complete projects on time is an indicator of efficiency in the construction process, which is subject to many variables and unpredictable factors related to: theperformance of different parties, availability of resources, environmental conditions, and contractual relationships (Assaf and Al-Hejji, 2006).
Monyane et al., (2019), with reference to Koskela (1992), suggest that lean construction 'is an innovative construction method to mitigate the poor performance on construction projects. Lean concepts are designed to improve the efficiency and effectiveness of project execution by improving productivity and reliability, better quality and customer satisfaction, improved forecasting, shortened schedules, waste minimization, cost-effective[ness], and improved safety. Unfortunately, after an extensive literature search no verifiable evidence could be found suggesting that the South African construction industry has adopted lean concepts for performance improvement'.
According to Sarhan et al., (2017), a variety of lean tools and techniques can be found within the lean construction domain. These include the Last Planner System (LPS), Value Stream Mapping (VSM), the 5S process, Kaizen, Total Quality Management (TQM), Increased Visualization, Fail Safe for Quality and Safety, Daily Huddle Meetings, the Five Why's, Just in Time (JIT), Pull 'Kanban' system, and Error Proofing (Poka-yoke). Porwal et al., (2010) state that LPS is one of the most widely used lean construction tools. In a project-orientated environment LPS addresses the creation of a predictable work flow among various stakeholders to achieve more reliable results. Hamzeh (2011) references Ballard and Kim (2007), Hamzeh (2009), and Viana (2010) to suggest that the despite the many benefits of LPS, research has shown that many organizations find it difficult to implement successfully.
Research objective
The objective of the study was to seek empirical evidence to illustrate the benefit of implementing LPS on infrastructure projects in the mining sector, in the hope of gaining valuable insights for the application of lean construction in the industry.
Research was conducted to assess whether the implementation of LPS had a positive impact on construction performance in two case study projects. Construction performance was measured using earned valued management indices of schedule and cost performance. The research also aimed to determine the impact LPS had on planning reliability during construction. Ballard (2000) describes Percent Plan Complete (PPC) as the number of planned activities completed, divided by the total number of planned activities, expressed as a percentage. A focus on plan realization diminishes the risk of variability spreading to downstream flows and tasks (Ballard, 2000). Further objectives were to understand the perceived critical success factors required, and benefits achieved, through the application of LPS on the two projects from the perspectives of three stakeholder groups.
Literature review
Lean production was developed by Toyota engineer Taichii Ohno. His idea behind the concept is the elimination of inventory and waste through small batch production with reduced set-up time and collaboration with suppliers for just-in-time deliveries (Ningappa, 2011).
Aziz and Hafez (2013) state that Koskela (1992) first proposed adaptation of lean production for construction whereby production is presented in the three elements of transformation, flow, and value generation. To achieve lean construction, Bashir et al., (2011) reference Koskela (1992) to identify the following le construction principles:
►Reduce variability
►Reduce cycle timesminimize the number of steps
►Focus control on the complete process
►Balance flow improvement with conversion improvement
►Increase output flexibility
►Increase process transparency.
In order to contextualize the LPS approach in construction, the following paragraphs outline the background to LPS, challenges and success factors for implementation, as well as potential benefits.
The Last Planner System
Dos Santos and Tokede (2016) reference Grenho (2009) to indicate that LPS was introduced in construction projects by Glen Ballard in 1993. With LPS, Ballard focused on improving weekly work plans and controlling work flow of design and construction on projects. Tayeh et al., (2019) reference Porwal, et al, (2010) to describe LPS as a planning, monitoring, and control tool based on lean construction principles of 'just-in-time' (JIT) delivery, value stream mapping (VSM), and pull scheduling (also known as reverse phase scheduling). Dos Santos and Tokede (2016) reference Ballard (2000) to indicate that the project master plan objectives are taken to a lower level of planning which is referred to the 'look-ahead schedule and weekly work plans. The look-ahead schedule involves the following process steps:
► Identify the assignments that can be completed in the next work period
► Consult with production experts to confirm that the assignment can be completed within the specified period and that the material and equipment is in place for the assignment to proceed
► Identify assignments that cannot be completed and amend the look-ahead schedule.
Dos Santos and Tokede (2016) cite Ballard (2000) to indicate that the weekly work plan is derived from the look-ahead plan by identifying and sequencing what work needs to be completed each day of the specified assignment, whereby the person or team who translates the objectives into assignments for implementation is said to hold the 'last planner position'. The planner investigates if all constraints to an assignment can be removed; if not, then the assignment must be postponed.
The PPC metric of measure will depend on the type of activity being executed. Examples of the PPC metric used during the LPS pilot included tons of steel installed per day for planned steel installations and tons of concrete poured per day for the planned construction of a silo. Alarcón, Diethelm, and Rojo (2002), in assessing the impact of lean construction using a database of 77 construction projects in Peru, found that after LPS was implemented, the collective PPC metric increased on average 6% year on year over a three-year period. Vignesh (2017), in a case study of implementing LPS in a district of Tamil Nadu of India, found that the PPC metric increased from a baseline of 38% to an average of 85% after implementation.
Challenges to LPS implementation
Samorow et al., (2018) suggest that lack of appropriate education and training on LPS is likely to lead to LPS being implemented incorrectly, and thus ineffectively. Alarcón, Diethelm, and Rojo (2002) identified the following inhibitors that prevents successful LPS implementation: lack of time to implement change, lack of training, poor organizational role definition, inadequate understanding of LPS concepts, weak administration, poor communication, and a lack of integration. To counter this it is suggested that LPS teams work together to plan effectively and share knowledge around the planning of tasks.
Hamzeh (2011) suggests that LPS implementation challenges the old practice of developing schedules during the early feasibility phases of the project without input from the implementation team. Instead, there is an emphasis on collaborative planning and constraint analysis in a continuous learning environment. The author asserts that meaningful participation of all parties is crucialfor successful LPS implementation.
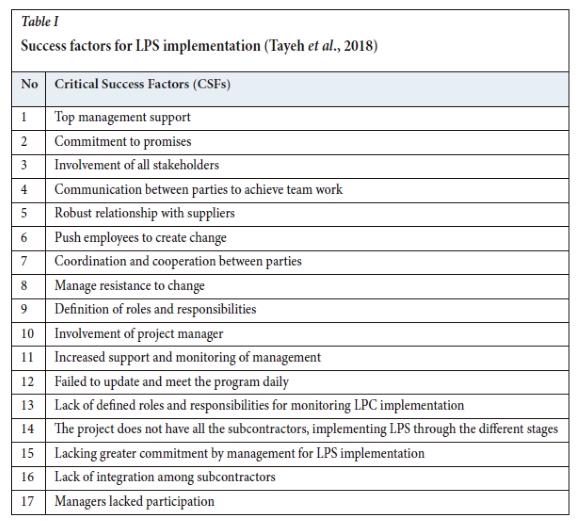
Success factors for LPS implementation
Tayeh et al., (2018) state that commitment to planning and coordination between the different participants is most critical for LPS success. They also listed other factors that support LPS implementation (Table I).
Benefits of LPS implementation
In a review to determine the impact of LPS on 77 Chilean construction projects, Alarcón et al., (2011) found that LPS improved the reliability of planning, yielded an improvement in PPC, and (over time) an improvement in management control, greater involvement of middle management, and a reduction in urgent procurement requests was observed.
AlSehaimi, Tzortzopoulous, and Koskela (2009), Dave, Hämäläinen, and Koskela (2015), and Koskela, Stratton, and Koskenvesa (2010), as mentioned by Tayeh et al., (2019), indicate that recognized benefits of LPS are 'minimize variability in workflows, foresee work plans, push toward improving the productivity, compressing time of a project, minimize project cost, maximize co-operation and confidence among team members.
LPS and project performance
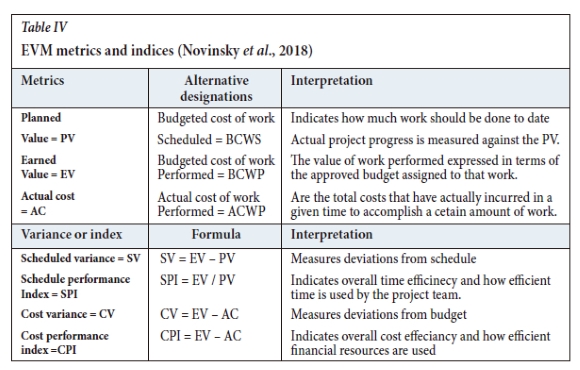
According to Novinsky et al., (2018), EVM and LPS can support a holistic mechanism to measure project progress accounting for economic and process quality in terms of collaboration and work flow. The authors explain that EVM determines project progress by measuring variance between planned and actual values for schedule and budget. LPS enhances planning with the PPC metric measuring reliability of achieving planned commitments (Novinsky et al, 2018). The authors further indicate that only a few studies have been completed on the combined application of EVM and LPS and the benefits to construction.
In a field test implementing LPS, Kim and Ballard (2010) found that the PPC improved from 54% to 94%, and the Schedule Variance (SV) index improved by 10%. In a review of 18 projects Ballard et al., (2007) found an improvement of more than 10% on CPI, which supports other researchers'findings on the relationship between planning reliability and project performance. Leal and Alarcón (2010), in assessing the impact of LPS on industrial mining projects, found that there was a correlation between PPC and EVM indices of SPI and CPI with a significant relationship between the variables.
Novinsky et al., (2018) suggest that organizations intending to implement EVM and LPS establish a standard that supports the application of the concept as well as consider a long pre-planning phase. They indicate that if standards are set and processes are controlled the application of EVM and LPS can improve project performance. In a study to quantify the impact of implementing LPS on industrial mining projects, Leal and Alarcón (2010) monitored performance measures such as schedule variance, profit margin variance, project productivity index, labour efficiency index, and project safety indicators for projects that had implemented LPS and projects that had not.
Conceptual model
Project process model
This study focuses on the transformative process of planning, controlling, and executing a project.. Tayeh et al., (2019) mention Munje and Patil (2014), who suggest that traditionally, construction allocates effort and resources to the planning stage of a project, to guide personnel during the execution as well as the control function. Tayeh et al., (2019) propose that this approach tends to overlook the flow and value considerations in the transformative process (Figure 1).
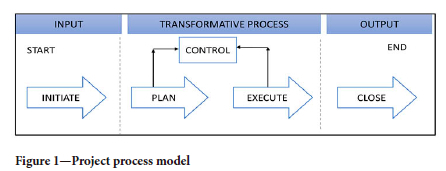
Figure 2 depicts the conceptual model for this research. Before LPS implementation the construction performance baseline is derived using EVM indices such as Schedule Performance Index (SPI) and Cost Performance Index (CPI). The construction performance during and post LPS implementation was derived using the same EVM indices. The quantified benefit is the difference in performance from the baseline. The benefit achieved through LPS must be viewed systematically and consider the Critical Success Factors (CSFs) required to support LPS implementation.
Research questions
The primary research questions are focused on the impact LPS has on construction planning reliability, construction performance, and the CSFs required for successful LPS implementation. The research questions are stated as follows.
1. What is the construction performance trend prior to and post LPS implementation?
2. How does construction performance compare to the PPC performance during LPS implementation?
3. Rank the CSFs for LPS Implementation from the perspective of the owners team, contracted parties, and the LPS facilitators.
Research methodology
We used a descriptive case study method to establish a comparison in construction performance related to the use of LPS. Zainal (2007) states that a case study method is descriptive when it sets out an accurate account of the characteristics within a selected data-set. Yin (2013), as referenced by Easterby-Smith, Thorpe, and Jackson (2015), views the case study method as subject to criticism as it does not have the rigour of scientific designs and rarely allows the conclusions from the case study to be extended to the general population. Brent and Pretorius (2009) cite Flyvbjerg (2006), that a case study can be employed, in specific circumstances to formulate general propositions and theories. The authors argue that the practical knowledge generated by a case study can be equal to or of greater value than theoretical knowledge (Brent and Pretorius, 2009).
Data sources
This research was based on two mining infrastructure projects. In both cases the project scope included construction, installation, and commissioning of new mining and plant infrastructure required to support mining operations. Two types of data were obtained, namely primary data through a questionnaire and secondary data from the actual project data.
Survey
To address the third research objective, primary data was collected through a survey which was completed by the project owners' teams, construction contractors, and LPS process facilitators. Saunders, Lewis, and Thornhill (2016) state that using a questionnaire is economical as it allows the researcher to collect standardized data from a specified population. The survey questionnaire was developed using the success factors obtained from the literature review on LPS implementation.
The questionnaire consisted of 17 questions with 43 variables and was distributed electronically to selected respondents. The questionnaire consisted of four parts:
► Demographic information about the respondents and their role on the construction project
► Success factors required for LPS implementation
► benefits of using LPS
► Relative importance (ranking) of factors that support LPS implementation.
A five-point Likert scale was used to capture and process the responses.
Project data
According to S0rensen, Sabroe, and Olsen (1996) the main advantage of using secondary data is its accessibility. The secondary data used related to project data generated for reporting, performance management, and control purposes for the respective case study projects. The specific secondary data sources relevant to this case study were as follows.
► Baseline project master schedule and budget
► Progress updates to master schedule and project cash flows, including budget forecast
► LPS implementation data, including PPC performance tracking data generated by the project under review.
A construction performance baseline before and after LPS implementation was evaluated using the EVM cost and schedule performance indices. Linear correlation was used to determine if a change in the PPC trend had an impact on the SPI and CPI indices. The primary and secondary data was analysed with Microsoft Excel, using descriptive statistics: mode, frequency, correlation, and linear regression.
Results
Eighty-four invitations were sent to selected project team members. A total of t34 were returned, with one incomplete (Table II). This resulted in a response rate of 39% from the three targeted groups.
The project owner's team had the highest response rate of 72%, followed by the LPS facilitator group with 71%. A poor response was received from the contracted parties group, mainly due to some contractors having completed work on the project. Prior to distribution, the survey content was validated by piloting the questionnaire with two respondents.
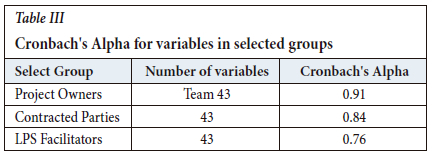
Zikmund (2003) defines validity as the ability of a scale or measuring instrument to measure what it is intended to measure, and states that a pilot study is any small-scale exploratory research technique that uses sampling but does not apply rigorous standards. Zikmund (2003) defines reliability as the degree to which measures are free from error and thus yield consistent results. The calculated Cronbach's alpha assesses the internal consistency among the test variables. Murguia (2019) indicates that a threshold score of 0.70 as a minimum is an acceptable value to measure the factor for cases studies.
Table III depicts the Cronbach's alpha score for each of the specified groups. The scores across the three groups are above 0.70, which indicates a good internal consistency of the items in the scale.
Project data analysis
The secondary data for the case study review was selected to align with the LPS pilot duration. The LPS pilot on both projects was six months, therefore for comparison purposes a six-month period prior to the LPS pilot was selected for baseline performance and six months post the pilot to evaluate if the performance attained during the pilot period was sustainable. The data-set was screened to obtain the planned and actual construction progress as well as the construction budget and actual costs on a monthly basis.
The SPI and CPI for each project were derived using the formulae in Table IV (Novinsky et al., 2018). The evaluation data-set references a specific period during the construction phase of each project, therefore to validate the SPI and CPI trends it was compared to the historical reporting trend for each of the projects.
The PPC data-set for both projects was obtained from tracking reports compiled during the LPS pilot phase. For Project A, the LPS pilot was four months and for Project B it was seven months. For comparative purposes an equal prediction period of a six-month LPS phase was determined in the middle of the two project life-cycles. For Project A the PPC performance was predicted for six months using the linear regression equation derived from the four-month data-set. For Project B the same was applied from the seven-month data-set. With the durations of the PPC measurement periods equally normalized, some comparisons could be made indicating the impact of LPS application on both projects. The PPC metric was tracked on a weekly basis on each of the projects and was averaged to provide a monthly PPC performance that could be compared to the monthly SPI and CPI of each project.
Project SPI, CPI, and PPC performance trends
Figure 3 presents Project A's SPI and CPI trend for the 18-month period. The PPC trend for six months represents the LPS pilot duration. The project objective for implementing LPS was to accelerate the project schedule by six months. To achieve this objective the project team focused on delays in construction of bulk earthworks (i.e. terraces, roads, dams, and office blocks). To keep the bulk earthworks construction on track and not adversely impact the targeted project completion, LPS was implemented with the construction contracted parties involved.
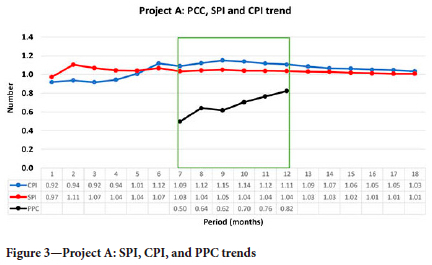
The SPI and CPI trends for Project A are consistently above unity for the 18-month observation period. This indicates that the project was on track to be completed within budget and on time. In the period before LPS the CPI was trending just below at 0.97 for four consecutive months, while the SPI was averaging 1.05 for the six-month period. During the LPS phase the SPI was stable with an average SPI index of 1.04. The CPI increased to an average index of 1.12. The PPC trend for the six-month average performance was 67%. Post the LPS phase the SPI was on average 1.02 and the CPI index averaged 1.06. The SPI and CPI trend closer to unity as the project nears completion.
Figure 4 presents the SPI and CPI trends for Project B for the 18-month period. Again, the PPC trend is captured for six months which represent the LPS pilot duration. The project faced many challenges related to changes in scope arising from unforeseen site conditions and poor construction productivity due to financial distress of the main contractor on the project. The project implemented LPS to improve the poor productivity of some construction teams to help improve the overall progress of the project.
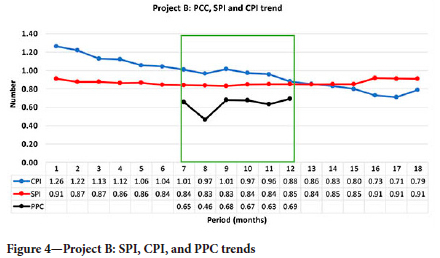
The SPI an CPI trends for Project B indicate an overall deterioration over the 18-month observation period. The project's current status is over budget and behind schedule. In the period before LPS the SPI index averaged 0.87. The CPI is trending at an average of 1.14; this is a result of costs increasing through site instructions early in the construction work without an adjustment to the schedule. It is evident that the integration between schedule and cost is not optimal on this project. During the LPS phase there is a slight decline in the SPI with an average of 0.84, and a bigger decline in CPI with an average of 0.97. The PPC during this phase averaged 63%. Post the LPS phase the SPI increased slightly and averaged 0.88% while the CPI further declined to an average of 0.79.
Project PPC correlation with and regression to SPI and CPI
During the LPS pilot the observed PPC trend and the SPI and CPI indices were analysed to determine if there was any correlation between the different variables. The correlation coefficient measures how well the relationship between two or more variables can be described by a straight line (Page and Meyer, 1999). A correlation coefficient is measured on a scale from +1 through to -1, where +1 is an indication of a positive correlation between variables, zero indicates no correlation, and -1 indicates a negative correlation. Page and Meyer (1999) state that the p-value indicates if there is a significant relationship between the variables.
► If p < 0.05, there is a significant relationship between the variables.
► If p > 0.05, there is no significant relationship between the variables.
Table V depicts the correlation coefficients and p-values for the PPC-SPI and PPC-CPI for the case study projects. For Project A the PPC-SPI correlation coefficient is 0.479, which indicates a positive relationship between the variables. The PPC-CPI correlation coefficient is 0.834, which also indicates a positive relationship. The p- value for PPC-SPI is greater than 0.05 and therefore indicates that there is no significant relationship between the variable. The p-value for PPC-CPI is less than 0.05 and therefore indicates a significant relationship between the variables.
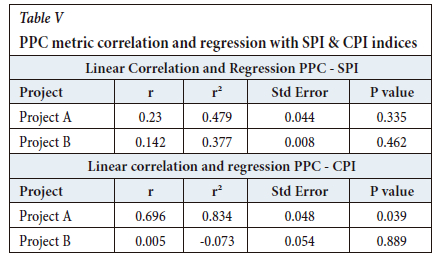
For Project B the PPC-SPI correlation coefficient is 0.377, which indicates a positive relationship between the variables. The PPC-CPI correlation coefficient is 0.073 which indicates a negative relationship between the variables. The p-values for PPC-ISP and PPC- CPI are greater than 0.05 and therefore there is no significant relationship between the variables.
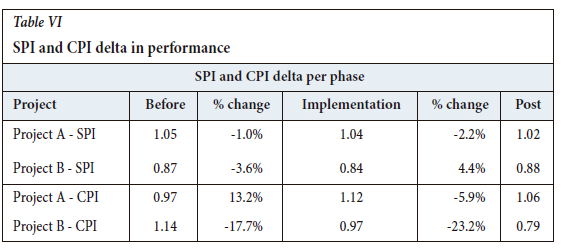
Quantifying SPI and CPI performance per phase
Table VI illustrates the difference (delta) in SPI and CPI from the baseline before LPS to performance during LPS, as well as the SPI and CPI performance post-LPS for both projects. The results reveal some variation. On Project A the SPI declined by 1% during implementation, while the CPI increased by 13% during the LPS phase. The performance declined on both SPI and CPI post the LPS pilot. Project B shows a decline in SPI of 4% during implementation, while the CPI declined by 17% during the LPS pilot. The performance on the SPI improved by 4%, and CPI declined by 23%, post the LPS pilot.
Survey results
The survey respondents were asked to rate their perceived experience from the LPS pilot using a five-point Likert scale according to the following coding: (1) strongly disagree; (2) disagree; (3) neutral; (4) agree; and (5) strongly agree.
Ranking ot critical success factors
The respondents were asked to rank the success factors for LPS implementation, using a scale from 1 (least important) to 8 (most important). The mode was used to define the most frequently occurring rank for each success factor per respondent group. According to Boone and Boone (2012), Likert-type ranks, which distinguish a greater-than relationship but do not quantify the relationship, comprise an ordinal measurement scale. The authors recommend the use of the mode or median for central tendency in ordinal-scale date, and frequencies for variability.
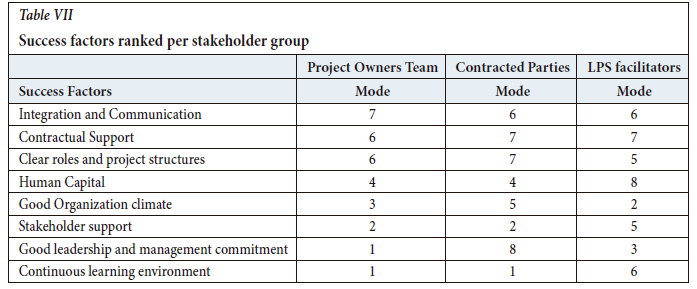
Table VII depicts the modes of the critical success factors asranked by the three stakeholder groups, arranged in descending order according to the project owner's team ranks. The rankings of of subsequent groups, the contracted parties and LPS facilitators, is reflected alongside the project owner's team for comparison purposes. It is evident that the three stakeholder groups have different perceptions of the critical success factors required for LPS implementation. The LPS facilitators ranking differed from the two comparison groups, although three of the top four factors selected by this group were among the top four factors ranked by the project owner's team. The most important success factor for LPS implementation differed among the three stakeholder groups. The project owner's team ranked integration and communication, contracted parties ranked good leadership and management commitment, and LPS facilitators ranked human capital as the most important success factor.
SPI and CPI delta in performance
Benefits observed during LPS implementation
Table VIII represents the perceived benefits of LPS implementation by the three stakeholder groups. Tthe project owner's team agreed that benefits were perceived during the LPS pilot, and strongly agreed that LPS helped management to better visualize the planned work. The LPS process facilitators also agreed or strongly agreed that the LPS benefits were observed during the LPS pilot, but were neutral on whether LPS helped minimize project costs. The contracted parties' observation on benefits contrasted with that of the other two groups. The contractor team was neutral or disagreed that benefits was observed during the LPS pilot, with the exception of enhance co-operation and confidence among project team members.
Discussion
The research model aimed to determine the impact of LPS on construction performance and understand the critical success factors for LPS ranked by the three stakeholder groups. A secondary aim was to explore the perceived benefits observed during LPS implementation.
Success factors ranked per stakeholder group
LPS impact on construction performance
During the LPS pilot the PPC metric had a positive trend and improved during the implementation period on both projects. This supports the findings of Vignesh (2017) and Alarcón et al., (2011), who found a distinct improvement in planning reliability.
The PPC and EVM indices show a positive linear correlation on both projects, which supports the findings of Leal and Alarcón (2010). There was a positive correlation between PPC and SPI for projects A and B, and a positive correlation between PPC and -CPI for Project A. However, the correlation between PPC and CPI for Project B was negative. The correlation for Project A PPC-CPI showed the only significant p-value. This is in contrast to Leal and Alarcón's (2010) findings of a significant p-value tfor both PPC-SPI and PPC-CPI.
The EVM indices suggest that there was no visible impact on construction performance from the LPS pilot. The SPI trend for Project A during LPS implementation presents a slightly more consistent performance compared to the period before LPS, suggesting that LPS had a positive impact on construction. The LPS impact for Project B is not apparent and the EVM indices do not reflect any improvements. This could be a result of underlying factors impacting the project that the LPS pilot could not adequately address. Project B suffers from poor productivity from contractors, which is exacerbated by financial distress. Poor productivity affecting construction performance is consistent with factors cited by Tayeh et al., (2018).
The delta values for project SPI performance observed during and post LPS pilot on Project A did not show an improvement, while on Project B the SPI performance declined during the LPS pilot but improved post the pilot. The results suggest that while the PPC performance on both projects improved during the LPS pilot period, the improvement in planning reliability is not visible in the project SPI and CPI performance.
Critical success factors and benefits of LPS Implementation
The aim was to explore the opinions of the three stakeholder groups participating in the LPS pilot on the critical success factors important for LPS implementation. The results depict a varied opinion among the three groups regarding the ranking of success factors, and differ from the sequence of success factors ranked by Tayeh et al., (2018) and Murguia (2019). This is to be expected as the implementation of LPS is specific to the environment and organizational culture in which the project is executed. The varying opinion on success factors required for LPS implementation among the three stakeholder groups could have led to challenges experienced during the pilot phase. Evidence for this is indicated by answers to the open question: 'What should be changed or stopped when using the short-term planning process?' It is worth mentioning that the Lean Construction Last Planner System (LPS) process was referred to as the 'short-term planning process' within the organizations during the pilot phase. The responses were varied and are summarized in Table IX, highlighting that some of the success factors were not well implemented in the case study pilot. There was no clear indication of what planning took place before the LPS pilot on the projects and no evidence of how success was to be measured during this phase. Therefore, the benefits could not be measured using secondary project data.
Conclusions
Construction performance
The study's primary aim was to investigate whether the lean construction tool LPS had a positive impact on construction performance. The proposition was that an improvement in planning reliability observed from the PPC metric will have a positive impact on the construction EVM indices. The case study results indicate that the PPC performance measured during the LPS pilot period had a positive upward trend. The delta SPI and CPI performance for the three distinct evaluation phases of before, during, and after the LPS pilot did not show consistent percentage improvement in the EVM indices. There was a positive correlation between PPC and SPI and PPC and CPI for the case study projects,although the correlation was not significant.
Critical success factors for LPS implementation
The study's secondary objective was to explore the factors required for successful LPS implementation. A questionnaire was utilized to survey the opinions of the three stakeholder groups (project owner's team, contracted parties, and LPS facilitators) related to the important factors for LPS implementation and perceived benefits of using LPS as a lean tool on the project. The critical success factor ranking among the three groups differed, with minor alignment in ranking of factors related to integration and communication, clear roles and project structures, and contractual support for suppliers. The variability in the success factor rankings by the three stakeholder groups points to possible challenges experienced during LPS implementation in this case study. The project owner's team and the LPS facilitators indicated agreement with the perceived benefits of LPS implementation, while the contracted parties generally disagreed that the perceived benefits were observed in the case study.
Challenges to LPS implementation
Contribution of the study
The research sought to find empirical evidence that the application of the lean tool LPS on infrastructure projects in the mining sector will improve construction performance. Implementing lean construction will help improve poor planning, poor site management, coordination problems, and chronic problems with waste (Tayeh et al.,, 2018). The study contributes to the knowledge of applying lean construction in the mining sector as follows.
► A positive PPC trend was observed, indicating an improved planning reliability on the case study projects.
► A positive correlation was observed on PPC and EVM indices of SPI and CPI. However, the actual causation could not be validated with the information available. Although not part of this research, the various factors that may have caused the correlation should also be investigated to indicate the cause-and-effect influencing factors.
► The study provides a perspective on the perceived important success factors and benefits associated with LPS implementation from the perspective of the three stakeholder groups.
► The study failed to show a clear and definitive improvement in construction performance during and post the LPS pilot phases. This could be attributed to the following:
• Poor planning. Performance baselines; and how benefits will be measured werwas not defined.
• LPS was implemented after construction started, which may have contributed to implementation challenges.
• Construction performance was measured on the project master level, instead of the work package level.
Recommendations
The case study is limited to two mining infrastructure projects, and hence the results are exploratory. The contractor participants in the study consisted solely of contractors involved in the two case study projects, and therefore the findings of the study cannot be generalized.
Based on the results and conclusions, the value of this research lies in improving the approach to implementing Lean Construction principles on projects in the mining industry. It is suggested that in future studies, different construction performance metrics should be utilized, which have a better correlation with PPC.
The final recommendation is that the use of an implementation framework should be considered to make LPS successful in mining projects. Hamzeh (2011) suggests that the meaningful participation of all parties in construction is a key factor for successful LPS implementation because LPS changes the way people think and execute work. Thus, managing LPS implementation issues in advance could help construction teams adapt to the new way of working (Hamzeh, 2011). To achieve this aim in a consistent and repeatable manner, the authors suggest an LPS implementation framework be used to facilitate the organizational change required for successful LPS implementation.
References
Abbas, A., Din, Z.U., and Farouqui, R. 2016. Achieving greater project success & profitability through pre-construction planning: A case-based study. Procedía Engineering, vol. 145. pp. 804-811. [ Links ]
Alarcón, L.F., Diethelm, S., and Rojo, O. 2002. Collaborative implementation of lean planning systems in Chilean construction companies. Proceedings of the Tenth Annual Conference of the International Group for Lean Construction (IGLC-10), Garmado, Brazil, August 2002. https://leanconstruction.org.uk/wp-content/uploads/2018/10/Alarcon-et-al.-2002-Collaborative-Implementation-of-Lean-Planning-Systems-in-Chilean-Construction-Companies.pdf [ Links ]
Alarcón, L.F., Diethelm, S., Rojo, O., and Calderón, R. 2011. Assessing the impacts of implementing lean construction. Revista ingeniería de construcción, vol. 23. pp. 26-33. [ Links ]
Assaf, S.A. and Al-Hejji, S. 2006. Causes of delay in large construction projects. International Journal of Project Management, vol. 24. pp. 349-357. [ Links ]
Aziz, R.F. and Hafez, S.M. 2013. Applying lean thinking in construction and performance improvement. Alexandria Engineering Journal, vol. 52. pp. 679-695. [ Links ]
Ballard, H.G. 2000. The last planner system of production control. PhD thesis, University of Birmingham. https://etheses.bham.ac.uk/id/eprint/4789/1/Ballard00PhD.pdf [ Links ]
Ballard, G., Tommelein, I., Koskela, L., and Howell, G. 2007. Lean construction tools and techniques. Design and Construction. Routledge. [ Links ]
Bashir, A.M., Suresh, S., Proverbs, D., and Gameson, R. 2011. A critical, theoretical, review of the impacts of lean construction tools in reducing accidents on construction sites. Proceedings of the 27th Annual ARCOM Conference, Bristol, UK. Association of Researchers in Construction Management. pp. 5-7. [ Links ]
Boone, H.N. and Boone, D.A. 2012. Analyzing likert data. Journal of Extension, vol. 50. pp. 1-5. [ Links ]
Brent, A.C. and Pretorius, M.w. 2009. Investigation into behaviours in and performances of a R&D operating unit. Proceedings of the R&D Management Conference 2009, Viernna, Austria, 21-24 June. Fraunhofer. https://researchspace.csir.co.za/dspace/bitstream/handle/10204/3496/Brent_d1_2009.pdf?sequence=1&isAllowed=y [ Links ]
Dos Santos, G. and Tokede, O. 3026. Last Planner System - from theory to implementation. ICEC 2016: Proceedings of the 10th Cost Engineering, Quantity Surveying & Project Management World Congress. International Cost Engineering Council. pp. 305-318. [ Links ]
Easterby-Smith, M., Thorpe, R., and Jackson, P.R. 2015. Management and Business Research. Sage. [ Links ]
Enshassi, A., Mohamed, S., and Abushaban, S. 2009. Factors affecting the performance of construction projects in the Gaza strip. Journal of Civil Engineering and Management, vol. 15. pp. 269-280. [ Links ]
Hamzeh, F.R. 2011. The lean journey: implementing the last planner system in construction. Proceedings of the 19th Annual Conference of the International Group for Lean Construction (IGLC19). International Group for Lean Construction. pp. 379-390. [ Links ]
Kim, Y-W. and Ballard, G. 2010. Management thinking in the earned value method system and the last planner system. Journal of Management in Engineering, vol. 26. pp. 223-228. [ Links ]
Leal, M. and Alarcón, L. 2010. Quantifying impacts of Last Planner™ implementation in industrial mining projects. Proceedings of the 18th Annual Conference of the International Group for Lean Construction, Haifa, Israel. https://iglcstorage.blob.core.windows.net/papers/attachment-d5d9bfaf-19cf-438c-83f9-cf463f018722.pdf [ Links ]
Monyane, T., Emuze, F., Awuzie, B., and Crafford, G. 2019. Challenges to Lean Construction implementation in South Africa. Proceedings of the Construction Industry Development Board Postgraduate Research Conference, 2019. Springer. pp. 337-344. [ Links ]
Murguia, D. 2019. Factors influencing the use of Last Planner System methods: An empirical study in Peru. Proceedings of the 27th Annual Conference of the International. Group for Lean Construction (IGLC), Dublin, Ireland. Pasquire, C. and Hamzeh, F.R. (eds), pp. 1457-468. [ Links ]
Ningappa, G.N. 2011. Use of Lean and Building Information Modeling (BIM) in the construction process; does BIM make it leaner? Georgia Institute of Technology. [ Links ]
Novinsky, M., Nesensohn, C., Ihwas, N., and Haghsheno, S. Combined application of earned value management and last planner system in construction projects. Proceedings of the 26th Annual Conference of the International Group for Lean Construction, Chennai, India. González, VA. (ed.). pp, 775-785. https://iglcstorage.blob.core.windows.net/papers/attachment-4b57bcae-e782-429e-9a9c-dcd57a6ed884.pdf [ Links ]
Page, C. and Meyer, D. 1999. Applied Research Design for Business and Management. McGraw-Hill Higher Education. [ Links ]
Porwal, V., Fernandez-Solis, J., Lavy, S., and Rybkowski, Z.K. 2010. Last planner system implementation challenges. Proceedings of the 18th Annual Conference of the International Group for Lean Construction, Haifa, Israel . pp. 548-54. https://iglcstorage.blob.core.windows.net/papers/attachment-044f2268-53fb-4c76-8aa0-919acdd12487.pdf [ Links ]
Samorow, D., Davies, K., Puolitaival, T., and Kestle, L. 2018. Last Planner System: Views of main contractors and subcontractors within the New Zealand construction industry. Proceedings of the 42nd Australasian Universities Building Education Association (AUBEA) Conference: Educating Building Professionals for the Future in the Globalised World. Vol. 1: Innovation. Do, K., Sutrisna, M., Cooper-Cooke, B., and Olatunji. O. (eds). pp. 269-278. https://www.researchbank.ac.nz/bitstream/handle/10652/4400/Samorow%2c% 20D.%20%282018%29.pdf?sequence=3&isAllowed=y [ Links ]
Sarhan, J.g., Xia, B., Fawzia, S., and Karim, A. 2017. Lean construction implementation in the Saudi Arabian construction industry. Construction Economics and Building, vol. 17, no, 1. pp. 46-69. [ Links ]
Saunders, M., Lewis, P., and Thornhill, A. 2016. Research Methods for Business Students. (7th edn). Pearson Education, Harlow. [ Links ]
S0rensen, H.t., Sabroe, S., and Olsen, J. 1996. A framework for evaluation of secondary data sources for epidemiological research. International Journal of Epidemiology, vol. 25. pp. 435-442. [ Links ]
Tayeh, B.A., Al Hallaq, K., Al Faqawi, A.H., Alaloul, W.S., and Kim, S.Y. 2018. Success factors and barriers of last planner system implementation in the Gaza Strip construction industry. Open Construction & Building Technology Journal, vol. 12. pp. 389-403. doi: 10.2174/1874836801812010389 [ Links ]
Tayeh, B.A., Hallaq, K.A., Zahoor, H., and Al Faqawi, A.H. 2019. Techniques and benefits of implementing the last planner system in the Gaza Strip construction industry. Engineering, Construction and Architectural Management, vol. 26, no. 7. pp. 1424-1436. [ Links ]
Vignesh, C. 2017. A case study of implementing Last Planner system in Tiruchirappalli district of Tamil Nadu - India. International Journal of Civil Engineering and Technology, vol. 8, no. 4. pp. 1918-1927 [ Links ]
Zainal, Z. 2007. Case study as a research method. Jurnal Kemanusiaan, vol. 5, no. 1. https://jurnalkemanusiaan.utm.my/index.php/kemanusiaan/article/view/165/158 [ Links ]
 Correspondence:
G. Bekker
Email: giel.bekker@up.ac.za
Received: 22 Oct. 2021
Revised: 30 Oct. 2023
Accepted: 30 Oct. 2023
Published: January 2024

