


Servicios Personalizados
Articulo
 Inglés (pdf)
 Articulo en XML
 Referencias del artículo
Indicadores

Links relacionados
-
 Citado por Google
 -
 Similares en Google
Compartir

 Permalink
Journal of the Southern African Institute of Mining and Metallurgy
versión On-line ISSN 2411-9717
versión impresa ISSN 2225-6253
J. S. Afr. Inst. Min. Metall. vol.123 no.12 Johannesburg dic. 2023
http://dx.doi.org/10.17159/2411-9717/1613/2023
PROFESSIONAL TECHNICAL AND SCIENTIFIC PAPERS
Investigation of a conveyor belt fire in an underground coal mine: Experimental studies and CFD analysis
C.O. AksoyI; G.G.U. AksoyII; A. FişneIII; I. AlagozIV; E. KayaI
IDokuz Eylul University, Department of Mining Engineering, Izmir-Turkey. ORCID: C.O. Aksoy: http://orcid.org/0000-0002-4328-4862. ORCID: E. Kaya: http://orcid.org/0000-0002-8268-2484
IIHacettepe University, Department of Mining Engineering, Ankara-Turkey. ORCID: http://orcid.org/0000-0002-9328-9899
IIIIstanbul Technical University Department of Mining Engineering, Istanbul, Turkey. ORCID: http://orcid.org/0000-0001-7449-0573
IVElectric Production Co. Ankara-Turkey. ORCID: http://orcid.org/0000-0002-7167-8340
SYNOPSIS
Coal produced in underground mines is transported to the surface by means of conveyor belts throughout long roadways. The combustion of belts puts a large number of employees at great risk. Underground collieries differ from other underground mines -due to the combustible nature of the product. The most prevalent cause of belt fires in underground coal mine is spontaneous combustion due to oxidation of the coal, which also enables the conveyor belt to burn over time. In 2014, a belt fire in an underground coal mine in Manisa-Soma, Turkey caused 301 fatalities. A study has been conducted on this accident for approximately 3 years, consisting of combustion tests in a purpose-built research gallery, comparison of the test results with mine records of the accident, and CFD modelling of the mine environment. The intensity of the fire was sufficient to redirect the air flow underground, causin large amounts of toxic gases to fill almost the entire mine in approximately 15 minutes. It is recommended that CFD analysis be used in planning emergency action strategies in underground mines.
Keywords: Conveyor belt fire, CFD analysis, emergency plan, toxic gas, underground mine.
Introduction
In underground mining, there are many factors that can cause problems ranging from minor accidents to catastrophes. One of the most important of them is the quailty of air in underground airways, because low levels of oxygen or increased concentrations of dangerous gases endanger the health and safety of mineworkers. On the other hand, it is obvious that a healthy workplace results in greater productivity.
Since mining operations began, natural air flow has been used to provide ventilation by exploiting the air pressure differences between different parts of the mine. Altough this is an efficent method of ventilation, in some cases it does not suffice, such as dead end volumes, crosscuts, and blind spaces where the air cannot enter naturally. In order to provide fresh air entry for workers and the efficient operation of machinery, and to dilute contaminant to below the regulatory limits, high air flows are providee via fans.
The air flow that is needed for adequate ventilation has to be calculated in order to guarantee sufficent fresh air is present in both standard operational circumstances and exceptional circumstances or accidents. For example, during routine excavation and transportation work, the required amount of air to dilute the exhaust gases from machines should be calculated, as well as the flows needed in the case of an accident followed by a mine fire. However, there is another risk that is particularly associated with underground coal mining operations - that of conveyor belt combustion. The combustion process starts with coal oxidation, and if unchecked can ignite the conveyor belt, producing substantial volumes of toxic gases. Barros-Daza et. al. (2021) classified belt fires according to the type (stage) of the fire and method of firefighting. The main hazards include reduced visibility, toxic effects of carbon monoxide (CO), and elevated air temperatures downstream of the fire (Perzak et. al., 1995). Five gaseous products of belt fires have been -identified, i.e., carbon monoxide, carbon dioxide, hydrogen cyanide, hydrogen bromide, and sulphur dioxide (SO2) (NIOSH, 1988; Krawiec, 2021; MSHA, 2008).
In underground ventilation studies the complex air volumes, comprising multiple galleries or branches, are divided into sections with the same aerodynamic characteristics. Each section is assigned an air resistance and the obtained circuits are solved through network techniques such as the Hardy Cross method (Diego, Torno, and Toraño, 2011). In the past 10 years significant improvements have been made in software for ventilation plannoing purposes. There are different tols for calculating and rapidly testing the network, such as VENTSIM, VNET-PC, or VENPRI. In all cases, each software type employs a database of air resistances taken from specialized bibliographies or field measurements.
Ventilation studies are a type of fluid mechanics problem, and the most sophisticated method in this field is computational fluid dynamics (CFD). CFD allows for the calculation of the variables that define fluid movement in three-dimensional spaces, after a laborious procedure of model creation, meshing, and adjustment of the equations.
CFD is widely employed and validated in industry for solving fluid problems , with immediate applications in the calculation of ventilation flows in all kinds of systems, as shown by Ballesteros-Tajadura et al. (2006) and Hargreaves and Lowndes (2007), with particular relevance in multiphase studies of fire situations (Galdo Vega et al. 2008; Yuan and You, 2007). Chen et al. (2019) used CFD to simulate fire and smoke movement in a serious fire incident in a road tunnel.
In 2014, an accident occurred at an underground coal mine in Soma-Manisa, Turkey, in which 301 workers died. More than 250 of these workers were employed on a production panel (the S panel) located on the return airway. In this article, the events that developed after fire occured will be discussed more than the cause of the accident. Immediately after the accident, the entire mine was filled with highly concentrated gas emitted by a belt burning in an area where the air flow was almost 0.3 m/s., which is not sufficient to clean the air in a gallery under normal conditions. The conveyor involved was not a flameproof belt (legislation at the time did not require this).
The esperimental part of the investigation was conducted in a research gallery in which more than 100 conveyor belt fires have been simulated. Reliable data could not be obtained from all experiments, since belt burn-in did not occur in every case. Furthermore, due to the high gas concentration, it is extremely risky to enter the gallery to obtain data while an experiment is under way
The data at the time of the accident was taken from the sensors in the mine and used as input for the CFD analysis. The results of the CFD analysis are comparable with the data from the sensors. The CFD analysis showed that the thermodynamics of the mine completely changed due to the fire.
The research gallery
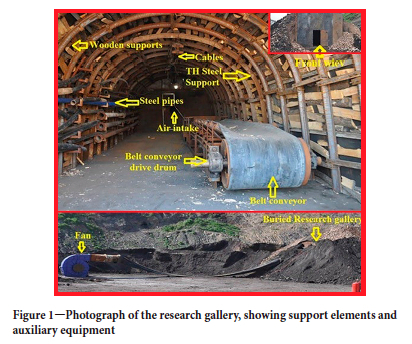
IA research gallery was built with the aim of creating an environment similar to that in which the accident occurred, in order to investigate the combustion mechanism of the conveyor belt, to characterize the combustion products, and to determine the sequence of appearance and concentrations of these products. The section of the gallery where the tests were carried out was 16 m2 in cross-section, the same as the site of the fire, and the support and auxiliary equipment were the same. Figure 1 shows a photograph of the gallery. Two gas sensors were used to determine the types and time-dependent concentrations of gases released by the combustion of the belt in the gallery. One sensor was used to measure the amounts of carbon dioxide (max. 500 ppm), carbon monoxide (max.10 000 ppm), methane (max. 4%) and oxygen, and the other measuring hydrogen cyanide (max. 50 ppm), hydrogen sulphide (max. 100 ppm), chlorine (max.50 ppm), and oxygen.
Conveyor belt combustion experiments and results
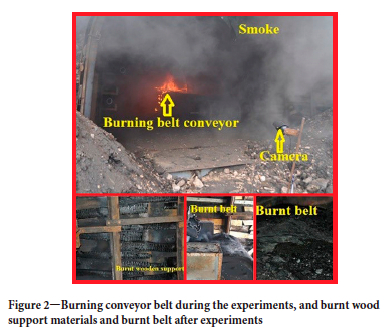
Various methods were attempted to burn conveyor belts, including using synthetic thinner, gasoline, coal, wood reinforcement material, coal-wood mixtures, and igniting them with an oxygen source. However, combustion only occurred in conveyor belts where coal and wood materials were used together. During these trials, the belt was not subjected to any force, also its temperature was adjusted to ambient. In some trials, experiments were carried out by placing the coal over the belt drum and the belt.
Combustion and post-combustion images obtained in the first experiments are given in Figure 2. As can be seen, the experiments were recorded both from the front of the gallery and from the back (inside). The front of the gallery was kept open in the first experiments, but it was sealed with steel in the later stages of the belt burning experiments and the camera was enclosed in the gallery.
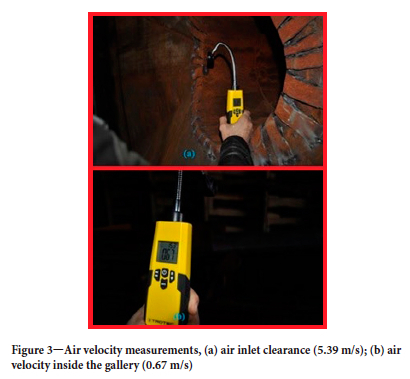
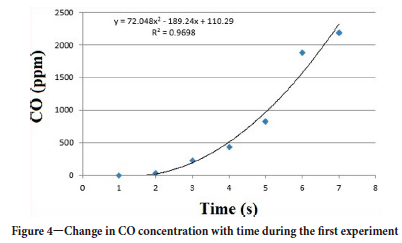
In the combustion experiments, an opening was provided behind the gallery to simulate the air flow in the mine, allowing the intake of air from the fan (Figure 1). Air velocity measurements in this opening and inside the gallery are given in Figure 3. Approximately 100 experiments were carried out. One of the data-sets from the CO sensor during the first experiment is given in Figure 4. The gas sensors were calibrated after each experiment.
Gas measurements were taken in all tests. The most important information gained from these measurements is that the amounts of gas released after belt fire are very similar. As shown in Figure 5, the amount of oxygen in the ambient air is 8.12% (frequently below 3%), the CO level is higher than 10 000 ppm (the sensor's CO measurement limit), the carbon dioxide level is above the measurement limit of the sensor, and the concentration of methane is 3.86%. Although there was no methane in the environment before combustion, the sensors detected methane once combustion had started. It was found that the combustion gases that contain hydrocarbons can be detected as methane by the sensors. When the belt started to burn, a very strong flame appeared and it was very difficult to extinguish this fire. The main reason for this is that the hydrocarbons produced by combustion of the petroleum-derived belt material act as a fuel and feed the fire. Data on the gases measured with the other sensor is given in Figure 6.
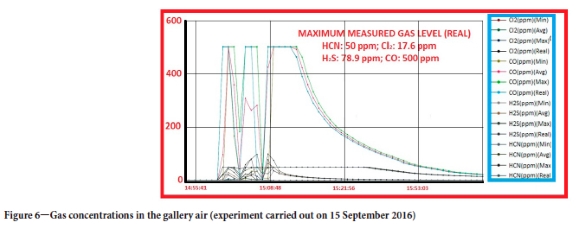
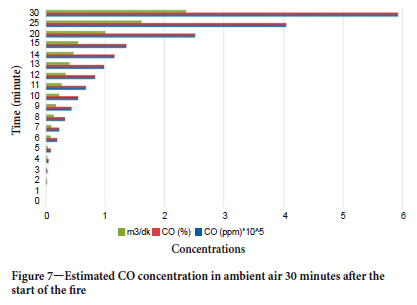
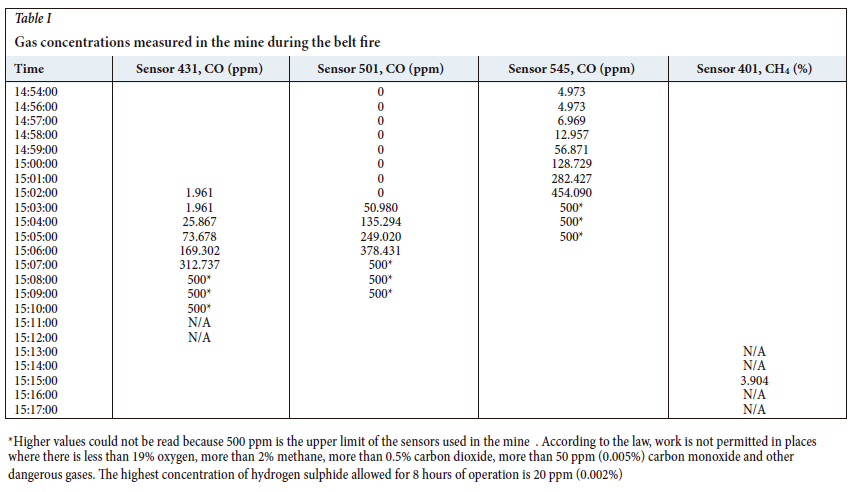
As seen in Figure 6, in addition to CO, CH4, O2, and CO2, hydrogen cyanide, hydrogen sulphide, and chlorine were also emitted. These gases can be quickly fatal if inhaled at high concentrations. In the conveyor belt burning experiment depicted in Figure 6, the hydrogen cyanide concentration in the ambient air was measured at 50 ppm (the upper limit of detection by this sensor). The chlorine concentration was 17.6 ppm, hydrogen sulfphde concentration 78.9 ppm, and CO concentration 500 ppm (also the upper limit of detection for this sensor, measured above 10 000 ppm with the other sensor). Legislation does not permit work in atmospheres containing less than 19% oxygen, and more than 2% methane, 0.5% carbon dioxide, 50 ppm (0.005%) carbon monoxide and other dangerous gases. The maximum hydrogen sulphide concentration permitted for 8 hours of operation is 20 ppm (0.002%). The upper measurement limits of the sensors used in these experiments wre exceeded for some gases - according to the law, the limit of the sensors in the mine cannot be less than twice the allowable values. Since no information was available on the actual gas concentrations, a best-fitting approach was used to estimate concentrations. The simulated CO concentration in the environment is depicted in Figure 7. In this approach, both the sensor data in the mine during the accident (the sensor data in the mine was cut off about 3 minutes after the start of the fire) and the time-dependent gas concentration data from the experiments conducted in the research gallery were used.
Gas data obtained from sensors in the mine
Belt fires pose a great risk not only for underground coal mines, but also in other enclosed environments. It is thus very important to examine the events that occurred during the fire in the mine and the behaviour of the toxic gases that were evolved.
In an underground coal mine, a fire on a belt transporting coal may becomr so intense that it affects the thermodynamic conditions across almost the entire mine.
Ventilation in underground mines is provided using pressure differentials. The air moves from high pressure regions to the low pressure regions. However, as the temperature in the gallery increases with the burning process, the air pressure also increases.
Therefore, the heated air will move from the fire zone to the other parts of the mine. This movement can be very rapid, substantially altering the ventilation conditions underground.
A CFD analysis was carried out in order to accurately determine how the air flow in the mine was affected by the fire. For this purpose, the structural layout of the mine, and the features of the equipment used (secondery fans, ducts etc.) were modelled. The CFD model view of this mine is shown in Figure 8. The gallery walls In the area where the belt fire occurred are composed of rock, not coal. However, there was coal on the belt, the wood support elements, as well as the supporting steel sets . For this reason, an effort was made to create a srealistic an environment as possible in the experimental gallery. In CFD study, the data obtained as a result of the experiments carried out in the research gallery was used.
The data, from the CO sensors numbers 431, 501 and 545 and CH4 sensor 404 is listed in Table I (extracted from the Committee Report).
CFD analysis
The mining model for the CFD analysis was prepared on a 1:1 scale. In this model, the air gates employed in the mine, secondary and main fans, ducts and in-mine settlement were operated exactly as was done in the mine Using the ANSYS FLUENT CFD solver, the mass and momentum conservation equations (Navier-Stokes equations) were solved in order to calculate the air flow (given in Equations [1] and [2]).
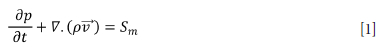
Here Sm is the user-defined source term added to the continuous phase.
Momentum conservation equation:
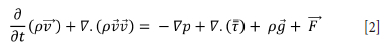
Here
p is static pressure
 stress tensor
 gravity effect
 external effects (contains user-defined source terms)
The stress tensor is defined as in Equation [3].

Here, μ is the molecular viscosity and I a tensor.
Heat transfer and mass transfer are important in this problem as well as the Navier-Stokes equations, The conservation of energy and transport equation for species are solved as follows (Equations [4] and [5] respectively).
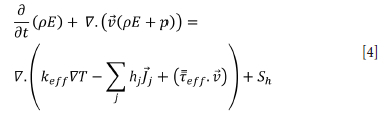
Here,
keff effective transmission coefficient (when k+kt, kt is given as a turbulent thermal conduction coefficient)
Jj: diffusion of species
j: diffusion of flow.
Here,
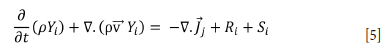
Yi: local mass fraction for each species
Rt: the production of net species formed by the chemical reaction
St: user-defined sources.
In gaseous underground coal mines, turbulence ventilation is used in order to dilute the gases in the gallery walls and evacuate them from the mine air. The main purpose is to allow the air to flow in a swirling manner and to remove the dangerous gases that settle in the spaces on the gallery walls before they reach a high concentration. There are several methods for integrating this situation into the numerical model. In these methods, the k-e turbulence model is used in CFD analysis to ensure that the air flow in the model is under turbulent flow conditions. The k-e turbulence model has been used in addition to previous models to consider the effect of turbulence in numerical modelling. Accordingly, the turbulent kinetic energy equation and corresponding diffusion rate equation are solved (Equations [6] and [7]).
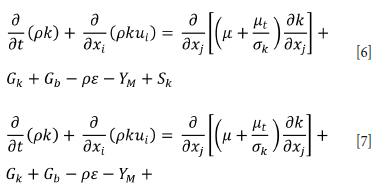
In these equations;
Gk: turbulent kinetic energy production from velocity gradients
Gb: rising turbulent kinetic energy production
Ym: unstable expansion allowance for compressible turbulence
C1ε, C2ε, and C3ε are constants, the Prandtl numbers of turbulence for k and e are specified as σk and σe. Finally, Sk and S are user-defined source terms.
More detailed information about the equations given above can be found in the ANSYS FLUENT Theory Guide (2013).
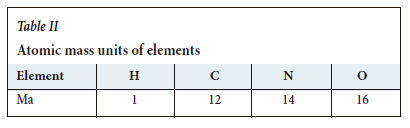
The data required for the fire scenario simulation was determined from a literature survey (Wang et al., 2009; Galdo Vega, 2008) and our research results. The model in the literature for such a fire is termed the 'pool fire' (Guan et al., 2013) A 7.5 MW fire was simulated for the fire model. In order to establish similarity in CFD analysis, a fire model should be selected. When the fire models were examined, it was understood that the perfect combustion model for diesel was similar to this study. According to Wang et al. (2009) and Galdo Vega et al. (2008), the pool fire for diesel is considered as complete combustion. The perfect combustion equation for diesel is
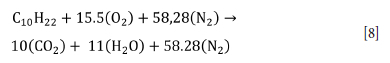
The atomic mass units of elements and combustion equation variables used in the analysis are given in Tables II and III, respectively.
CFD results
The movement of the CO gas with time is depicted in Figure 9, and that of CH4 gas in Figure 10.
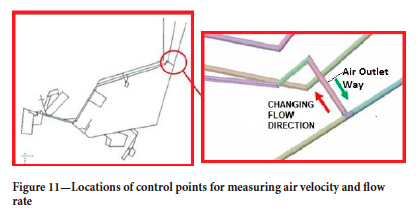
From the distribution of CO and CH4 depicted in Figure 11, it is evident that the air flow undergoes a significant change within the gallery. The pre-fire air flow is represented by the green colour, while the post-fire air flow is shown in red. Notably, the return air that should exit the mine is redirected back into the mine after the fire. This phenomenon is primarily attributed to the increased temperature and pressure in the fire zone, causing the heated air to move towards cooler regions of lower pressure. While a portion of the CO and CH4 gases escapes the mine, some gases are redirected back inside due to the intensive emission of CO gas and the limited gallery space. The altered thermodynamic conditions of the mine also contribute to this phenomenon.
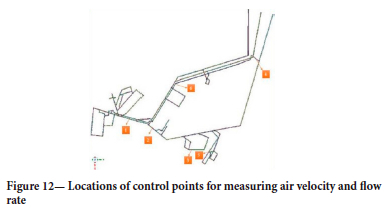
In order to analyse the flow direction change the velocity, flow, gas distribution, and temperature were calculated in different regions of the flow volume. Figure 12 shows the locations of six of these measurement points.
The mass flow versus time graphs for four of these measurement points are shown in Figure 13. It can be seen that the mass flow value at points 3 and 4 is initially positive,becoming negative after about 1000 seconds.
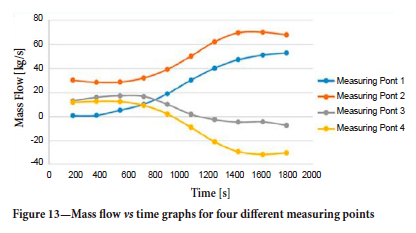
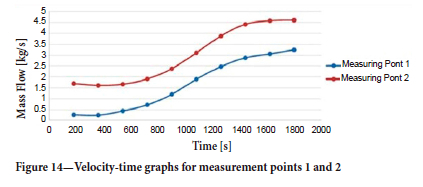
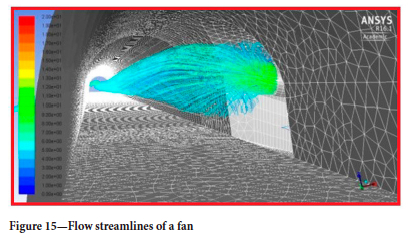
With the change of direction of the air flow, it is seen that the mass flow rates increase rapidly in the main galleries, especially at measurement points 1 and 2, after 800 seconds. Velocity-time plots at the same points are shown in Figure 14. Flow lines of one of the fans in the mine are shown in Figure 15.
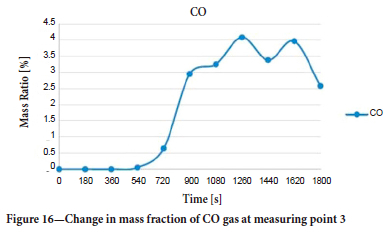
The mass ratio-time graph for CO at measurement point 3 is shown in Figure 16. CO reaches this area in about 8 minutes from the start of the fire. Fluctuations between 1220 and 1800 seconds are due to the change in direction of the air flow. This measuring point is the region where the CO gas has the lowest dissemination in the surrounding galleries.
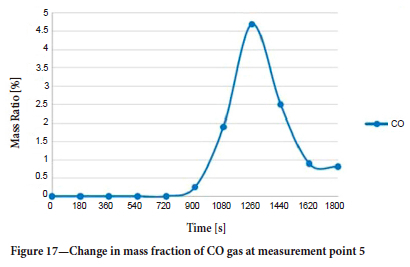
The mass ratio-time graph for CO at measurement point 5 is shown in Figure 17. CO gas reached this region in about 900 seconds from the start of the fire. The sudden changes observed at 1260 seconds are attributed to the change in direction of flow in this region.
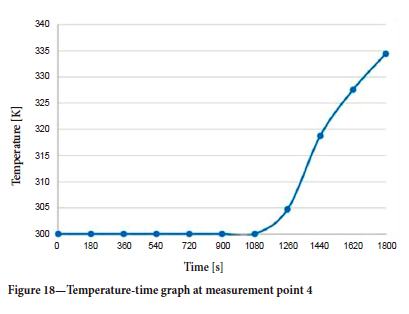
The temperature-time graph at measurement point 4, where the flow changes direction, is plotted in Figure 18.
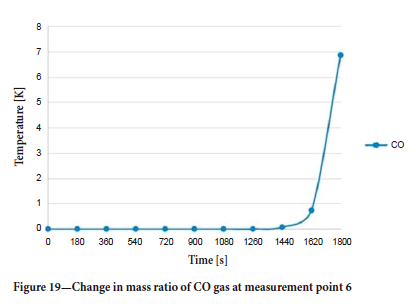
Finally, the mass ratio-time graph for CO gas at measurement point 6 on the main roadway, where the flow moves by changing direction, is shown in Figure 19. It can be seen that the CO gas reaches this region in approximately 1440 seconds.
According to the data obtained, the flow accelerated due to the energy input in the fire zone and combined with the diffusion of gases in the air, caused the air flow to change direction at measurement point 4. The air flow in this main roadway, which is responsible for transporting polluted air to the atmosphere, underwent a reversal some time after the start of the fire.
Conclusions
In 2014 Soma-Manisa, one of the most important underground coal mines in Turkey, experienced a major accident. The cause of this accident, which had significant consequences, was a belt fire.
In this study, it was found that in addition to combustion products such as CO and CO2, gases such as HCN, Cl2, and H2S, which are quickly fatal at low concentrations, are also released during a belt fire.
Another important finding is that the thermodynamic conditions in an underground mine can change completely in a very short time, depending on the magnitude of the fire.
The belts are made of petroleum derivatives, and hydrocarbon products are among the gases formed during combustion. These products are registered as CH4 by the gas sensors. Furthermore, the fact that these by- product gases are themselves flammable makes it very difficult to extinguish a conveyor fire, because the hydrocarbon combustion by- products in the environment continue to burn. Also, these products can accumulate in a part of the mine that is not at risk of fire, with the potential to cause an explosion.
The last important result from this study is that the air circulation in the mine can change unexpectedly due to a fire. For this reason, it is recommended that CFD analysis be used in planning emergency action strategies in underground mines.
References
ANSYS. 2012. Fluent Theory Guide. https://www.afs.enea.it/project/neptunius/docs/fluent/html/th/main_pre.htm [ Links ]
Ballesteros-Tajadura, R., Velarde-Suárez, S., Hurtado-Cruz, J.P., and Santolaria-Morros C. 2006. Numerical calculation of pressure fluctuations in the volute of a centrifugal fan. Journal of Fluids Engineering, vol. 128, no. 2. pp. 359-369. [ Links ]
Barros-Daza, M.J., Luxbacher, K.D., Lattimer, B.Y., and Hodjes, J.L. Mine conveyor belt fire classification. Journal of Fire Sciences, vol. 40, no. 1. pp. 44-69. [ Links ]
Chen, Y-J., Shu, C-M., Ho, S-P., Kung, H-C., Chien, S-W., Ho, H-H., and Hsu, W-S. 2019. Analysis of smoke movement in the Hsuehshan tunnel fire. Tunnelling and Underground Space Technology, vol. 84, pp. 142-150. [ Links ]
Diego, I., Torno, S., and Toraño, J. 2008. CFD simulation of aerodynamic resistance in underground spaces ventilation. WIT Transactions on the Built Environment, vol. 102. pp. 12-23. [ Links ]
Galdo Vega, M.G., Arguelles Díaz, K.T., Fernández Oro, J.M., Ballesteros Tajadura, R., and Santolaria Morros, C. 2008. Numerical 3d simulation of a longitudinal ventilation system: Memorial Tunnel case. Tunnelling and Underground Space Technology, vol. 23, no. 5. pp. 539-551 [ Links ]
Guan J., Fang, J., Zhang, D., Wang, J., and Zhang, Y. 2013. Experiment study of oil tank fire characteristics dependent on the opening of tank top. Procedia Engineering, vol. 62. pp. 932-939. https://doi.org/10.1016/J.Proeng.2013.08.145 [ Links ]
Hargreaves, D.M. and Lowndes, I.S. 2007. The computational modeling of the ventilation flows within a rapid development drivage. Tunnelling and Underground Space Technology, vol. 22. pp. 150-160. [ Links ]
Krawiec, P., Wargula, T., DoROTA, C K., Pawel, J., Dziechciarz, A., and Kaczmarzyk, P. Chemical compounds released by combustion of polymer composites fat belts. Scientifc Reports, vol. 11. pp. 8269-1-8269-10. [ Links ]
MSHA. 2008. Conveyor belt combustion toxicity and smoke density. Mine Safety and Health Administration, Arlington, VA. [ Links ]
NIOSH. 1988, Emission products from combustion of conveyor belts. Report no. NIOSH/00185370. [ Links ]
Perzak, F.J., Litton, C.D., Mura, K.E., and Lazzara, C.P.1995. Hazards of conveyor belt fires. Report of Investigations 9570. US Bureau of Mines. [ Links ]
Prosser, B.S., Stinnette, J.D., and Paredes, J. 2002. Ventilation optimization at the La Camorra mine. Proceedings of 9th US Mine Ventilation Symposium, Queens University, Kingston, Ontario. Taylor & Francis. pp. 150-154. [ Links ]
Teacoach, K.A., Rowland, J.H., and Smith, A.C. 2010. Improvments in conveyor belt fire suppression systems for U.S. coal mines. Preprint: SME Annual Meeting, Phoenix, AZ, 28 February-3 March. https://stacks.cdc.gov/view/cdc/9660 [ Links ]
Wang Y, Jiang J., and Zhu D. 2009. Diesel oil pool fire characteristic under natural ventilation conditions in tunnels with roof openings. Journal of Hazardous Materials, vol. 166, no. 1. pp. 469-477. https://doi.org/10.1016/J.Jhazmat.2008.11.056 [ Links ]
Wang, D.Y., Liu, X.Q., Wang, J.S. Wang, Y.Z., Stec, A.A., and Hull, T.R. 2009. Preparation and characterisation of a novel fire retardant PET/a-zirconium phosphate nanocomposite. Polymer Degradation and Stability, vol. 94, no. 4. pp. 544-549. [ Links ]
 Correspondence:
C.O. Aksoy
Email: okay.aksoy@deu.edu.tr
Received: 10 Sept. 2021
Accepted: 13 Sept. 2023
Published: December 2023

