


Services on Demand
Article
 English (pdf)
 Article in xml format
 Article references
Indicators

Related links
-
 Cited by Google
 -
 Similars in Google
Share

 Permalink
Journal of the Southern African Institute of Mining and Metallurgy
On-line version ISSN 2411-9717
Print version ISSN 2225-6253
J. S. Afr. Inst. Min. Metall. vol.123 n.12 Johannesburg Dec. 2023
http://dx.doi.org/10.17159/2411-9717/1207/2023
PROFESSIONAL TECHNICAL AND SCIENTIFIC PAPERS
Use of a biocompatible polymer to enhance tailings transportation and reduce water consumption at a coper-cobalt-zinc plant
Y. JeongI; K. KimII
IKorea Mine Rehabilitation and Mineral Resources Corporation. ORCID: http://orcid.org/0000-0003-1898-5576
IISUAVAI Geo LLC, Ada, Oklahoma, USA. ORCID: http://orcid.org/0000-0002-3996-7150
SYNOPSIS
Excess water can lead to instability and even failure in tailings storage facilities (TSFs). Simply reducing the amount of water in TSFs could be the best way to ensure the safety of nearby communities. In this case study we investigated the effects of reducing the water content in tailings slurry at a copper-cobalt-zinc mine in Mexico. An environmentally friendly polymer was used as a drag reduction agent (DRA) to offset the increase in solids percentage. The potential effects of the increased solids concentration on the tailings transportation system were also assessed. A series of 'what if' studies was conducted to assess whether adding the polymer would allow the solids concentration to be increased without changing the pressure loss in the tailings pipeline. The studies entailed conducting pipe loop tests to investigate these changes under various solids/ polymer concentrations and then constructing a computational fluid dynamics (CFD) simulation model using the test results. The validated model was used to determine the optimal polymer percentages needed to maintain the same pressure loss under baseline (30% solids) conditions, and to assess the potential risks (clogging, increased erosion rates) to the pipelines. The potential water savings were found to be significant, varying from about 1.852 Mm3/a at 35% solids to 3.915 Mm3/a at 45% solids.
Keywords: pipe loop tests. computational fluid dynamics (CFD) simulation, TSF stability, tailings transportation, drag reduction agent.
Introduction
Tailings are the mixture of crushed rock and processing fluid from a mill plant that remains after economic minerals have been extracted (Lottermoser, 2007). Tailings storage facilities (TSFs) are the structures that are used to dispose of tailings, and raised embankments (surface impoundments) are the most common type. For economic reasons, the most popular method for moving tailings from a mill plant to a TSF is hydraulic transportation through pipelines in the form of slurry (Wilson, 2006). Key to the slurry's flowability is the solids concentration of the tailings, calculated as the weight of solids divided by the total weight of slurry. The required range (usually 30-50%) can be obtained by adjusting the water content or by the use of chemical additives - drag reduction agents (DRAs) - that work on the pipeline wall by decreasing the Reynolds shear stresses and velocity fluctuations. This reduces the friction between the slurry and the pipeline wall, resulting in a decrease of pressure loss (Warholic,, Massah, and Hanratty, 1999).
Managing TSF water is challenging for several reasons. TSFs are large in scale and may feature internal fractures; in addition, tailings properties vary. These challenges make it difficult to identify and control the phreatic surface, a key factor in TSF stability (Zandarín et al., 2009). Research has demonstrated the importance of controlling this surface. Rico et al. (2008) identified poor water management as the main cause of TSF failures based on an evaluation of 147 cases around the world. Numerical analyses by other researchers have shown that, in general, increasing the water level decreases the TSF factor of safety (Zadari, 2011; Coulibaly, Belem, and Cheng, 2017; Jeong and Kim, 2019). Moreover, the recent failure of Samarco's tailings embankment in Brazil emphasized the importance of water management to ensure TSF stability (Burritt and Christ, 2018).
One strategy for improving TSF water management is minimizing the water content in the tailings slurry. However, this also poses some challenges. In a conventional mine, modifying the water content requires modifying the tailings transportation system, which features a positive displacement pumping system for paste tailings and a conveyer belt system for filtered tailings. Consequently, various issues must be considered carefully before reducing the water content of tailings. One is the increased pressure loss in the transportation pipeline (Wilson, 2006). Note that this study defines pressure loss as the pressure drop per unit length of pipeline that is caused by energy dissipation, generally due to indiscriminate fluid motions (swirling) or friction between the tailings and pipe wall (Warholic, Massah, and Hanratty, 1999). In addition, pressure loss is a key parameter in determining the rheological behaviour of tailings slurry. It is used for selecting the type of pipeline, designing the pumping system, and determining the optimal range of water content in the slurry (Cooke, 2007). This study assumes that, if the pressure loss is kept constant, the rheological behaviour of the slurry remains the same regardless of changes in the solids concentration (Wilson, 2006; Cooke, 2007). Another issue is that reducing the water content increases the solids concentration, which in turn decreases the flow velocity of the slurry in pipelines. When the flow velocity is slower than the deposition velocity, clogging may occur (Abulnaga, 2002; Gillies et al., 2000). Finally, reducing the water content may cause pipelines to erode faster. Factors that contribute to erosion include, inter alia, flow velocity, particle size distribution, and solids concentration (Truscott, 1975). In general, erosion rates tend to increase with higher solids concentrations (Rong et al., 2011).
In this study, a new DRA was applied to enable the water content in tailings to be reduced with minimal changes of pressure loss. This DRA - a nonionic, tri-block amphiphilic polymer - is generally considered to be 'environmentally friendly' since it consists of two hydrophilic chains that exhibit relatively low toxicity to animals and humans (Webster et al., 2009). The potential beneficial and adverse effects of the DRA on the tailings transportation system were investigated at the request of the testing mine. Note that a patent application is currently in process for the use of the polymer as a new DRA (Provisional Patent US Application no. 62/571,115).
Testing site
A case study was conducted at a copper-cobalt-zinc mine in northern Baja California Sur, Mexico, near the shores of the Gulf of California. The facility currently operates both open pits and underground mines and exploits manto-type ores.
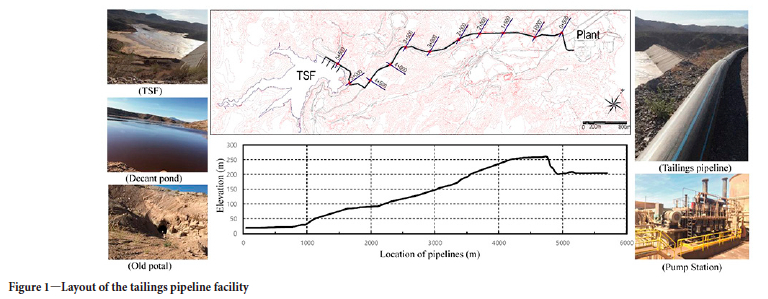
The plant generates an average of 12 000 dry metric tons of tailings per day. Before slurry is pumped to TSFs, the solids concentration (CW) is adjusted to about 30% by adding water at the neutralization tank. Three diaphragm piston pumps are currently used to pump the tailings at a capacity of 650 m3/h under a pumping pressure of 4.0 MPa. Figure 1 shows the routing of the pipelines. The plant lies at an elevation of 17 m above mean sea level (AMSL). Tailings are pumped to a peak elevation of 260 m AMSL over a distance of 5.7 km.
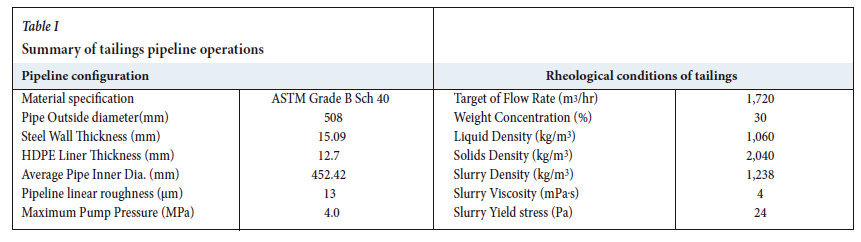
Table I summarizes the current tailings transportation system, which is constructed using 20-inch HDPE-lined carbon steel pipes. The pipes' outside diameter, 508 mm, includes the steel wall (15.09 mm) and the HDPE liner (12.7 mm). The designed capacity is 1720 m3/h, and the target solids concentration and density are 30% and 1238 kg/m3 respectively. The viscosity of slurry is 4 mPa-s, and the yield stress is 24 Pa. A Bingham-Plastic model was applied to design the pipeline facility (McKibben and Sun, 2006).
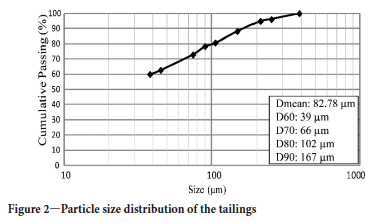
The particle size distribution of the tailings is shown in Figure 2. The mean particle size is 83 μm, and the D80 (80% passing size) is 102 μrn.
Given the climate conditions and the risk of seismic events, the TSF was designed as a downstream-type TSF, which is less vulnerable to earthquakes (Vick, 1990). One common feature of this type of TSF, the typical large amount of water in the decant pond, can pose a risk for inducing instability. Therefore, minimizing the amount of water in the pond can be beneficial for improving the stability of the TSF.
Experiments: DRA effects analysis
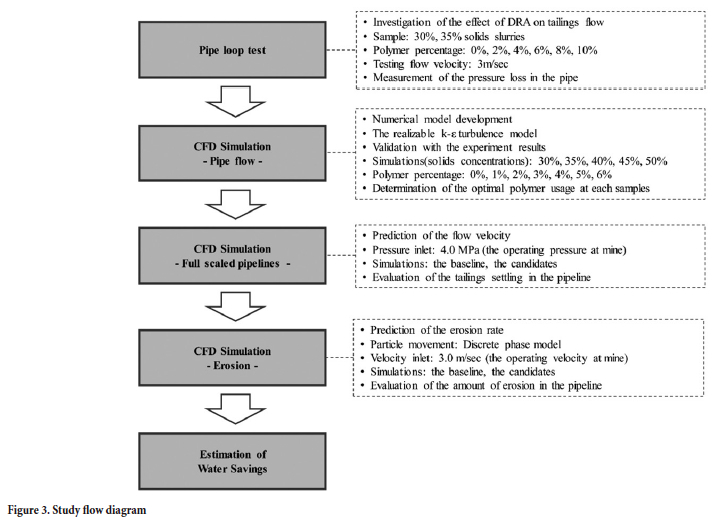
The use of the environmentally friendly polymer as a new DRA to reduce inflow to a TSF was investigated. Figure 3 outlines the studies that were conducted for this investigation. First, pipe loop tests were conducted to assess the change in pressure loss for a range of solids concentrations and polymer percentages in the tailings slurry. Then, computational fluid dynamics (CFD) simulations were conducted to determine the optimal polymer percentages that would be required to maintain a constant pressure loss at different solids contents. Real-scale CFD simulations mimicking the tailings transportation system were conducted to determine the deposition velocities that would induce settlement and clogging in the pipelines. Finally, pipeline erosion rates were predicted using CFD-based simulations.
Pipe loop tests
Pipe loop tests were conducted to investigate the effects of the DRA on tailings flow behaviour by measuring pressure losses at varied solids/polymer concentrations. Figure 4 shows the schematic layout of the pipe loop test system.
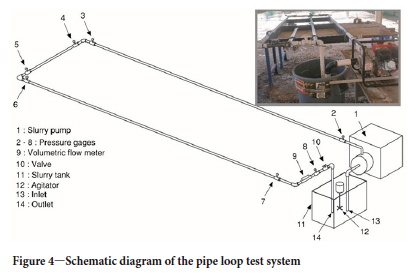
This testing system was a closed circuit consisting of polyvinyl chloride (PVC) pipe that totalled 10 m in length with an inner diameter of 38 mm. The slurry tank had a 190 l capacity, and a centrifugal pump could supply 36 m3 of slurry with a pumping pressure of 486 kPa. An agitator and digital flow meter were installed to mix the slurry and measure volumetric flow rates, respectively. The testing duration was limited to 10 minutes to minimize changes in the tailings' rheological properties that could result from the temperature increase.
Twelve test cases were investigated, with two solids percentages (30% and 35%) and six DRA percentages (from 0% to 10% in 2% increments). Pressure changes were monitored using gauges (no. 2-8, see Figure 4); however, only values from gauges 6 and 7 were recorded because they were unaffected by factors such as flow direction and pressure changes near pipe elbows and they provided relatively consistent results in each case. The testing site's flow velocity of 3 m/s was applied to the loop system.
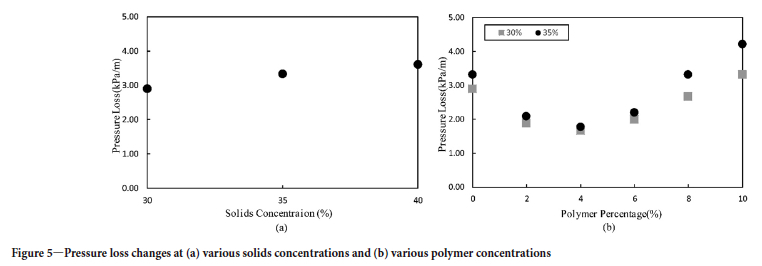
Before investigating the effects of the DRA, the rheological behaviour of the testing site's tailings slurry, which usually exhibits non-Newtonian flow behaviour (Boger, Scales, and Sofra, 2006), was investigated. Pre-DRA pressure loss changes were monitored under various solids concentrations. The results indicated a proportional relationship, as shown in Figure 5a; therefore, the slurry can be assumed to follow the principles of non-Newtonian flow, where an increase in solids percentage induces an increase of pressure loss in the pipeline (Wilson, 2006).
The effect of the new DRA on pressure loss are shown in Figure 5b. Pressure loss decreased as the polymer content was increased from 0% to 4%, and then increased as the polymer content was increased from 4% to 10%. This indicates that the optimal polymer concentration for minimizing the pressure loss is about 4%. Further studies are required to determine the reason for the increased pressure loss in the 4-10% range; however, the authors believe this could be related to the DRA's solubility in that percentage range.
CFD simulations to determine the optimal polymer concentrations
ANSYS FLUENT (V. 18.2) software was used to analyse the rheological behaviour of the tailings slurry with realizable k-ε turbulence (ANSYS, 2011). This is one of most popular turbulence models for investigating practical engineering flow issues (Wilcox, 1998; Rolander et al., 2006).
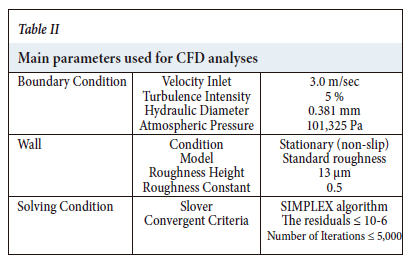
Figure 6 shows the 3D computational mesh used in this study. The geometry was discretized using 107 136 nodes, 375 950 elements, and triangular grids. The main parameters used for the CFD simulations are listed in Table II.
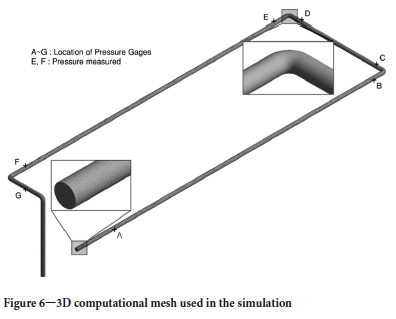
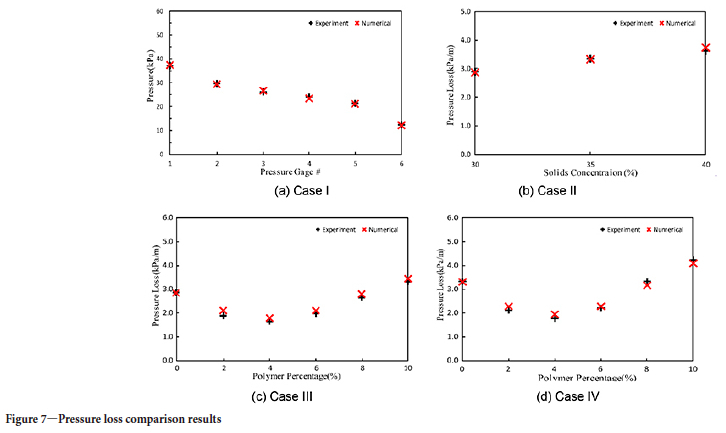
To validate the model, four case studies using CFD simulations were conducted and the simulated pressure loss values compared to data from pipe loop tests. These cases are shown below, and the results of the pressure loss comparisons are depicted in Figure 7. The cases were designed to investigate the following:
Case I: Pressure loss value at each gauge under baseline conditions (30% solids, 0% polymer)
Case II: Effect of increasing the solids concentration on pressure loss
Case III: Effect of increasing the polymer concentration on pressure loss at 30% solids
Case IV: Effect of increasing the polymer concentration on pressure loss at 35% solids
In cases I and II, the pressure loss values at each gauge were simulated and compared to values from the pipe loop tests. In cases III and IV, the effects of increasing the polymer concentration on pressure loss were investigated at 30% and 35% solids concentrations, respectively, while increasing the DRA concentration from 0% to 10% in 2% increments. For these cases, pressure loss was recorded at points E and F (gauges 6 and 7 in Figure 4). As shown in Figure 7, all cases corresponded to the simulated results and showed similar trends, validating the model for use in further studies.
The model was then used to investigate 35 cases with various percentages of solids (five cases, from 30% to 50% in 5% increments) and polymer (seven cases, from 0% to 6%,in 1% increments). The flow velocity was set at 3.0 m/s to mimic field conditions and the pressure loss was measured at points E and F (see Figure 6). A tailings slurry consisting of 30% solids and 0% polymer was defined as the baseline to mimic the current operational conditions. It was assumed that the rheological flow behaviour of the slurry before and after adding the DRA would remain the same if the pressure loss remained constant; therefore, an increase in pressure loss would indicate a decrease in flow efficiency and vice versa. The simulation results are shown in Figure 8.
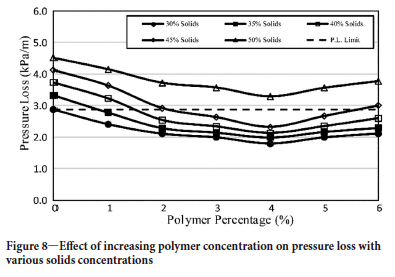
Pressure loss decreased when the polymer concentration increased from 0 to 4%, and then increased when polymer concentrations were in the range of 4-6%. In the 50% solids case, the pressure level of 3.0 kPa/m for the baseline condition could not be achieved even though the polymer percentage was enhanced; pressure loss values at 50% solids were higher than the baseline for all polymer concentrations. Therefore, 45% solids was determined to be the maximum possible level, and the 50% solids case was not considered in subsequent tests.
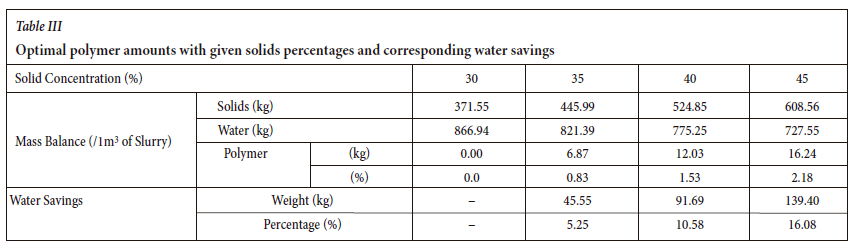
Based on the results shown in Figure 8, the optimal polymer percentages required to maintain the baseline pressure loss were determined for solids percentages of 35%, 40%, and 45%. The corresponding amount of water savings at each percentage was calculated and is shown in Table III. For example, increasing the solids content from 30% to 40% results in a 10.58% water savings, equivalent to 0.09 m3 (91.69 kg in weight) per 1 m3 of tailings slurry. The pressure loss at 40% solids could be maintained by adding 1.53% polymer (the polymer percentage is obtained by dividing the polymer weight by the weight of water in the tailings slurry). The results demonstrate the potential for using the DRA to reduce the water content in the slurry at the testing site. To calculate the water saving percentages in Table III, the solids concentration was defined as the weight of solids divided by the total weight of slurry (solids + water + polymer); therefore, 35% solids corresponds to 445.99 kg of solids, 821.39 kg of water, and 6.87 kg of polymer. Since the amount of water at 30% solids slurry (the baseline) was 866.94 kg, the water savings at 35% solids was calculated to be 5.25% as follows: (866.94 - 821.39)/866.94*100.
CFD simulations to evaluate settling velocity
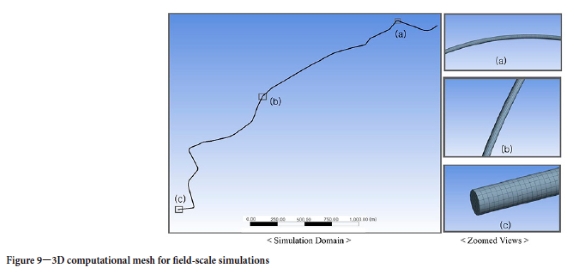
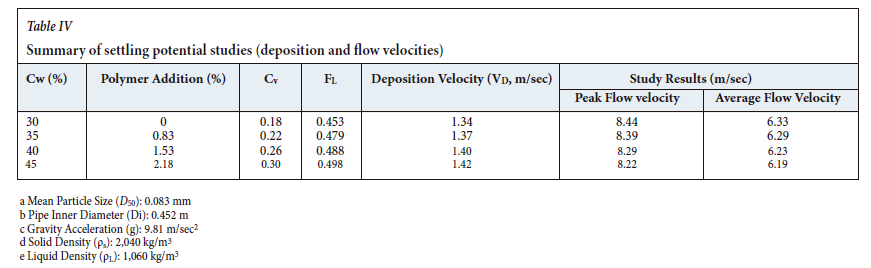
Flow velocities were investigated when solids concentration percentages were changed from the 30% baseline case to 35%, 40%, and 45%. To evaluate the potential for solids particles to settle in the slurry, the field-scale CFD model shown in Figure 9 was used and flow velocities were compared with deposition velocities. Note that solids particles start to settle and form a moving bed (inducing clogging in pipelines) when the deposition velocity exceeds the flow velocity (Abulnaga, 2002). The deposition velocity equation proposed by Durand and Condolios (1952) was employed in this study and is shown in Equation [1].
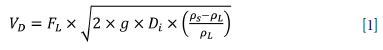
where Vd is the deposition velocity (m/s), Fl is the Durand factor based on grain size and volume concentration (unitless), Di is the inner pipe diameter (m), g is the gravity acceleration constant (9.81 m/s), ps is the density of solids in a mixture (kg/m3), and pL is the density of the liquid carrier (kg/m3). For the Durand velocity factor, Equation [2] proposed by Schiller and Herbich (1991) was used. Deposition velocities calculated using Equations [1] and [2] are shown in Table IV.

where Cv is the solids volume concentration of slurry (fraction) and d50 is mean particle size (mm).
Figure 9 shows the 3D computational mesh used for field-scale simulations. It features the same geometry used for the testing mine's pipeline profile. The mesh consists of 2 075 865 nodes and 1 596 691 elements. A hexahedral structured mesh was adapted to mesh the entire volume. The modelling distance ranged from 0+000 to 4+762 km, which corresponds to the location of the peak elevation. Since the flow velocity is controlled mainly by gravity once the slurry reaches the peak elevation, the simulations were designed to examine velocity changes under turbulent flow that originate mainly under high pressure from a pumping system.
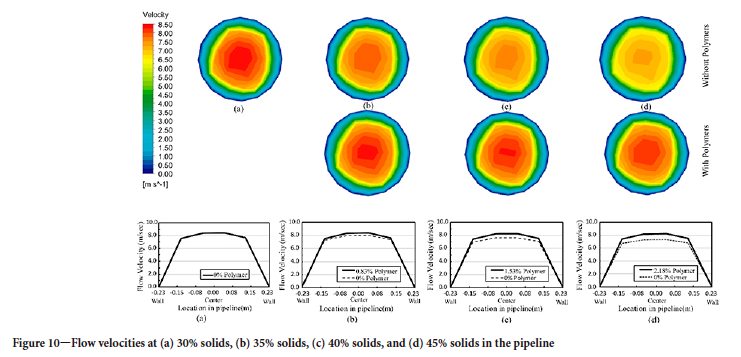
The same parameters listed in Table II were used for the simulations. In addition, a pressure inlet condition of 4.0 MPa and an inner (hydraulic) pipeline diameter of 452.42 mm were used as model inputs. Figure 10 shows flow velocities for four solids percentages - 30%, 35%, 40%, and 45% - before and after adding the polymer. Simulations for flow velocities were conducted for 35%, 40%, and 45% solids before and after adding the polymer (six cases) plus the baseline case (30% solids, with no polymer) as shown in Figure 10. To maintain the same pressure loss as the baseline, polymer was added at concentrations of 0.83%, 1.53%, and 2.18% for 35%, 40%. and 45% solids, and peak flow velocities were changed from 7.99, 7.61, and 7.29 m/s to 8.39, 8.29, and 8.22 m/s, respectively. The peak flow velocity for the baseline condition was 8.44 m/s.
The simulation results showed that peak flow velocities decreased as solids percentages increased and that adding polymer increased these velocities by 5.0% (35% solids), 9.0% (40% solids), and 12.7% (45% solids). This demonstrates that the polymer effectively mitigates the decrease in flow velocity that occurs when solids concentrations are increased, which would otherwise increase the friction between the flow media and pipeline wall. Therefore, the DRA has the potential to reduce the amount of water in tailings slurry and improve TSF stability.
The potential for settling (and associated pipeline clogging) as the solids percentage increases was investigated by comparing deposition and flow velocities. The results of the studies are summarized in Table IV. For all solids percentage cases, the deposition velocities were definitively slower than the flow velocities; therefore, the potential for settling is minimal.
The studies discussed above indicate that the polymer has the ability to mitigate concerns related to pipeline clogging and friction-induced wear when the solids concentration is increased. To further investigate the effects of increased friction, simulations were conducted to quantify the erosion rate of pipelines.
CFD simulations to calculate erosion rates of pipelines
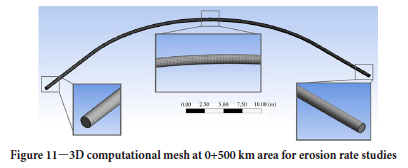
ANSYS FLUENT was used to model the erosion rates of pipelines when optimal polymer enhancement is applied to the slurry. A 0+500 km area was selected since it is the most curved and would therefore undergo the highest erosion rate (Wood and Jones, 2003). Figure 11 shows the 3D computational mesh for the area used in the simulations. A hexahedral structured mesh was built with 128 763 nodes and 120 320 elements.
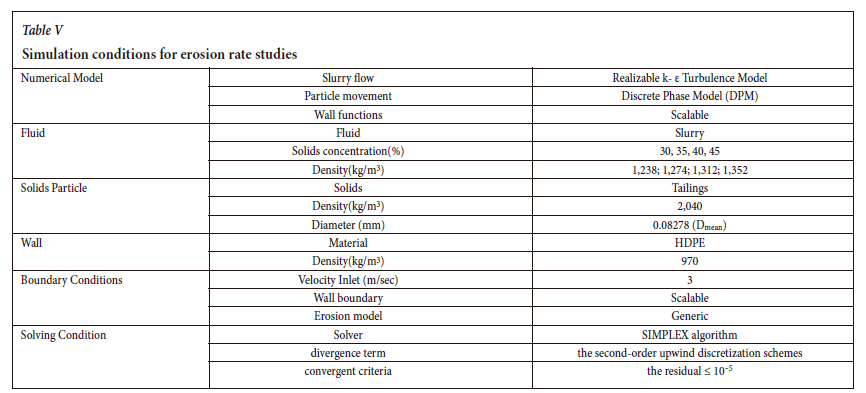
The simulations use a discrete phase model (DPM) for investigating particle movements and the realizable k-£ turbulence model for investigating slurry flows in the pipeline. Flow behavior of the tailings slurry was investigated for 30%, 35%, 40%, and 45% solids concentrations enhanced with the optimal polymer concentrations (0%, 0.83%, 1.53%, and 2.18%, respectively). Solids particles were injected uniformly at the inlet area with the same fluid flow velocity. Note that the mean particle size was used rather than the actual particle size distribution shown in Figure 2 in order to simplify the simulation for the purpose of examining the effect of the DRA. The wall boundaries were set with a scaleable function as 'reflect' and the outlet boundary was set as 'escape'. The SIMPLEX algorithm was used to investigate pressures and velocities in the pipelines. Detailed simulation conditions are listed in Table V.
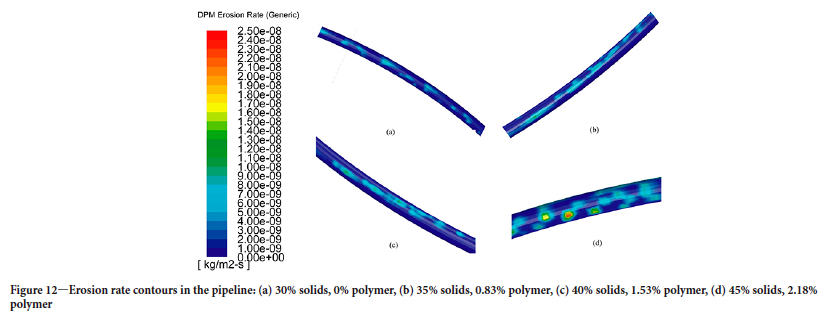
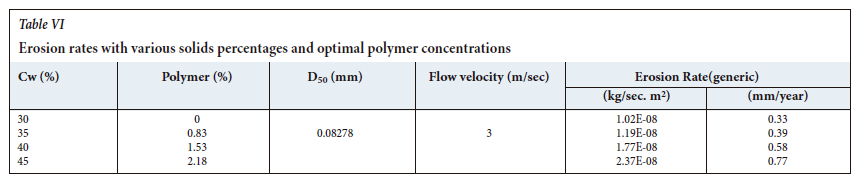
Figure 12 shows the results of the erosion rate simulations. The contours show erosion rates increasing proportionally with increased solids concentrations, regardless of whether polymer was added. The simulation results are detailed in Table VI.
Consequently, it was concluded that the polymer did not significantly affect the erosion rate and that this rate was instead driven by the solids concentration. Further studies to investigate pipeline erosion rates with the given tailings slurry were conducted based on the daily throughput at the testing site.
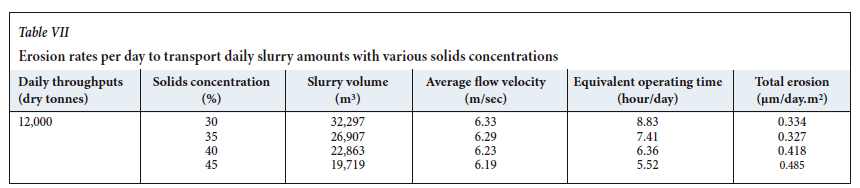
Flow velocity varies in response to the automated operating system at the testing site. This system automatically manipulates the pump stroke and number of operating pumps based on the amount of tailings slurry in the tank. This study assumed that the tailings transportation system had a consistent flow velocity and that the operating time to transport the slurry could represent the efficiency of transportation with the given daily throughput. Table VII summarizes the results. The daily throughput at the site was around 12 000 dry metric tons, and daily volumes of tailings that required transport were 32 297 m3, 26 907 m3, 22 863 m3, and 19.719 m3 when solids percentages were 30%, 35%, 40%, and 45% respectively. Average flow velocities were obtained from the data in Table IV. Equivalent operating times were determined based on the average flow velocities and daily slurry volumes. Since the slurry volume decreased as the solids concentration increased for the given daily throughput, the operating times (hours/day) were decreased accordingly - from 8.83 hours to 7.41 hours (35% solids), 6.36 hours (40% solids), and 5.52 hours (45% solids).
These daily erosion rates were calculated, as shown in Table VII: 0.334 μm for 30% solids and 0% polymer (baseline), 0.327 μm for 35% solids and 0.83% polymer, 0.418 μm for 40% solids and 1.53% polymer, and 0.485 μm for 45% solids and 2.18% polymer. In the case of 35% solids, the erosion rate per year (Table VI) increased from 0.33 mm (baseline) to 0.39 mm but, due to the reduced operating time, the daily erosion rate with the given slurry volume decreased from 0.334 μm to 0.327 μm.
Field application - Potential water saving at the test mine
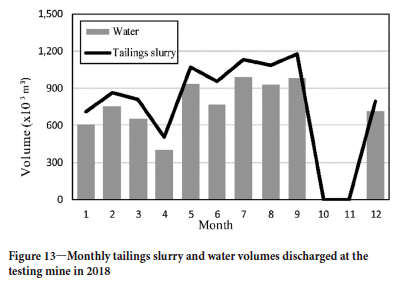
About 9 Mm3 of tailings slurry was discharged at the testing mine in 2018, with about 7.7 Mm3 of water being used for transportation. Figure 13 shows the monthly volumes of tailings slurry and water discharged at the site. Because of various circumstances, such as periodic maintenance and emergency shutdowns, these volumes varied. The average monthly slurry discharge was 0.91 Mm3, which includes 0.773 Mm3 of water.
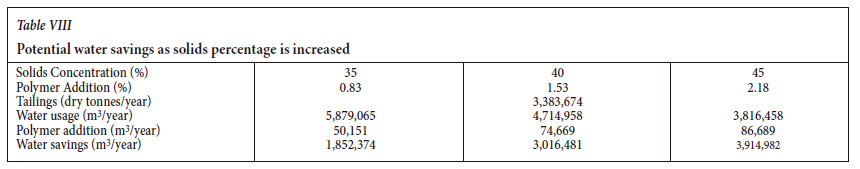
The potential water savings that could be achieved by adding polymer was estimated based on the simulations and the discharge record. The total discharge of tailings at the testing site was about 3.384 Mt (dry) in 2018. Note that the solids concentration at that time was 30%.
As shown in Table VIII, the amount of water required to transport 3.384 Mt (dry) of tailings at each solids percentage was calculated as 5.879 Mm3 (35% solids), 4.715 Mm3 (40% solids), and 3.816 Mm3 (45% solids). To maintain the same pressure loss, the required polymer amounts were 50 151 m3 (35% solids); 74 669 m3 (40% solids); and 86 689 m3 (45% solids). These increases in solids result in 1.852 Mm3, 3.016 Mm3, and 3.915 Mm3 of water savings per year, respectively.
Conclusions and future work
This study investigated two major aspects of reducing the amount of water in the tailings slurry at the test mine: the effect on the tailings transportation system and the use of a polymer as a new DRA to offset the effects of increasing the percentage solids in the slurry.
► The optimal polymer percentages were 0.83%, 1.53%, and 2.18% for 35%, 40%, and 45% solids, respectively. Note that these percentages are designed to maintain the same pressure loss as the baseline condition.
► The average flow velocity in the pipeline was 6.33 m/s under the baseline condition (30% solids, 0% polymer). When optimal polymer percentages were applied (0.83% for 35% solids, 1.53% for 40% solids, and 2.18% for 45% solids), the expected flow velocities were 6.29 m/s, 6.23 m/s, and 6.19 m/s, respectively. As the solids percentage increased, flow velocities decreased slightly, regardless of the addition of polymer. The deposition velocity ranges of 1.34-1.42 m/s were definitively lower than the flow velocities, indicating a minimal chance of pipeline clogging.
► Erosion rates increased as solids concentration increased, with one major exception - the 35% solids case. For a daily tailings throughput of 12 000 t (dry), the erosion rate decreased from 0.334 μm/d (30% solids, baseline case) to 0.327 μm/d. For the cases simulated with 40% and 45% solids, erosion rates exceeded those of the baseline condition.
► The potential water savings was calculated based on the mine's daily throughput of 12 000 t (dry) and a solids percentage of 35%, which could likely be achieved without modifying the tailings transportation system. Increasing the solids to 35% would require applying polymer at the rate of 50 151 m3/a. This would not only result in water savings of 1.852 Mm3/a but would also reduce the erosion rate of the pipeline walls, thereby reducing maintenance costs, and could improve TSF stability, thereby reducing the risk of failure.
► Currently in the international patenting process, the polymer used in this study also has another key benefit: controlling dust on dried tailings beach areas in upstream-type TSFs. If there are resident communities near a TSF, then these benefits could justify the cost of the polymer.
Future work
The results of this investigation suggest that applying the polymer in the field is still premature. Further studies are needed to assess its potential negative effects on the stability of TSFs and mill processing. Additional studies are required to check that the polymer does not affect the geotechnical properties of the deposited tailings, especially the friction angle which is a key factor for the stability of upstream TSFs. Water from discharged tailings in TSFs is collected in a decant pond and recycled to the mill. The authors tested the polymer's effect on flotation at several copper mines, with varying results; some showed no effects but in others the recovery decreased, indicating that this negative effect may be site-specific. In addition, this study investigated various solids concentrations from 30% to 50%, in 5% increments. However, this increment should be reduced (for example, to 1%) in future studies to determine the optimal solids and polymer concentrations for maximizing water savings and minimizing total costs. Finally, detailed economic feasibility studies are required before the polymer can be used as a new DRA. These studies should consider both the polymer's benefits (water savings, possible increased TSF stability, less pipeline erosion, and dust control) as well as its potential negative effects (clogging issues, cost, and impacts on mill processing).
Conflict of interest statement
The authors report no conflicts of interest. The authors alone are responsible for the content and writing of this article.
References
Abulnaga, B.E. 2002. Slurry Systems Handbook. McGraw-Hill, New York. [ Links ]
ANSYS. 2011. ANSYS FLUENT user's guide. Canonsburg, PA. [ Links ]
Boger, D.V., Scales, P.J., and Sofra, F. 2006. Rheological concepts. Paste and Thickened Tailings - A Guide (2nd edn). Jewellm, R.J. and Fourie, A.B. (eds). Australian Centre for Geomechanics, Perth. [ Links ]
Brend Lottermoser, G. 2007. Mine Wastes, Characterization, Treatment and Environmental Impacts (2nd edn). Springer, Berlin, Heidelberg, New York. [ Links ]
Burritt, R.L. and Christ, K.L. 2018. Water risk in mining: Analysis of the Samarco dam failure. Journal of Cleaner Production, vol. 178. pp.196-205. [ Links ]
Cooke, R. 2007. Thickened and paste tailings pipeline systems: Design procedure -Part 2. Proceedings of the International Seminar on Paste and Thickened Tailings, Limerick, Ireland. Australian Centre for Geomechanics, Perth. [ Links ]
Coülibaly, Y., Belem, T., and Cheng, L. 2017. Numerical analysis and geophysical monitoring for stability assessment of the Northwest tailings dam at Westwood Mine. International Journal of Mining Science and Technology, vol. 27, no. 4. pp. 701-710. [ Links ]
Durand, R. and E. Condolios. 1952. Experimental investigation of the transport of solids in pipes. Proceedings of Deuxieme Journée de l'hydraulique. Societé Hydrotechnique de France. pp. 29-55. [ Links ]
Gillies, R.G., Schaan, J., Sumner, R.J., McKibben, M.J., and Shook, C.A. 2000. Deposition velocities for Newtonian slurries in turbulent flow. Canadian Journal of Chemical Engineering, vol. 78, no. 4. pp. 704-708. [ Links ]
Jeong, Y. and Kim, K. 2019. A case study: Determination of the optimal tailings beach distance as a guideline for safe water management in an upstream TSF. Mining, Metallurgy & Exploration, vol. 37. pp. 141-151. [ Links ]
McKibben, M. and Sun, R. 2006. Rheology testing of Boleo oxide ore tailings using SRC's 75mm flow loop. Saskatchewan Research Council, Pipeflow Technology Centre Energy Division, Saskatoon, Canada. [ Links ]
Rico, M., Benito, G., Salgueiro, A.R., Dîez-Herrero, A., and Pereira, H.G. 2008. Reported tailings dam failures: A review of the European incidents in the worldwide context. Journal of Hazardous Materials, vol. 152, no. 2. pp. 846-852. [ Links ]
Rolander, N., Rambo, J., Joshi, Y., Allen, J.K., and Mistree, F. 2006. An approach to robust design of turbulent convective systems. Journal of Mechanical Design, vol. 128, no. 4. pp. 844-855. [ Links ]
Rong, H., Peng, Z., Hu, Y., Wang, C., Yue, W, Fu, Z., and Lin, X. 2011. Dependence of wear behaviors of hard metal YG8B on coarse abrasive types and their slurry concentrations. Wear, vol. 271, no. 7-8. pp. 1156-1165. [ Links ]
Schiller, R.E. and Herbich, P.E. 1991. Sediment transport in pipes. Handbook of Dredging. Herbich, P.E. (ed.). McGraw-Hill, New York. [ Links ]
Truscott, G.F. 1972. A literature survey on abrasive wear in hydraulic machinery. Wear, vol. 20, no. 1. pp. 29-50. [ Links ]
Vick, S.G. 1983. Planning, Design, and Analysis of Tailings Dams. Wiley, New York. [ Links ]
Warholic, M.D., Massah, H., and Hanratty, T.J. 1999. Influence of drag-reducing polymers on turbulence: effects of Reynolds number, concentration and mixing. Experiments in Fluids, vol. 27, no. 5. pp. 461-472. [ Links ]
Webster, R., Elliott, V., Park, B.K., Walker, D., Hankin, M., and Taupin, P. 2009. PEG and PEG conjugates toxicity: towards an understanding of the toxicity of PEG and its relevance to PEGylated biologicals. PEGylated Protein Drugs: Basic Science and Clinical Applications. Veronese, F.M. (ed.). Birkhäuser, Basel. pp. 127-146. [ Links ]
Wilcox, D.C. 1998. Turbulence Modeling for CFD. Vol. 2. DCW industries, La Canada, CA. pp. 172-180. [ Links ]
Wilson, K.C., Addie, G.R., Sellgren, A., and Clift, R. 2006. Slurry Transport using Centrifugal Pumps. Springer Science & Business Media. [ Links ]
Wood, R.J.K. and Jones, T.F. 2003. Investigations of sand-water induced erosive wear of AISI 304L stainless steel pipes by pilot-scale and laboratory-scale testing. Wear, vol. 255, no. 1-6. pp. 206-218. [ Links ]
Zardari, M.A. 2011. Stability of tailings dams: Focus on numerical modelling. Doctoral dissertation, Luleå Tekniska Universitet. [ Links ]
Zandarín, M.T., Oldecop, L.A., Rodríguez, R., and Zabala, F. 2009. The role of capillary water in the stability of tailing dams. Engineering Geology, vol. 105, no. 1-2. pp. 108-118. [ Links ]
 Correspondence:
K. Kim
Email: kimkm@email.arizona.edu
Received: 3 May 2020
Accepted: 9 Oct. 2023
Published: December 2023

