


Serviços Personalizados
Artigo
 Inglês (pdf)
 Artigo em XML
 Referências do artigo
Indicadores

Links relacionados
-
 Citado por Google
 -
 Similares em Google
Compartilhar

 Permalink
Journal of the Southern African Institute of Mining and Metallurgy
versão On-line ISSN 2411-9717
versão impressa ISSN 2225-6253
J. S. Afr. Inst. Min. Metall. vol.123 no.10 Johannesburg Out. 2023
http://dx.doi.org/10.17159/2411-9717/1047/2023
PROFESSIONAL TECHNICAL AND SCIENTIFIC PAPERS
Assessment of coal washability data obtained via the RhoVol analyser
D. StoneI, *; Q.P. CampbellI; M. le RouxI; M. FofanaII
INorth-West University, Potchefstroom, South Africa. ORCID: Q.P. Campbell: http://orcid.org/0000-0003-0510-6018. ORCID: M. le Roux: http://orcid.org/0000-0002-9330-426X
IIDebTech, Johannesburg, South Africa
SYNOPSIS
Float-and-sink analysis is widely used in the coal industry to obtain washability data, yielding important information about beneficiation potential and performance. This method is associated with health and environmental problems, and research into alternative densimetric methods is important. The RhoVol is a new technology developed by De Beers Group Technology South Africa (DebTech) for the image-based generation of densimetric data from ores. The analysis is done on a per-particle basis, within a size range of +3 mm -8 mm. In this paper we compare the established methods used for the float-and-sink analysis of coal with a new method using RhoVol. The aim of the study was to determine the validity of the information obtained from the RhoVol analyser by performing comparative densimetric analysis on three different coal samples. The results showed that the RhoVol method was more rapid, safe, and precise, but tended to consistently underestimate the density of the coal sample, probably due to varying coal porosity.
Keywords: coal, float-and-sink analysis, RhoVol, washability determination.
Introduction
Environmental concerns and legislative restrictions on the coal industry, along with depleting high-quality coal reserves in South Africa, serve as motivation for the improvement of efficiency at coal washing facilities. Any efficient gravity-based beneficiation process requires a thorough understanding of the density profile of the material. The washability curve is frequently used to quantify the densimetric data of coal on washing plants (King, 2012).
The data required for the construction of washability curves is obtained by doing float-and-sink analysis, where a sample is separated into relative density fractions by using a dense-liquid medium. Problems related to float-and-sink analysis include the high cost of dense media, adverse health and environmental effects, and long turnaround times.
The RhoVol, which is a 3D image-based densimetric measurement system developed by DebTech, gives vital information on a material's density profile. This is done by means of camera-based measurements on a per-particle basis.
Published work on the RhoVol is limited to a study by Fofana and Steyn (2018), who compared densimetric analysis of kimberlite material using the float-and-sink method to results from RhoVol. They obtained by the RhoVol method. The current investigation expands on the previous study, using coal as a test material.
Literature survey
Float-and-sink tests
Float-and-sink analysis is a common laboratory method performed on ores to obtain densimetric data, thereby assessing the suitability of dense medium separation and determining the economic separation density of an ore (Wills and Napier-Munn, 2006). It is still considered the most effective flotation technology to separate ores based on density (Kong et al., 2018). Float-and-sink analysis delivers densimetric data by reporting particle separation based on the mass fraction of the sample. The usefulness of the results is determined by the width and number of density class intervals considered.
A standard float-and-sink test is conducted as follows. Heavy liquids covering a range of desired densities in incremental steps are prepared, and the sample is introduced to the liquid of the lowest density. After sufficient time is allowed for settling, the floats product is removed, washed, dried, and weighed while the sink product is washed and placed in the next heavy liquid. These steps are repeated until the last density fraction is obtained, from which both floats and sinks are washed, dried, and weighed (SANS 7936:2010).
Coal is graded according to its ash-forming mineral content, with higher ash values resulting in lower grades (Wills and Napier-Munn, 2006). Since there is a direct correlation between the ash-forming minerals within the coal and the coal density (Sivrikaya, 2014), the data obtained from the float-and-sink analysis is an indication of the quality of a coal. The shape of the washability distribution also provides information about the difficulty of separation, as well as the yield and expected efficiencies and specified cut-points (Sahu, Chaurasia, and Sursh, 2018). Float-and-sink analyses are routine on coal preparation plants. The results are used to evaluate and cross-check the washability characteristics of the coal and determine the process performance (Bhattacharya and Anand, 1998).
Due to the high cost of heavy media and the adverse health and environmental effects of organic liquids, float-and-sink analysis is an unfavourable method for densimetric analysis (Aktas, Karacan, and Olcay, 1998). For fine particles below about 1 mm, the method is extremely time-consuming due to long settling times (Franzidis and Harris, 1986).
Coal porosity and moisture content are important factors affecting float-and-sink results. Inefficient separation of floats and sinks occurs when the coal moisture content is too high (Aktas, Karacan, and Olcay, 1998). This is because during the procedure ZnCl2 solution fills the empty macropores of the coal. Any moisture present within the coal pores dilutes the ZnCl2 solution, decreasing its density. Since the solution diffuses far into the pores, a density gradient is formed, extending from the inside of the pore to the coal particle surface. This leads to a variation of both the liquid density and the apparent density of the particle (Aktas, Karacan, and Olcay, 1998). This could result in particles reporting to the incorrect density fraction, compromising the results.
Permeation of ZnCl2 into coal pores remains a problem after float-and-sink analysis. The ZnCl2 solution cannot be removed, even after prolonged washing. During drying, all moisture is removed from the coal and the precipitated salt remains within the pores. All salt retained within the coal create numerous adverse effects; the additional mass compromises float-and-sink results when dried samples are weighed, and ZnCl2 increases the apparent ash value obtained from proximate analysis is performed (Campbell, le Roux, and Smith, 2015).
The RhoVol density analyser
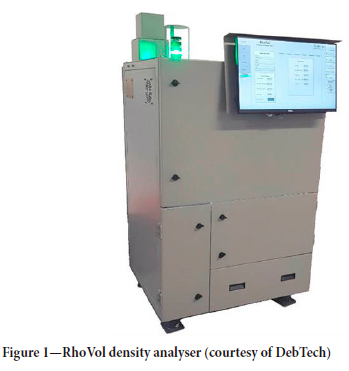
The RhoVol analyser (Figure 1) can be described as a densimetric measurement system that determines the density of an ore by weighing and estimating the volumes of individual particles (Fofana and Steyn, 2018). Along with the weight and volume parameters, the RhoVol also gives information concerning particle density, size, and shape. Shape descriptors include compactness, flatness, and elongation (DebTech, 2018).
The machine operates in an automated batch process mode, processing an d 1000 particles an hour. During operation, the RhoVol is capable of sorting the sample into ten discThere are tTwo models -a fine particle analyser for the size range between 3 mm and 8 mm (the version used in this investigation), and a coarse unit for the size range between 8 mm and 25 mm. The samples are required to be correctly sized before analysis and free of fines/dust.
The sample is presented to the RhoVol by means of two vibratory feeders - a primary feeder and a bowl feeder (Fofana and Steyn, 2018). The feeders both vibrate at the resonance frequency of the sample particles, allowing the particles to progress forward and ensuring that the particles are fed to the RhoVol individually. The particles are then dropped to a high-speed weighing cell to ensure accurate measurement of particle mass. The particle mass limits are 6 mg to 150 g (DebTech, 2018).
The shape and volume parameters are determined from a 3D reconstruction generated by the analysis of multiple images (silhouettes) of a particle captured by seven cameras situated within the machine. These cameras are set up at different angles to capture different silhouettes of the particles while airborne, and a 3D model, called the visual hull, is generated (Mangera, Morrison, and Voight, 2016). By definition, a visual hull is the single largest object that is consistent with a finite set of available silhouettes (Forbes, Voight, and Bodika, 2003).
Of the many approaches used to reconstruct 3D objects from 2D images, silhouette-based reconstruction is among the most popular options (Franco and Boyer, 2003). This is mostly due to the robustness of the algorithms and the easy implementation thereof (Franco and Boyer, 2003).
Visual hulls are only approximations of an object's shape and volume and there is much room for error. An issue with the visual hull approach is its inability to discriminate between different nonconvex objects. Any physical feature of a particle that might lie in a concavity will not manifest in any possible silhouette (Laurentini, 1994).
It has been shown in previous studies that visual hull-based volume reconstruction methods will always overestimate the particle volume (Forbes, Voight, and Bodika, 2003). This is also true for the RhoVol, where mean volume estimation errors of up to 20% have been found (Mangera, Morrison, and Voight, 2016). Mangera, Morrison, and Voight (2016) determined the discrepancy between the true volume ('ground truth' volume) and the visual hull-generated volume for three different particle shapes - round (BB1), elongated (EL3), and flat (FL1). The results can be seen in Figure 2.
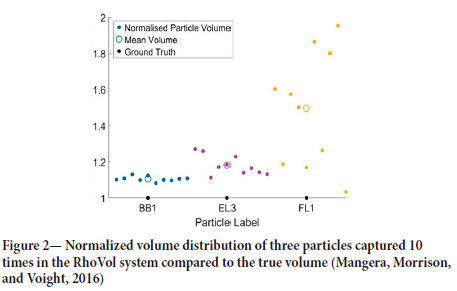
From Figure 2, two things are clear. The first is that the RhoVol consistently overestimates the volume of all the particles it analyses. The second is that the particle shape plays a large role in the degree of overestimation. It can be seen, by the normalized particle volume distribution, that the RhoVol is better at consistently determining the volumes of round particles than it is for flat particles. The effect of shape on the volume estimation is mainly due to particle orientation. According to Mangera, Morrison, and Voight (2016) and Forbes, Voight, and Bodika (2003), varying orientations of particles allows different silhouettes to be fpresented, creating vastly different visual hulls.
To account for the volume overestimation and orientation problems, two systems are used to increase the accuracy of the visual hulls generates RhoVol. The first is a multi-pass mode, which allows for the reprocessing of a sample multiple times (DebTech, 2018). When doing this, the RhoVol has the capability to recognize an individual particle based on its stored database of silhouettes and particle masses. When it recognizes a particle again, the silhouettes from the first pass are combined with those of the second pass to construct a more reliable 3D model of the particle, increasing accuracy. The more silhouettes the RhoVol obtains of a single particle, the more accurately a visual hull can be constructed. However, the ultimate volume of a coal particle cannot be accurately determined since RhoVol cannot determine he porosity and surface texture of the material.
The second system used to improve accuracy is the dynamic correction factor. Since the error of the visual hull is largely shape-related, RhoVol can apply a shape-dependent volume correction factor. The correction factor can be determined experimentally, comparing the RhoVol volumes to volumes calculated using other methods such as pycnometry. Although shape plays a major role in the correction factor, it should be noted that the correction factor may also differ for various materials, based on their intrinsic nature.
Experimental
Coal samples
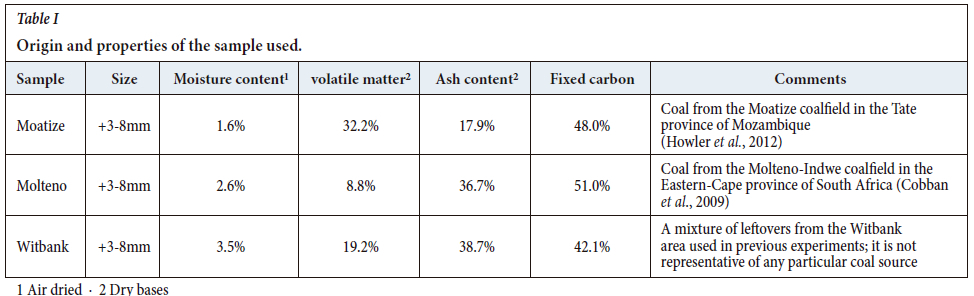
Three coal samples from different sources were used in the study, as described in Table I. The samples were screened to exclude any +8 mm and -3 mm materials, which are the limits of the particular RhoVol machine that was used. Sufficient material was prepared for all the analyses to be performed.
Float-and-sink analysis
The float-and-sink analyses were executed according to SANS 7936:2010. Zinc chloride standard solutions were prepared, with densities ranging from 1.2 to 1.8 in increments of 0.1. For all coals, the testing was done in ascending order of relative density. To prevent coal fines and other contaminants form affecting the results, the relative densities of each of the solutions were re-measured after every float-and-sink iteration. Where any deviations were found, the appropriate corrections were made. Three repeats were done for each coal species.
After each test, the remaining solution on the samples was removed by prolonged washing with water. The samples were air-dried in an oven for approximately 14 hours at 110°C, in accordance with SANS 589:2009. After drying, each sample was weighed, bagged, and tagged.
RhoVol analysis
The RhoVol BDD127SM density analyser at the DebTech campus in Crown Mines, South Africa, was used for the analysis. The entire population of the sample was subjected to RhoVol analysis. For each type of coal, a sample of about 3 000 particles, equivalent to about 400-500 g, was tested. A historical dynamic correction factor derived from previous tests on Leeuwpan coal,.which was assumed to be similar to the Witbank sample since both coals were from the same coalfield, was applied for the Witbank sample. This correction factor was not applicable to the Moatize and Molteno coals.
The samples were analysed for size, shape, mass, and consequently density, on a particle-by-particle basis. The machine was also set to simultaneously physically separate each sample into 10 density bins. The separation criteria for each bin were determined by dividing the entire density range (1.2-2.2 g.cm-3 in this case) by 10, hence the exact values of the interval density limits for each bin were arbitrary. In the interest of time, only one RhoVol pass was used in this project, although it is acknowledged that the accuracy of the volume determinations improves significantly with each additional pass. Each pass of 3 000 particles takes about 3 hours to complete.
Ash analysis
After fractionation of the samples (both by RhoVol and float-and-sink) the materials were subjected to ash analysis according to SANS 131:2011. Three repeats were completed for each sample to ensure accuracy.
Results and discussion
Figure 3 shows the densimetric curves for the Moatize coal. An average deviation of 8.27% is observed between the two curves. It is clear that the RhoVol densities are consistently lower than those from float-and-sink analysis.
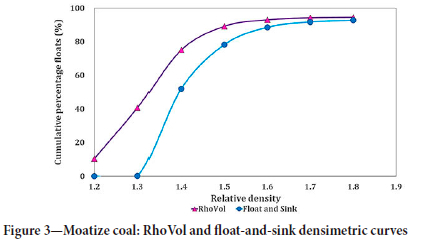
This can be explained as follows.
► Visual hull-based object reconstruction overestimates the volume of an object (Mangera, Morrison, and Voight, 2016). Since volume is inversely proportional to density, the density of material analysed by the RhoVol is underestimated.
► The RhoVol is unable to distinguish coal porosity from other surface concavities (Forbes et al., 2003). This means that the RhoVol determines the entire particle volume, which includes the volume of the pores, and not the true volume of the particle, which excludes pore volume. Due to this, the particle volume is overestimated, resulting in an underestimation of the density.
► ZnCl2 salt adsorption within coal pores (Campbell, le Roux, and Smith, 2015). During float-and-sink analysis, ZnCl2 permeates into the coal pores, and remains there despite vigorous washing after the analysis. The increase in the sample weight due to residual ZnCl2 increases the calculated material fraction in the specified density range.
Figure 4 shows the densimetric curves for the Molteno coal. An average deviation of 11.48% is observed between the two curves. Once again, it is seen that the RhoVol underestimates the density of the sample, due to the abovementioned factors.
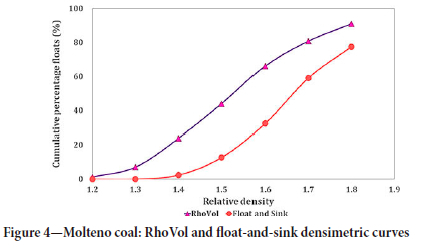
Figure 5 shows the densimetric curves for the Witbank coal. An average deviation of 2.98% is observed between the two curves. The RhoVol data shows much better correspondence to the float-and-sink data than with the other two coals. This is due to the volume correction factor used for this coal during RhoVol operation.
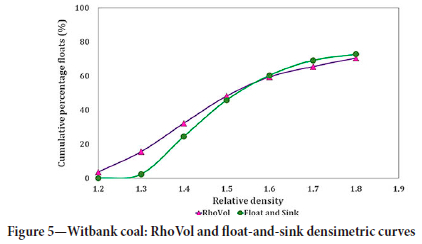
However, a discrepancy is still observed at densities less than 1.4. This is due to the relationship between porosity and coal grade (Galvin, 2006). Porosity is more extensive in high-grade coals; i.e. the density is lower (Li et al,. 2017). This increaed porosity at lower density affects the results of the RhoVol. Explanations 2 and 3 above apply for low density classes.
Conclusions
Comparison between the float-and-sink and the RhoVol results for the three coals indicates that the RhoVol analyser is a viable technical alternative to float-and-sink analysis, provided it is calibrated correctly. This is based on the low observed experimental error for the dfferent coals, indicating that the analysis is in line with industry standards, where errors of up to 5% are common (Fofana and Steyn, 2018).
The RhoVol delivered unsatisfactory results for the Moatize and Molteno coal samples, for which it was not correctly calibrated. The RhoVol underestimated the density of these samples compared to float-and-sink analysis.
For the Witbank coal the RhoVol results showed very good correspondence to the float-and-sink results, for densities higher than 1.4. For lower densities a deviation was observed, with the RhoVol underestimating the density. The underestimation can be attributed to coal porosity, which leads to the particle volume being overestimated.
References
Aktas, Z., Karacan, F., and Olcay, A. 1998. Centrifugal float - sink separation of fine Turkish coals in dense media. Fuel Processing Technology, vol. 55, no. 1. pp, 235-250. [ Links ]
Bhattacharya, S. and Anand, V. 1998. Estimation of grindability from sink-float test data for two different coals. International Journal of Mineral Processing, vol. 53. pp. 99-106. [ Links ]
Campbell, Q.P., le Roux, M., and Smith, I.G.T. 2015. Water-only laboratory coal fractionation using the reflux classifier. Minerals Engineering, vol. 83 (January). pp. 59-63. [ Links ]
Cobban, D.A., Rossouw, J.N., Versfeld, K., and Nel, D. 2009. Water quality considerations for opencast mining of the Molteno Coal Field, Indwe, Eastern Cape. Proceedings of the International Mine Water Conference, Pretoria, 19 - 23 October 2009. International Mine water Association. https://www.imwa.info/docs/imwa_2009/IMWA2009_Cobban.pdf [ Links ]
DebTech. 2018. RhoVol - Densimetric measurement system. https://www.debtech.com/product-Rhovol.html [ Links ]
Fofana, M. and Steyn, T. 2018. Monitoring the performance of DMS circuits using RhoVol technology. Journal of the Southern African Institute of Mining and Metallurgy, vol. 119, no. 2. pp. 133-138. [ Links ]
Forbes, K., Voigt, A., and Bodika, N. 2003. Using silhouette consistency constraints to build 3D models. Proceedings of the Fourteenth Annual Symposium of the Pattern Recognition Association of South Africa (PRASA 2003). pp. 33-38. [ Links ]
Franco, J-S. and Boyer, E. 2012. Exact polyhedral visual hulls. Proceedings of the 2004 IEEE Computer Society Conference on Computer Vision and Pattern Recognition Workshops (CVPRW'04). IEEE, New York. pp. 32.1-32.10. [ Links ]
Franzidis, J. and Harris, M.C. 1986. A new method for the rapid float-sink analysis of coal fines. Journal of the Southern African Institute of Mining and Metallurgy, vol. 86, no. 10. pp. 409-414. [ Links ]
Galvin, K.P. 2006. Options for washability analysis of coal A literature review. Coal Preparation, vol. 26, no. 4. pp. 209-234. [ Links ]
Hower, J. 2016. Coal. Kirk-Othmer Encyclopaedia of Chemical Technology. Wiley. [ Links ]
King, R.P. 2012. Modeling and Simulation of Mineral Processing Systems. 2nd edn. MSociety for Mining, Metallurgy, and Exploration, Engelwood, CO. [ Links ]
Kong, L., Bai, J., Li, H., Chen, X., Wang, J., and Bai, Z. 2018. The mineral evolution during coal washing and its effect on ash fusion characteristics of Shanxi high ash coals. Fuel, vol. 212. pp. 268-273. [ Links ]
Laurentini, A. 1994. The Visual Hull Concept for Silhouette-Based Image Understanding. IEEE Transactions on Pattern Analysis and Machine Intelligence, vol. 16, no. 2. pp. 150-162. [ Links ]
Li, Y., Zhang, C., Tang, D., Gan, Q., Niu, X., Wang, K., and Shen, R. 2017. Cole pore size distributions controlled by the coalication process: An experimental study of the coals from the Junggar, Ordos and Qinshui basins in China. Fuel, vol. 206. pp. 352-363. [ Links ]
Mahajan, O.P. 1982. Coal porosity. Coal Structure. Meyers, R.A. (ed.) Academic Press, New York. pp. 51-84. [ Links ]
Mangera, R., Morrison, G., and Voigt, A. 2016. Particle volume correction using shape features. Proceedings of the 2016 Pattern Recognition Association of South Africa and Robotics and Mechatronics International Conference, Stellenbosch, South Africa. IEEE, New York. C:1-6. [ Links ]
Rodrigues, C.F. and de Sousa, M.J.L. 2002. The measurement of coal porosity with different gases. International Journal of Coal Geology, vol. 48. pp. 245-251. [ Links ]
Sahu, D., Chaurasia, R.C., and Sursh, N. 2018. Mineralogical characterization and washability of Indian coal from Jamadoba. Energy Sources Part A: Recovery Utilization and Environmental Effects. September 2018, pp. 517-526. [ Links ]
SANS (South African National Standards). 2009. SANS 589. Hard coal - Determination of total moisture. SABS Standards Division, Pretoria: [ Links ]
SANS (South African National Standards). 2010. SANS 7936. Hard coal - Determination and presentation of float and sink characteristics - General directions for apparatus and procedures. SABS Standards Division, Pretoria. [ Links ]
Sivrikaya, O. 2014. Cleaning study of a low-rank lignite with DMS, Reichert spiral and flotation. Fuel, vol. 119. pp. 252-258. [ Links ]
Wills, B.A. and Napier-Munn, T.J. 2006. Wills' Mineral Processing Technology. 7th edn. Elsevier. [ Links ]
 Correspondence:
D. Stone
Email: dyllanstone1995@gmail.com
Received: 30 Nov. 2019
Revised: 31 Mar. 2021
Accepted: 8 Oct. 2023
Published: October 2023
* Paper written on project work carried out in partial fulfilment of BEng (Chemical Engineering) degree

