


Serviços Personalizados
Artigo
 Inglês (pdf)
 Artigo em XML
 Referências do artigo
Indicadores

Links relacionados
-
 Citado por Google
 -
 Similares em Google
Compartilhar

 Permalink
Journal of the Southern African Institute of Mining and Metallurgy
versão On-line ISSN 2411-9717
versão impressa ISSN 2225-6253
J. S. Afr. Inst. Min. Metall. vol.123 no.9 Johannesburg Set. 2023
http://dx.doi.org/10.17159/2411-9717/1788/2023
PROFESSIONAL TECHNICAL AND SCIENTIFIC PAPERS
Energy efficiency in the South African mining sector: A case study at a coal mine in Mpumalanga
C.M.D. Majola; K.E. Langerman
Department of Geography, Environmental Management and Energy Studies, University of Johannesburg, South Africa. ORCID: K. Langerman: http://orcid.org/0000-0003-0936-2051
SYNOPSIS
Energy efficiency is a cost-effective way of both bolstering energy security and limiting the harmful effects of energy use on the environment. Mining is an inherently energy-intensive activity, and the 2008 revision of South Africa's National Energy Efficiency Strategy (NEES) set a target of a 10% reduction in energy consumption by 2015 for the mining sector. In this study, we investigate the effectiveness of the NEES in improving energy efficiency in the South African coal mining sector by surveying energy intensity at a number of operations, and analysing energy efficiency trends and energy use by process and energy carrier at an underground coal mine in Mpumalanga. Most mines surveyed exhibit an increase in energy intensity over time. At the case study mine, the increase was primarily due to increased energy use in the beneficiation and discard reclaiming processes. Trends in energy consumption are a poor reflection of trends in energy intensity, as a decline in energy consumption is most easily achieved by reducing production. A more appropriate metric for energy efficiency at coal mines is energy intensity, defined as energy use per unit of saleable product, relative to a multi-year baseline. The evidence suggests that the NEES has been ineffective in promoting energy efficiency in South African coal mines. We propose that greater success could be achieved by monitoring and reporting on energy intensity at the process level, and by incentivizing energy efficiency gains.
Keywords: energy efficiency, energy intensity, coal mining.
Introduction
The energy transition is under way, spurred on by the drive to mitigate climate change, and facilitated by technologies of the Fourth Industrial Revolution. Often the quickest and most cost-effective way to reduce fossil fuel use is through increasing energy efficiency. The South African government (Department of Energy, 2016) has embraced energy efficiency as a 'first fuel' (International Energy Agency, 2014), an unseen energy resource to be exploited before considering other energy sources. Coal is gradually being replaced with renewables and other lower carbon emitting sources of energy. The coal industry is expected to go into decline as demand and investment in the sector drop (Semelane et al., 2021; Winkler et al., 2021). The contribution of coal to South Africa's primary energy supply declined from 70.7% in 2012, when local coal production peaked, to 63.1% in 2018 (Department of Energy, 2021). Coal production in South Africa has stagnated over the past ten years (BP, 2021). Nevertheless, reliance on coal is expected to continue for decades. The scenarios considered for the Integrated Resource Plan 2019 (Department of Energy, 2018) show that coal is still expected to generate between 17% and 42% of South Africa's electricity in 2050.
In this study, we consider energy efficiency in the coal mining sector in South Africa. The Energy Efficiency Strategy for the Republic of South Africa, published in 2005 (Department of Minerals and Energy, 2005) set a target for the mining sector of a 15% reduction in final energy demand by 2015 relative to a 2000 baseline. This target was revised in the 2008 review of the National Energy Efficiency Strategy (NEES) (Department of Minerals and Energy, 2009) to a 10% reduction by 2015 relative to an adjustable baseline. The draft post-2015 NEES (Department of Energy, 2016) recommends a target of a cumulative annual energy saving of 40 PJ from energy savings interventions for the mining sector. The Second Annual Monitoring Report on South Africa's Energy Efficiency Targets (Department of Energy, 2015) evaluates energy efficiency in terms of energy intensity, calculated as energy consumed per unit economic output (unit gross value-added), and finds that the mining sector has performed particularly badly in terms of energy efficiency: the energy intensity of the mining sector increased by around 10% between 2004 and 2012.
While the Energy Efficiency Target Monitoring Reports (Department of Energy, 2015, 2014) provide a useful overview of energy efficiency trends in South Africa, the aggregated data provides no insights into energy efficiency in the different mining sub-sectors. Moreover, the Monitoring Reports do not assess whether the NEES target for the mining sector of a 10% reduction in energy demand by 2015 was in fact achieved. Given the fact that the mining sector appears to be becoming more energy intensive over time, and that disinvestment in the coal mining sector may exacerbate this trend, energy efficiency in coal mines warrants further investigation.
This study aims to provide insights into energy efficiency trends in the coal mining sector in South Africa. Firstly, we question whether an energy efficiency target based on overall energy demand (consumption) is appropriate, considering that the easiest way to reduce demand is by lowering production, which is not beneficial to South Africa's economy. Several alternative metrics for energy efficiency are proposed and evaluated. Secondly, the energy use breakdown by process and by energy carrier is assessed at an underground coal mine in Mpumalanga. Finally, the energy use of the case study mine is contextualized by comparing overall energy intensity of the case study mine to the energy intensity of other South African coal mining operations.
Literature survey
Energy is used in all stages of the recovery process at a coal mine: in extraction, transportation, and beneficiation (Jeswiet and Szekeres, 2016; Pretorius, 2016). Energy is used in the form of electricity and fossil fuels such as diesel, natural gas, and propane gas. Reducing operational costs, increasing competitiveness and profitability, and the need to ensure energy security are the main drivers for energy efficiency in coal mines (Ryan, 2014).
Various energy efficiency projects have been successfully planned and implemented in mining operations in South Africa. Between 2010 and 2015, Harmony Gold Mining achieved 256 000 MWh in electricity savings through projects such as bulk air cooler peak-load clipping to reduce power consumption during peak hours; installing energy-saving ventilation fans; enhancement of compressed air use by using it for cooling purposes; and the installation of energy-saving motor drives (Harmony Gold Mining Company Limited, 2105). Anglo American has improved the energy efficiency of the air compressors, fans, pumps, electric motors, draglines, and conveyor belts. The company has also fitted heat pumps in the employees' change houses (bathrooms) to replace the conventional geysers. By 2015, energy consumption was reduced by 7% (Msimanga, 2015).
Lonmin, in partnership with Eskom, has invested in energy efficiency projects since 2007 valued at around R150 million (Ryan, 2014). By 2012, these projects achieved a saving of 0.8 MWh/platinum group metal (PGM) and 1.06 GWh/a. The energy efficiency investments were made in the optimization of compressed air and ventilation systems, the generation of hot water, and renewable energy technologies. Lonmin also installed above-ground fluorescent and LED lighting that reduced energy demand by 0.33 MW and attained a R210 000 saving in 2013. Impala Platinum Holdings Limited has implemented initiatives such as the installation of power factor equipment with the aim of achieving a 2.5% saving. The company's new operations have been designed with high-level energy efficiency specifications and energy management in the shaft stations, the site refrigeration systems, underground lighting, air compression, as well as water reticulation systems (Ryan, 2014).
Wang et al. (2018) suggest the following categories for energy efficiency indicators for coal mining operations:
> Basic indicators that reflect the basic energy situation of coal mining operations and which are commonly total raw coal production (Mt) and energy consumption of raw coal mining, as used for the mining sub-sector's target in the NEES (Department of Minerals and Energy, 2009, 2005).
> Composite evaluation indicators that evaluate the energy or power (electricity) intensity as a function of coal produced or revenue.
> Single process indicators that remove the influence of natural conditions on energy consumption in coal production by looking at the energy use of key processes like the fan, hoisting, drainage, air compressor and conveyor belt systems.
There are significant differences in energy consumption between various coal mines due to the influence of local conditions, production processes, age of the mine, and even safety requirements. The breakdown of energy use by process and energy carrier is necessary to identify the processes that are energy intensive and allow interventions to be planned (Eckelman, 2010). This study presents the energy use breakdown by process for one underground coal mine in Mpumalanga.
Methodology
A single explanatory case study method is applied. Historical secondary data from an underground coal mine in Mpumalanga is used to determine energy consumption and energy intensity trends, as well as to evaluate whether the mine achieved the NEES energy demand reduction target of 10%. The energy intensity of each process is assessed, and the use of the three energy carriers used at the mine - electricity, diesel, and oil - is quantified. The energy intensity of the case study mine is also benchmarked against 15 other South African coal mines, and energy intensity trends at six coal mines are analysed to provide context.
Study area
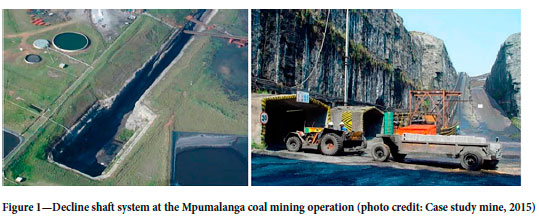
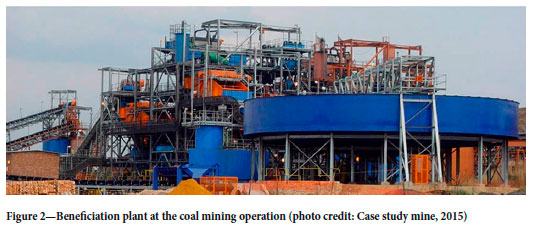
The case study mine is located within the Highveld Coalfields in the Nkangala District in Mpumalanga. The No. 2 coal seam has already been mined out and underground mining of the No. 4 lower seam commenced in 1996. Mechanized board and pillar extraction methods are used. The coal is accessed through a decline shaft system (Figure 1). Run-of-mine (ROM) coal from the underground operations is conveyed to ROM stockpiles then transported to the beneficiation plant where it is crushed and screened (Figure 2). The coal is beneficiated into two products, export coal and metallurgical coal (for local use). Waste rock is separated from the product by dense media separation at the beneficiation plant and is then conveyed to the discard bin, from where it is trucked to the discard dump.
Four dormant discard dumps from historical mining activity are being re-mined. Similar to the underground coal, the discard material extracted from the old dumps is beneficiated in two separate circuits and screened into different products which are then transported by rail for export and by truck for inland use.
The case study operation utilizes energy in the form of electricity, oil, and diesel. Electricity is directly supplied by Eskom, with the main electrical substation located adjacent to the site. There are then four substations on the mine where the electricity is stepped down to 550 V and 400 V for surface use and 11 kV for underground use. Four diesel supply tanks supply the mobile equipment. Oil is used for maintenance of machinery and is housed in five oil stores.
Data collection
To provide some context on the energy intensity of the case study mine relative to other South African coal mines, a number of well-established local mining operations that use either underground or open cast mining methods were selected. Mines were selected based on availability of production, electricity consumption, and overall energy consumption data for at least five consecutive years. The energy intensity for each mine was calculated using production and energy consumption data retrieved from the company's annual sustainability reports. Trends in energy intensity were analysed for 2007-2015 for the following six mines for which annual energy use and production were available: Arnot coal mine, Grootegeluk mine, Inyanda coal mine, Goedehoop colliery, Leeuwpan coal mine, Matla coal mine, and North Block complex.
To determine trends in energy use and intensity, energy use breakdowns by process and energy carrier at the case study mine, historical energy use, and production data for the period between 2005 and 2019 were obtained from the relevant departments.
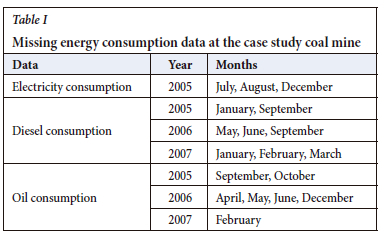
Electricity consumption was obtained from monthly invoices. Monthly diesel consumption was verified against the opening and closing readings on the diesel pumps and refilling records. Oil data was checked against the logs of the amount of oil available at the start of each month, the oil purchased, and the remaining amount at the end of the month. Coal produced from underground and beneficiation processes is measured with scales that are calibrated annually to ensure accuracy and logged daily. The storage of energy consumption data prior to 2008 was fairly poor and in several instances consumption data was not available (Table I). Missing data was substituted with the average of three months of data before the gap in the record.
Data analysis
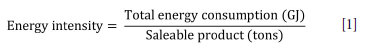
Energy intensity (energy consumed (GJ) per ton of coal produced) is used as the primary metric for energy efficiency in this study. Energy consumption is the sum of energy derived from all energy carriers (electricity and liquid fuels).
The performance of the six South African coal mines in achieving the NEES target of a 10% reduction in energy consumption was evaluated using the linear trend method adapted from the Department of Energy (2015, 2014). Changes in overall energy use and energy intensity were assessed from 2007, when most mines started reporting on energy performance.
Energy efficiency trends at the case study mine were evaluated and the progress of the mine in achieving the NEES target assessed using 2005 as the baseline year, because energy consumption data for the operation was incomplete before 2005. A simple reduction in overall energy use (as per the NEES 10% energy demand reduction target) is not a preferred method of incentivizing energy efficiency for economically productive activities like mining, as it is most easily achieved by lowering production. Several metrics for setting targets and evaluating changes in energy efficiency were tested.
i) Overall energy consumption from all energy carriers.
ii) Energy consumption as a function of production. A linear regression model was fitted to determine the relationship between energy consumption and saleable product during the baseline period of 2005-2007. Energy consumption was then calculated for 2008-2015 as a function of production using the linear relationship (the extrapolated baseline), and the 10% energy demand reduction target calculated as 10% less than the extrapolated energy consumption values. Expressing energy consumption/intensity as a function of production is the more common and preferred method used to present energy performance data (Australian Government, Department of Resources, Energy and Tourism, 2013; Castrillón-Mendoza, Rey-Hernández, Rey-Martínez, 2020; Lawrence et al., 2019; US Department of Energy, 2015).
iii) Energy intensity as a function of production. Similarly to energy intensity (calculated as per Equation [1]), as baseline dependence on production is established for 2005-2007. The extrapolated baseline is used to evaluate improvements/ deteriorations in energy intensity, and the NEES target is calculated as 10% less than the extrapolated baseline.
iv) Time series analysis. A time series analysis of monthly energy intensity from 2008-2015 (180 values) at the case study mine was conducted in order to account for the effects of seasonality and forecast future energy intensity (Adhikari and Agrawal, 2013; Strandberg, 2015). It is hypothesized that drops in production over the December/January period and year-end reporting may introduce seasonality into the energy intensity at the mine. Energy intensity was decomposed into trend, seasonal, and irregular components. The centred moving average method was used to smooth the data (Carlberg, 2015; Nadler and Kros, 2007). Various periods, ranging between 5 months and 13 months, were tested to allow for the selection of a moving average period with the least mean square error when compared with the actual monthly energy intensity values. Seasonal and irregular factors in the mine's energy intensity data were then calculated and the energy intensity data deseasonalized by dividing the actual monthly energy intensity by the seasonal factor. A trend line was fitted to the deseasonalized values using a single linear regression to identify the underlying long-term behaviour of the data, excluding calendar and irregular effects (Amponsah, Otoo, and Todoko, 2015). Lastly, energy intensity at the operation was forecast for 2020-2023 by superimposing the seasonal component back onto the trend.
The energy used by each process at the mine was calculated monthly from 2005 to 2019 to assess changes over time and identify energy-intensive processes. The energy intensity of each process was calculated as the total energy used by the process (GJ) divided by the coal tonnage handled by that process (run-of-mine for underground mining and coal handling, feed to plant for beneficiation, discard reclaimed, and waste product handled). Lastly, a Sankey diagram was used to display the breakdown of energy between various processes at the mine (Riehmann, Hanfler, and Froehlich, 2005; Wang et al., 2017).
Permission to conduct the study was granted by the mining operation management on condition that the company name is not revealed or used. Approval for the study was also received from the University of Johannesburg's Faculty of Science Ethics Committee.
Results
The average energy intensity of 16 South African coal mining operations (including the case study mine) in 2010 is first compared to provide context. Energy consumption and efficiency trends at six coal mines are then compared. Finally, energy efficiency trends and energy use by process and by carrier is assessed in detail at the underground coal mining operation in Mpumalanga.
Energy intensity of South African coal mines
There is a large range of almost an order of magnitude in the energy intensity of South African coal mines (Figure 3a). Of the 16 mines considered here, the four mines with the highest energy intensity are all opencast mines. Both underground and opencast mines have achieved particularly low energy intensities. In Australia, too, opencast mines are generally more energy intensive than underground mines (Sterling, 2010). The case study mine occupies a median position in the distribution, with an energy intensity of 0.1 GJ/t. Generally, underground mines use more electricity than opencast mines (Figure 3b) since electricity is used to power the underground machinery. Opencast operations mainly use diesel to power the mobile equipment that extracts and transports the coal. The four mines using the least electricity in 2010 are all opencast coal mines. The case study mine utilized 19.92 kWh/t in 2010, making it the fifth most electricity-intensive operation of the 16 mines.
Trends in overall energy consumption and energy intensity vary considerably between mines and at some mines there is no clear trend. Two (almost three) of the six South African coal mines considered in Figure 4 achieved a 10% reduction in energy demand between 2007 and 2015, while only one (Inyanda) achieved a 10% reduction in energy intensity by 2015. The energy intensity at Inyanda was anomalously high in 2010, the first year of reporting. Thereafter, annual energy intensity was highly variable, and it is not clear that there is indeed a declining trend. Arnot achieved the energy consumption reduction target, using 32% less energy in 2015 than in 2007; however, energy intensity increased over the same period by 80%. Matla reduced energy consumption by 8% by 2015 but the energy intensity of the operation increased by 42%. Arnot and Matla achieved the energy demand reduction target due to a drop in production, and not through an improvement in energy efficiency. In general, trends in overall energy consumption are a poor reflection of trends in energy intensity. A drop in overall energy consumption may very well not reflect an improvement in energy intensity, as is seen in the case of Arnot and Matla. In the next section, trends in energy intensity at the case study mine are analysed in detail.
Energy intensity trends at an underground coal mine
Trends in energy intensity at the case study mine are assessed between 2005 and 2019 using four different metrics:
1. Total energy consumption
2. Total energy consumption relative to product
3. Energy intensity relative to product
4. Time series analysis of energy intensity.
Overall energy consumption
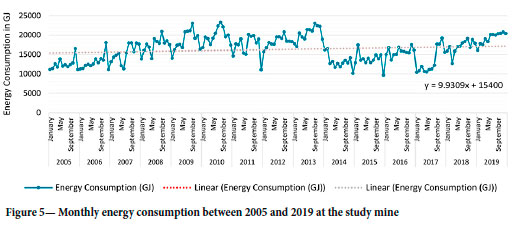
There was a gradual increasing trend in energy consumption of 9.9 GJ/month at the mining operation between 2005 and 2019 (Figure 5). The highest annual energy use at the mine was 244 253 GJ in 2013, and the lowest was 149 567 GJ in 2005. Monthly energy consumption consistently declines in December, with the lowest energy consumed in December 2015 (9 695 GJ). Energy consumption was particularly low at the end of 2011, 2014, and 2015 when some sections were put on hold due to poor mining conditions.
Considering only total energy consumption ignores the dependence of energy use on the volume of coal handled. Simple linear regression analysis of the dependence of total monthly energy consumption on final saleable product and ROM yields R2 values of 0.2808 and 0.5862, respectively. The variance in monthly energy consumption is much better accounted for by ROM volumes than saleable product volumes. This is expected since underground mining uses the majority of the energy at the mining operation (Figure 10).
Energy consumption relative to a product-based baseline
The dependence of monthly energy consumption on saleable product (a readily available figure for most mines) is quantified with a linear regression for the baseline period 2005-2007:
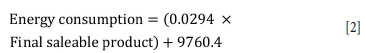
Several years (in this case, three years) were used to define the baseline because of the fairly high monthly and annual variability in energy consumption. The difference between actual and projected energy consumption (Equation [2]) gives an indication of changes in energy consumption over time, taking the changes in production into account. The actual energy consumption of the mine exceeded the projected value by an average of 29% between 2008 and 2015, implying that the mine has become less energy efficient in its operations (Figure 6).
Energy intensity relative to a product-based baseline
Since a certain amount of the energy used at a mining operation is fixed and is independent of the amount of coal processed, it is expected that energy intensity will drop as production increases. Energy intensity is thus dependent on production too. On average, actual monthly energy intensity at the mine exceeded the projected energy intensity based on the 2005-2007 baseline by 26% between 2008 and 2015 (Figure 7). Actual energy intensity aligns better with the baseline values in 2014 and 2015 (only 9% higher), indicating some improvement in relation to baseline performance for this period. The percentage difference between actual and projected monthly energy intensity averages 35% for 2008-2013.
Energy intensity time series analysis
The monthly energy intensity for the study mine was found to be best approximated by a 12-point centred moving average. The straight-line trendline fitted to the deseasonalized monthly energy intensity values shows an increasing trend in energy intensity of 0.25 MJ/t per month (Figure 8):
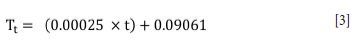
where Tt is the energy intensity in month t (where January 2005 is t = 1).
The time series analysis obviously forecasts a continuing increase in energy intensity at the mine in future, calculated as the seasonal variations superimposed on the trend component. There is not a significant seasonal variation in monthly energy intensity, with the monthly seasonal factors ranging between 0.91 in October and 1.14 in April.
While energy efficiency metrics incorporating the dependence of energy use on production are preferred, all four metrics considered here show a decline in energy efficiency with time at the case study mine. The metrics are now used to evaluate the mine's performance against the 10% energy efficiency improvement target between 2005 and 2015.
Achievement of the National Energy Efficiency Strategy energy efficiency target
Several metrics of a 10% improvement in energy efficiency are evaluated in this section:
1. A 10% reduction in energy consumption (referred to as demand in the NEES) by 2015 relative to 2005
2. A 10% reduction energy intensity by 2015 relative to 2005
3. and 4. 10% lower energy consumption and energy intensity projected on the basis of final product according to the linear relationship (with y-intercept) established for the baseline period between 2005 and 2007.
The mine's annual energy demand exceeded the 10% reduction target by 22% in 2015 (Figure 9a), and annual energy intensity exceeded the target by 19% (Figure 9b). Similarly, when the 10% reduction target is set relative to the product-based 2005-2007 baseline, energy demand exceeds the target by 20% (Figure 9c), and energy intensity by 18% in 2015 (Figure 9d). The discrepancy between actual energy use/intensity and the baseline increaseed in 2018 and 2019 (Figure 9c and Figure 9d).
It has been ascertained that both the energy consumption and the energy intensity at the case study mine are increasing over time, despite the prompting of the NEES to reduce energy intensity. The reasons for the increase are now probed by assessing which processes are responsible for the increase in energy intensity and what energy source(s) are used.
Energy consumption by process
The underground mining process is the most significant energy user at the mine, followed by the beneficiation process (Figure 10). Before the start of the discard reclaiming process, 60% of the mine's total energy use was for coal extraction underground and 29% for beneficiation (Figure 10a). The coal handling and waste product handling processes use the least energy, with a 6% and 5% contribution to the overall energy use between 2005 and 2014 respectively. The introduction of the discard reclaiming process, utilizing 7% of the overall energy at the mine, resulted in the underground process using a lower proportion of energy (54%) and the beneficiation process still making the same contribution (29%) to overall energy consumption (Figure 10b).
Discard reclaiming displays the greatest increase in energy intensity over time, with energy intensity significantly higher in 2018 and 2019 than from 2015-2017 (Figure 11). Energy used per ton of coal washed at the beneficiation plant also increases significantly over time. Discard reclaiming and beneficiation are the main processes accounting for the increased energy intensity at the mine over time. Although the underground mining process uses the highest amount of energy and has the highest energy intensity of all the processes, the average energy intensity over the years has remained fairly consistent. Waste handling displays a decreasing trend in energy intensity between 2005 and 2019.
Energy consumption by energy carrier
The underground mining process is mainly dependent on energy sourced from electricity (75% of total energy use underground, Figure 12). Electricity powers the mining machinery, ventilation systems, pumping infrastructure, and coal conveyors underground. Diesel use contributes 20% to total underground energy use, and oil used for maintenance, 5%. A simple linear regression analysis conducted on monthly energy consumed and coal mined underground between 2005 and 2019 shows that there is a relatively high fixed energy consumption per month of 4 407 GJ for the underground mining process. Each additional ton of coal extracted requires an additional 21 GJ. The R2 value for the linear regression is 0.5519, meaning that 55% of the variance in energy use is explained by the amount of coal extracted.
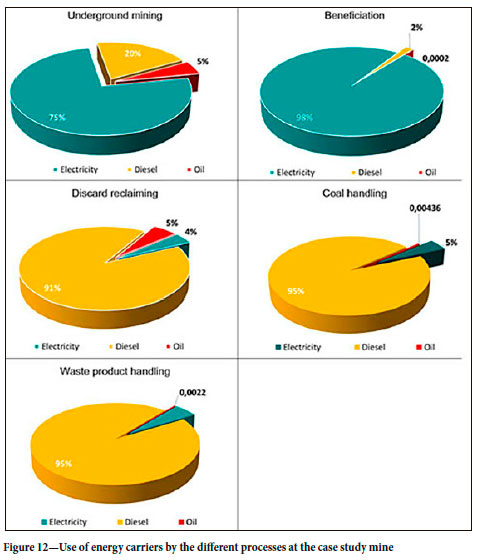
The beneficiation plant sources 98% of its energy from electricity and the other 2% from diesel used for transportation to and from the plant (Figure 12). In the reclaiming process, an excavator is used to load discard material onto tipper trucks. The trucks transport the discard to ROM stockpiles and water bowsers suppress the dust on the haul roads on which the trucks travel. The highest energy use in this process is through diesel used by all the machines involved in reclaiming (Figure 12). Energy use in the coal handling process is 95% from diesel used for machines handling the coal, 5% from electricity for lighting the work area, and 0.004% from oil for machine maintenance. In the waste product handling process, tipper trucks, powered by diesel, load the discard at the conveyor chute. The trucks transport waste coal to a discard dump for disposal. As in the discard reclaiming process, water bowsers are used for dust suppression on the roads. The significant reliance on machinery in this process leads to a high diesel dependence, totalling 95% of the overall energy use. Electricity for lighting the work area provides 5% of the total energy used, and a small amount of oil (0.002% of total energy used) is for maintenance of the machines.
To sum up, the energy flow through the different processes at the mine is visualized a using Sankey diagram (Figure 13). In 2019, after discard reclaiming had commenced, coal extracted underground totalled 3 004 740 t and 1 046 010 t were reclaimed from the old discard dumps. The underground coal and reclaimed discard were stockpiled together on ROM stockpiles for beneficiation. Of the 4 050 750 t that were stockpiled, only 2 970 120 t (73%) was processed through the plant. Of the coal processed through the beneficiation plant, 1 999 500 t (67%) was saleable product, and 970 622 t (33%) was waste.
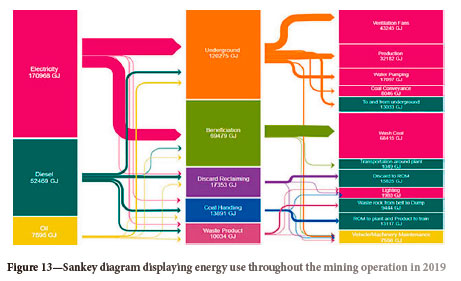
Electricity was the most significant energy source at the mine in 2019, supplying 74% of the overall energy used, followed by diesel, contributing 23% and oil, a low 3% (Figure 13). Ventilation fans used 43% of the electricity supplied to the underground workings and mining machinery utilized 32 182 GJ (32%). Pumping water to mining areas and for dust suppression contributed 17% to the mine's underground electricity use, and coal conveyance contributed a low 8%. Owing to the distances involved, employees are transported in light duty vehicles (LDVs) from the surface to the mining sections, which consumes 13 033 GJ (11% of the energy used by the underground operation).
Discussion
Energy efficiency measurement and target setting
The balance of evidence suggests that the NEES has not been effective at improving energy efficiency at South African coal mines. Energy intensity increased between 2007 and 2015 at six of the seven coal mining operations considered in this study. At the case study mine, energy efficiency measured using all the metrics considered in this study was around 20% worse than the 10% improvement target in 2015. This is expected as a mining operation usually becomes more energy-intensive over time as less accessible ore is extracted and machinery ages, and no energy efficiency measures have been implemented that could reduce overall energy demand at the mine. The case study mine appears to be fairly typical of a South African mine - the mining sector overall showed a slight increase in energy intensity (defined as energy consumed per unit value added) between 2004 and 2012 (Department of Energy, 2015).
There are a number of factors contributing to the decline in energy efficiency in the mining industry after the establishment of the NEES. Firstly, the strategy lacks mandatory measures and enforcement capability (Rosenberg and Winkler, 2011). The energy efficiency targets are voluntary. There are no penalties for not partaking in the agreements or for failure in achieving them (Covary and Averesch, 2013). Secondly, there is no clear method for determiningn energy efficiency indicated in the strategy. Thirdly, energy efficiency projects are to be self-funded. There are no incentives or support from government for companies to implement initiatives. And lastly, the strategy details the intention to establish regulations for the management, measurement, and reporting of energy efficiency based on the Energy Act of 2008 (Covary and Averesch, 2013). Yet, 15 years after its establishment, no measures have been put in place to address this (Covary and Averesch, 2013; Rosenberg and Winkler, 2011; Sebitosi, 2008). In order to maximize the energy efficiency potential in South Africa, government needs to be more proactive in the measures documented in the NEES, focus on the enforcement of the strategy by establishing supportive legislation, and develop a platform similar to the Top Runner programme in Japan (Sebitosi, 2008) where organizations can partake in discussions, share best practices, and be informed about resources available to them for implementing energy efficiency measures or initiatives.
A survey of successful energy efficiency interventions around the world shows that accurate monitoring and reporting on energy intensity and energy savings is the foundation for energy efficiency improvements (Awuah-Offei, 2016; du Plessis, 2015; Imasiku and Thomas, 2020; Katta, Davis, and Kumar, 2020; Levesque, Millar, and Paraszczak, 2014; Sterling, 2010). Data is needed on sub-sectorial processes to allow for the identification of high energy use areas, sources of variation, and energy saving opportunities. The International Energy Association (IEA) recommends that the ISO 50001 energy management standard be implemented at large energy-intensive industries (du Plessis, 2015; Levesque, 2015). This recommendation is also included in South Africa's draft Post-2015 National Energy Efficiency Strategy (Department of Energy, 2016).
For a developing country, the measures that have been implemented in India to improve energy efficiency are impressive. The National Mission for Enhanced Energy Efficiency established the Perform, Achieve and Trade framework that is aimed at improving the cost-effectiveness of advancements in energy efficiency in energy-intensive industries by setting individual targets for industries to reduce their specific energy consumption (Bhattacharya and Cropper, 2010; PricewaterhouseCoopers, 2020; Sahoo et al., 2016). Industries that achieve set targets over three years through the implementation of best practices are issued with Energy Saving Certificates (ESCerts), and industries that fail to meet targets are charged penalties or they can purchase ESCerts from companies that exceed targets (PricewaterhouseCoopers, 2020). The success of coal mining operations in India in improving energy efficiency may be attributed to the inclusion of incentives for the achievement of energy savings and penalties charged for failure to meet set targets. Best practices are shared within industries and implementation is almost mandatory. Similar measures could be considered for South Africa.
Energy use by mining process and energy carrier
The analysis of process energy flow and consumption at the case study mine shows that out of the five energy use processes identified, underground mining is the highest energy consumer (Figure 10) and the most energy intensive (Figure 11). This observation is supported by Bogunovic et al. (2009), who also note that coal extraction and beneficiation are the processes that use the most energy in mining operations. Electricity is the primary source of energy for underground operations at the mine (Figure 12), accounting for an average of 75% of total energy use (diesel accounts for 20%, and oil 5% .of the overall annual energy consumption). Similarly, McGinley et al. (2015) report a significant proportion of energy is provided by electricity in underground mining, and Efremenko, Belyaevsky, and Skrebneva (2017) indicate that in most underground coal mines, electricity consumption accounts for more than 50% of the overall energy use, mainly for ventilation, powering mining machinery, and conveying coal. Much more of the monthly variance in energy consumption at the mine is accounted for by ROM (R2 = 0.5865) than by the amount of final product (R2 = 0.2808). Tshisekedo (2008) and Inglesi-Lotz and Blignaut (2011) similarly found that the quantity of coal that is extracted, transported, processed, and disposed is a major factor impacting energy consumption.
As underground mining is the highest energy consumer and most energy-intensive, stringent efforts should be made to identify and implement energy efficiency measures at the case study mine. A number of studies have focused on measures to reduce energy consumption within the underground mining process. At Velenje coal mine, an underground lignite mine in Slovenia, electricity usage was reduced by 7% between 2008 and 2010 by replacing regular lamps with energy saving lights and modifying the ventilation settings underground when employees were not working (Medved et al., 2012). Du Plessis, Marx, and Nell (2014) document an annual energy saving of 10 400 MWh at a coal mining operation by modifying the ventilation and refrigeration systems. These are examples of some initiatives that the case study mine could investigate.
The beneficiation process consumes an average of 32% of the overall energy used at the study mine, with energy intensity falling just below that of the underground process. The beneficiation plant is one of the largest contributors to the increase in energy efficiency over time. The coal beneficiation process is powered almost entirely by electricity (98%) (Figure 12). According to Zhang (2016), a large number of South African coal washing plants were built at a time when there was an electricity surplus, and the overall design was based on reducing capital expenditure and operational malfunctions instead of energy efficiency. The beneficiation plant at the case study mine was constructed in 1996, when energy efficiency was not a priority. There are ways to improve the energy efficiency of beneficiation plants, regardless of when they were constructed. Some crushing machinery is more than 50% more efficient than other types (Jeswiet and Szekeres, 2016), and the installation of a variable frequency drive (VFD) on the main dryer exhaust fan motor to regulate and vary the rotational speed improves energy efficiency (Durocher and Putnam, 2013).
The reclaiming of discard commenced in 2015, consuming an average of 7% of the overall energy at the mine annually (Figure 10), of which 91% is provided by diesel (Figure 12). Discard reclaiming is the third most energy-intensive process at the mine and is becoming more energy-intensive with time. Eleven machines are used for reclaiming, with year models ranging from 2008 to 2011. The age of the trucks may be contributing to the high energy intensity of the reclaiming process. The energy efficiency of loading and hauling depends on the age and capacity of machinery used, on-site operating conditions, and operator practices (Awuah-Offei, 2016; Soofastaei et al., 2018). Dry and hard compacted roads keep the costs of fuel low and wear and tear at a minimum (Crittenden, 2016). Wet conditions increase the rolling resistance of a vehicle, increasing the amount of diesel consumed. The case study mine conducts regular dust suppression on its roads using water, which may lead to increased diesel consumption. The reduction of dust suppression on the haul roads, or perhaps using chemical dust suppressants, may be initiatives the mine could investigate.
Conclusion
The evidence presented in this study, although incomplete, suggests that the NEES has not resulted in an improvement in energy efficiency in South African coal mining operations. The 2008 revision of the NEES sets a target of a 10% reduction in energy consumption by the mining sector by 2015, relative to an adjustable baseline. Energy intensity on the basis of value-added for the mining sector as a whole slightly increased between 2004 and 2012 (Department of Energy, 2015). The energy intensity (on the basis of saleable product) of five out of six coal mining operations surveyed in this study increased between 2007 and 2015. Energy consumption is not a desirable metric for energy efficiency in the coal mining sector since energy consumption trends are a poor reflection of energy intensity trends and energy consumption is most easily reduced through a drop in production, which is detrimental to South Africa's economic growth aspirations.
Using an underground coal mine in Mpumalanga as a case study, three additional metrics for energy efficiency were evaluated: energy intensity, defined on the basis of saleable product (GJ/t), changes in energy consumption, and energy intensity relative to a baseline established on the basis of saleable product over three years. The case study mine showed a decline in energy efficiency between 2005 and 2015 according to all metrics, and energy demand and intensity were around 20% higher than the 10% reduction target by 2015. This is to be expected given the ageing machinery, the fact that the more accessible coal is extracted first, and that no targeted energy efficiency interventions were implemented.
The underground mining process is the highest energy-consuming process at the case study mine, and makes used of the most energy per ton of coal mined; however, no significant change in energy intensity is observed over time. Electricity provides the majority of the energy used at the mine, mainly supplying the underground and beneficiation processes. Diesel provides most of the balance, mostly used for the transportation of employees underground and the operation of mobile machines and equipment involved in the coal handling, waste product handling, and discard reclaiming. The underground ventilation fans and production machines utilize the greatest amount of electricity (and energy) at the mine after the beneficiation plant. The beneficiation and discard reclaiming processes are the main contributors to the increased energy intensity over time.
It is recommended that
> At least three years be used as the baseline period against which progress in energy efficiency is assessed. For individual operations, it is not advisable to assess progress relative to a single baseline year because annual variability in energy consumption/intensity is high.
> Energy intensity on the basis of product is a suitable metric for energy efficiency, but not overall energy consumption.
> Different operations cannot be compared in their entireties on the basis of energy intensity. The energy intensities of different mines vary by almost an order of magnitude because of differences in scale of the operation, extraction method, types of energy carriers used, age of mine etc. It is better to compare energy intensities of individual processes.
Acknowledgements
The case study mine provided the data. The mine personnel are thanked for helpful discussions.
Author contributions
Cebisile Majola collated and analysed the data and compiled the first draft of the manuscript. Kristy Langerman supervised the study and revised the manuscript.
References
Adhikari, R. and Agrawal, R.K. 2013. An introductory study on time series modeling and forecasting. ArXiv abs/1302.6613 [ Links ]
Amponsah, S.K., Otoo, D., and Todoko, C.A.K. 2015. Time series analysis of water consumption in the Hohoe municipality of the Volta region, Ghana. International Journal of Advanced Multidisciplinary Research, vol. 4. p. 393. https://doi.org/10.14419/ijamr.v4i2.3629 [ Links ]
Australian Government Department of Resources, Energy and Tourism. 2013. Energy savings measurement guide: How to estimate, measure, evaluate and track energy efficiency. Version 2.0. Commonwealth of Australia, Barton ACT. [ Links ]
Awuah-Offei, K. 2016. Energy efficiency in mining: A review with emphasis on the role of operators in loading and hauling operations. Journal of Cleaner Production, vol. 117. pp. 89-97. https://doi.org/10.1016/j.jclepro.2016.01.035 [ Links ]
Bhattacharya, S. and Cropper, M.L. 2010. Options for energy efficiency in India and barriers to their adoption: A scoping study. SSRN Journal. https://doi.org/10.2139/ssrn.1590510 [ Links ]
Bogunovic, D., Kecojevic, V, Lund, V, Heger, M., and Mongeon, P. 2009. Analysis of energy consumption in surface coal mining. Transactions of the Society for Mining, Metallurgy and Exploration, vol. 326. pp. 79-87. [ Links ]
BP. 2021. Statistical Review of World Energy 2021. London. [ Links ]
Carlberg, C. 2015. More predictive analytics: Microsoft Excel. Pearson Education, London. [ Links ]
Castrillón-Mendoza, R., Rey-Hernández, J.M., and Rey-Martínez, F.J. 2020. Industrial decarbonization by a new energy-baseline methodology. Case study. Sustainability, vol. 12, no. 5. 1960. https://doi.org/10.3390/su12051960 [ Links ]
CovARY, T. and Averesch, U. 2013. Overview and assessment of the energy efficiency and energy conservation policies and initiatives of the Republic of South Africa. ECEEE Summer Study Proceedings. pp. 591-600. [ Links ]
Crittenden, P. 2016. Energy management in mining: Leading practice sustainable development program for the mining industry. Department of Industry, Science and Resources, Canberra, Australia. www.industry.gov.au/sites/default/files/2019-04/lpsdp-energy-management-in-mining-handbook-english.pdf [ Links ]
Department of Energy. 2021. Commodity flow and energy balance 2018. Pretoria. [ Links ]
Department of Energy. 2018. Draft Integrated Resource Plan 2018. Pretoria. [ Links ]
Department of Energy. 2016. Draft Post-2015 National Energy Efficiency Strategy. Pretoria. [ Links ]
Department of Energy. 2015. South Africa's energy efficiency targets: Second annual monitoring report. Pretoria. [ Links ]
Department of Energy. 2014. South Africa's energy efficiency targets: First annual monitoring report. Pretoria. [ Links ]
Department of Minerals and Energy. 2009. National Energy Efficiency Strategy of the Republic of South Africa: First review October 2008. Pretoria. [ Links ]
Department of Minerals and Energy. 2005. Energy Efficiency Strategy of the Republic of South Africa. Pretoria. [ Links ]
Du Plessis, J.J.L., Marx, W.M., and Nell, C. 2014. Efficient use of energy in the ventilation and cooling of mines. Journal of the Southern African Institute of Mining and Metallurgy, vol. 114. pp. 1033-1037. [ Links ]
Du Plessis, W. 2015. Energy efficiency and the law: A multidisciplinary approach. South African Journal of Science, vol. 111. pp. 1-8. https://doi.org/10.17159/sajs.2015/20130302 [ Links ]
DuRocHER, D.B. and Putnam, R. 2013. Mining industry process upgrades to reduce energy intensity while improving end product quality. Procedings of the 2013 Workshop on Power Electronics and Power Quality Applications. IEEE, New York. p. 7. [ Links ]
Eckelman, M.J. 2010. Facility-level energy and greenhouse gas life-cycle assessment of the global nickel industry. Resources, Conservation and Recycling, vol. 54. pp. 256-266. https://doi.org/10.1016/j.resconrec.2009.08.008 [ Links ]
Efremenko, V., Belyaevsky, R., and Skrebneva, E. 2017. The Increase of Power Efficiency of Underground Coal Mining by the Forecasting of Electric Power Consumption. E3S Web of Conferences. Proceedings of the Second International Innovative Mining Symposium. Tyulenev, M., Zhironkin, S., Khoreshok, A., Vöth, S., Cehlár, M., and Nuray, D. (eds.) p. 02002. https://doi.org/10.1051/e3sconf/20172102002 [ Links ]
Exxaro Resources Limited. 2016. 2015 integrated report. Pretoria West. [ Links ]
Exxaro Resources Limited. 2015. 2014 integrated report. Pretoria West. [ Links ]
Exxaro Resources Limited. 2014. 2013 integrated report. Pretoria West. [ Links ]
Exxaro Resources Limited. 2013. Integrated report 2012. Pretoria West. [ Links ]
Exxaro Resources Limited. 2012. Integrated annual report 2011. Pretoria West. [ Links ]
Exxaro Resources Limited. 2011a. Integrated annual report for the year ended 31 December 2010. Open-File Report. Pretoria West. Pretoria West. [ Links ]
Exxaro Resources Limited. 2011b. Integrated annual report for the year ended 31 December 2010. Pretoria West. [ Links ]
Exxaro Resources Limited. 2010. Annual report for the year ended 31 December 2009. Pretoria West. [ Links ]
Exxaro Resources Limited. 2009. Annual report 2008. Pretoria West. [ Links ]
Exxaro Resources Limited. 2008. Annual report 2007. Pretoria West. [ Links ]
Harmony Gold Mining Company Limited. 2105. Integrated Annual Report 2015. Randfontein, South Africa. [ Links ]
Imasiku, K. and Thomas, V.M. 2020. The mining and technology industries as catalysts for sustainable energy development. Sustainability, vol. 12. https://doi.org/10.3390/su122410410 [ Links ]
Inglesi-Lotz, R. and Blignaut, J.N. 2011. South Africa's electricity consumption: A sectoral decomposition analysis. Applied Energy, vol. 88. pp. 4779-4784. https://doi.org/10.1016/j.apenergy.2011.06.018 [ Links ]
International Energy Agency. 2014. Capturing the Multiple Benefits of Energy Efficiency: Roundtable on Industrial Productivity and Competitiveness. Paris. [ Links ]
Jeswiet, J. and Szekeres, A. 2016. Energy consumption in mining comminution. Procedia CIRP, vol. 48. pp. 140-145. https://doi.org/10.1016/j.procir.2016.03.250 [ Links ]
Katta, A.K., Davis, M., and Kumar, A. 2020. Development of disaggregated energy use and greenhouse gas emission footprints in Canada's iron, gold, and potash mining sectors. Resources, Conservation and Recycling, vol. 152. 104485. https://doi.org/10.1016/j.resconrec.2019.104485 [ Links ]
Lawrence, A., Thollander, P., Andrei, M., and Karlsson, M. 2019. Specific energy consumption/use (SEC) in energy management for improving energy efficiency in industry: Meaning, usage and differences. Energies, vol. 12. https://doi.org/10.3390/en12020247 [ Links ]
Levesque, M. 2015. An improved energy management methodology for the mining industry. PhD thesis,_Laurentian University, Sudbury, Ontario. [ Links ]
Levesque, M., Millar, D., and Paraszczak, J. 2014. Energy and mining - the home truths. Journal of Cleaner Production, vol. 84. pp. 233-255. https://doi.org/10.1016/j.jclepro.2013.12.088 [ Links ]
McGinley, K., Geary, P., and Dodenhoff, J. 2015. Striking gold: How innovations and productivity improvements in the mining industry leverage energy efficiency technologies. Proceedings of the 2015 ACEEE Summer Study on Energy Efficiency in Industry. American Council for an Energy Efficient Economy, pp. 6-1-6-10. https://www.aceee.org/files/proceedings/2015/data/papers/6-210.pdf [ Links ]
Medved, M., Ristovic, I., Roser, J., and Vulic, M. 2012. An overview of two years of continuous energy optimization at the Velenje Coal Mine. Energies, vol. 5. https://doi.org/10.3390/en5062017 [ Links ]
Mogodi, P. 2012. Analysis of energy consumption, economics and management at New Denmark Colliery. MSc thesis, University of the Witwatersrand, Johannesburg. [ Links ]
Msimanga, B. 2015. Exploring the impacts of renewable energy and energy efficiency policies on the mining sector. MCom thesis, Stellenbosch University, Stellenbosch. [ Links ]
Nadler, S. and Kros, J. 2007. Forecasting with Excel: Suggestions for managers. Spreadsheets in Education, vol. 2, no. 2. https://sie.scholasticahq.com/article/4545-forecasting-with-excel-suggestions-for-managers [ Links ]
Pretorius, C.B. 2016. Development of a demand and response programme for the coal mining industry. MSc Eng thesis, Stellenbosch University, Stellenbosch. [ Links ]
PricewaterhouseCoopers. 2020. Impact of energy efficiency measures for the year 2018-19. Bureau of Energy Efficiency Ministry of Power, Government of India, New Delhi. [ Links ]
Riehmann, P., Hanfler, M., and Froehlich, B. 2005. Interactive Sankey diagrams. Proceedings of the IEEE Symposium on Information Visualization, 2005. INFOVIS 2005. pp. 233-240. https://doi.org/10.1109/INFVIS.2005.1532152 [ Links ]
Rosenberg, S.A. and Winkler, H. 2011. Policy review and analysis: Energy efficiency strategy for the Republic of South Africa. Journal of Energy in Southern Africa, vol. 22. pp. 67-79. https://doi.org/10.17159/2413-3051/2011/v22i4a3230 [ Links ]
Ryan, G. 2014. Energy management by platinum companies in South Africa: Exploring mitigation strategies for reducing the impact of electricity price increases. Proceedings of the 6th International Platinum Conference, 'Platinum - Metal for the Future'. Southern African Institute of Mining and Metallurgy, Johannesburg. pp. 299-308. [ Links ]
Sahoo, S.K., Varma, P., Lall, K.P., and Talwar, C.K. 2016. Energy efficiency in India: Achievements, challenges and legality. Energy Policy, vol. 88. pp. 495-503. https://doi.org/10.1016/j.enpol.2015.10.049 [ Links ]
Sebitosi, A.B. 2008. Energy efficiency, security of supply and the environment in South Africa: Moving beyond the strategy documents. Energy, vol. 33. pp. 1591-1596. https://doi.org/10.1016/j.energy.2008.08.003 [ Links ]
Semelane, S., Nwulu, N., Kambule, N., and Tazvinga, H. 2021. Evaluating available solar photovoltaic business opportunities in coal phase-out regions - An energy transition case of Steve Tshwete local municipality in South Africa. Energy Policy, vol. 155. 112333. https://doi.org/10.1016/j.enpol.2021.112333 [ Links ]
Soofastaei, A., Karimpour, E., Knights, P., and Kizil, M., 2018. Energy-efficient loading and hauling operations. Energy Efficiency in the Minerals Industry, Green Energy and Technology. Springer, Cham. pp. 121-146. [ Links ]
Sterling, D. 2010. Identifying opportunities to reduce the consumption of energy across mining and processing plants. Proceedings of the 21st World Energy Congress, Montreal. www.instrumentation.co.za/papers/C13070.pdf?a [ Links ]
Strandberg, R. 2015. Using time series analysis to forecast daily municipal water demand. Batchelor's thesis, Stockholm University, Stockholm. file:///C:/Users/AntonyCowey/Downloads/2015_24_report.pdf [ Links ]
Tshisekedi, J.R.N. 2008. Energy consumption standards and costs in South African gold and platinum mines. MEng thesis, University of the Witwatersrand, Johannesburg. [ Links ]
US Department of Energy. 2015. Energy Intensity Baselining and Tracking Guidance. https://www.energy.gov/sites/prod/files/2015/02/f20/Energy%20Intensity%20Baselining%20and%20Tracking%20Guidance.pdf [ Links ]
Wang, F., Wang, P., Xu, X., Dong, L., Xue, H., Fu, S., and Ji, Y. 2017. Tracing China's energy flow and carbon dioxide flow based on Sankey diagrams. Energy, Ecology and Environment, vol. 2. pp. 317-328. https://doi.org/10.1007/s40974-017-0070-y [ Links ]
Wang, N. 2018. Developing a more comprehensive energy efficiency index for coal production: Indicators, methods and case study. Energy, vol. 162. 944-952. [ Links ]
Winkler, H., Tyler, E., Keen, S., and Marquard, A. 2021. Just transition transaction in South Africa: an innovative way to finance accelerated phase out of coal and fund social justice. Journal of Sustainable Finance & Investment, vol.13, no.3. pp.1228-1251. https://doi.org/10.1080/20430795.2021.1972678 [ Links ]
Zhang, L. 2016. On the energy and separation efficiency of dense medium cyclone coal beneficiation processes. PhD thesis, University of Pretoria, Pretoria. [ Links ]
 Correspondence:
K.E. Langerman
Email: klangerman@uj.ac.za
Received: 19 Oct. 2021
Accepted: 25 Aug. 2023
Published: September 2023

