


Services on Demand
Article
 English (pdf)
 Article in xml format
 Article references
Indicators

Related links
-
 Cited by Google
 -
 Similars in Google
Share

 Permalink
Journal of the Southern African Institute of Mining and Metallurgy
On-line version ISSN 2411-9717
Print version ISSN 2225-6253
J. S. Afr. Inst. Min. Metall. vol.123 n.9 Johannesburg Sep. 2023
http://dx.doi.org/10.17159/2411-9717/2645/2023
PROFESSIONAL TECHNICAL AND SCIENTIFIC PAPERS
Optimization of shape factor by the response surface method, and the effect on sphalerite flotation recovery
T. Uysal
Rare Earth Elements Application and Research Center, Munzur University, Tunceli, Türkiye. http://orcid.org/0000-0003-1643-6725
SYNOPSIS
Various morphological parameters that affect the flotation recovery of sphalerite were modelled and optimized using the response surface method (RSM). The effects of roughness value, shape factor, and collector concentration were investigated using the central composite full design method. The results were evaluated by analysis of variance. The optimum roughening time was found to be 25 minutes, the optimum roughness value was 2.9071 um, and the optimum collector concentration was 0.001 M. Using these values, a flotation recovery of 98.01% was obtained. Similarly, in shape factor studies, the optimum grinding time was 15 seconds, the optimum roundness value 0.7421, and the optimum collector concentration 0.0009 M, which resulted in a flotation recovery of 94.30%. The average error between the optimization results and the experimental results was estimated to be less than 6%, and the R2 values were greater than 90%. The study shows that RSM can be effectively applied in finding the economic optimum condition for obtaining maximum flotation recovery with minimum reagent consumption.
Keywords: sphalerite flotation, roughness, roundness, optimization.
Introduction
Particle morphology is the study of the surface shapes of particles. The major parameters are shape factor and roughness. Shape factor, roundness, angularity, and flatness are evaluated in two dimensions, while roughness is evaluated in three dimensions. In flotation studies, it is known that more angular particles result in higher recovery than round particles. This shows the role of the shape factor in flotation processes, and important gains can be achieved with appropriate particle morphology (Uysal and Güven, 2022). Another important parameter for particle morphology is roughness, or the topography on the solid surface (Rezai et al., 2010). Particle flotation and aggregation increase significantly with increasing roughness values (Uysal et al., 2021; Uysal, Karaagaçlioglu, and Guven, 2021). Recent studies have found that flotation recovery and particle aggregation increase significantly with increasing particle roughness and angularity (Yekeler, Ulusoy, and Hiçyilmaz, 2004; Vizcarra et al., 2011; Güven, Çelik, and Drelich, 2015; Güven and Çelik, 2016).
In the flotation of ores, the optimum distribution of flotation reagents and the optimization of the process parameters are of particular importance. Under optimum conditions it might be possible to develop a process flow sheet for economical sphalerite production (Mehrabani et al., 2010). Optimization entails the use of statistical methods and approaches in interpreting, and analysing experimental engineering data. In traditional methods the effect of each variable on the process is examined in turn, the other variables being kept constant. This approach does not allow the effects of the variables on the process performance to be evaluated concurrently. It has become necessary to develop an experimental design that will measure the response of the system in order to use resources efficiently, reduce the number of experiments, save cost and time, and speed up research and development (Khuri and Mukhopadhyay, 2010; Aygün, 2012).
The response surface method (RSM) has been developed for the planning and execution of experiments, and its use has become widespread in recent years. The RSM is constructed through model regression. The magnitude of the main effect of the variable on the process or its interaction with other variables on the value of the response variable is determined by the regression coefficient. The optimum value can be obtained by determining the effects on the responses using response surface patterns. Thus, using several experimental combinations, variable values and combinations that have not actually been tested can be estimated. The purpose of creating a 'response surface' is to predict a region that comprises the desired properties and the optimum point of this region in a design plane consisting of many variables that affect the result in an experimental study. Results are statistically tested by analysis of variance (ANOVA) with 95% confidence. Thus, significance levels provide information about the reliability of the data (Turan and Altundogan, 2011).
In industry, the type and conditions of the milling process have a significant impact on particle shape and roughness (Verrelli et al., 2014; Rezai et al., 2010; Koh et al., 2009; Feng and Aldrich, 2000). In this context, by redesigning the milling process, particles can be produced with the desired morphology; flotation recovery will increase, and flotation collector consumption will be significantly reduced. In this study, the optimization of flotation parameters of sphalerite samples was investigated by RSM using roughness value, roundness value, and potassium amyl xanthate (KAX) concentration as independent variables. The effects of these parameters on the flotation recovery were investigated with a central composite full design, and mathematical models were developed. In addition, the interacting effects of independent variables were modelled by constructing three-dimensional response surface shapes.
Materials and method
Materials
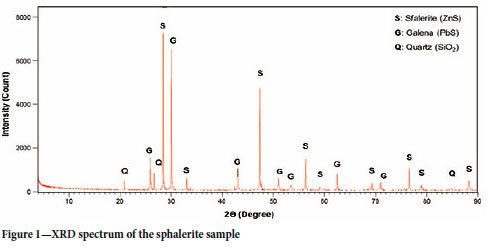
Sphalerite lumps of+25 mm size were supplied by ESAN mining company, Turkey. The crystallinity of the samples was determined by X-ray diffractometry (XRD) using a Bruker D8 Advance instrument employing CuKa radiation from a long fine-focus Cu tube operating at 40 kV and 40 mA. According to the XRD results the sample consisted of 69% sphalerite, 17% galena, and 14% silicate. The XRD spectrum of the sphalerite sample is shown in Figure 1.
Method
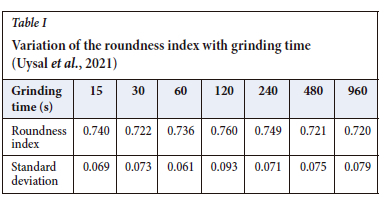
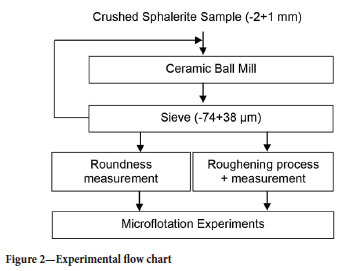
The sample was crushed by a series of jaw, cone, and roll crushers, then ground in a 5200 cm3 volume ceramic cylindrical ball mill with alumina balls to prevent possible contamination from grinding media. Grinding was carried out on the -2+1 mm size fraction, which had a relatively low roundness. Samples were ground for 15, 30, 60, 120, 240, 480, and 960 seconds. The product from each grinding test was subjected to sieving to separate the 74+38 |im fraction, and the roundness values of this fraction were measured. The particles in each sample were photographed using a digital camera. Roundness analysis was performed using the Image J freeware program. The roundness values were calculated using Equation [1] (Forssberg and Zhai, 1985; Ulusoy, Yekeler, and, Hiçyilmaz, 2003; Hassas et al., 2016):

where P is the particle perimeter and A is the area.
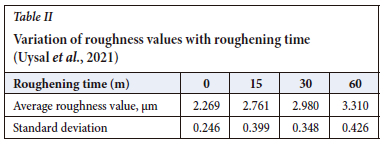
The samples obtained at each grinding time were subjected to roughening with silicon carbide (SiC) with a size of -15 |im and a hardness of about 9.5. The SiC was then separated using a 38 |im vibrating sieve. The roughened samples were pelletized under 10 MPa load for 5 minutes and the roughness of the pressed samples was measured with a contact profilometer (Mitutoyo SV-2100 model, Japan). Care was taken to take as many measurements as possible (approx. 15 measurements) on each pellet surface) and the average value was taken as the roughness. The roundness results for different grinding times for the sphalerite sample are given in Table I, and the roughness results in Table II. The experimental flow chart is shown in Figure 2.
Microflotation experiments
Flotation experiments were carried out in a 25 x 220 mm, 150 mL volume, 15 |im frit column cell and a microflotation cell set up with a magnetic stirrer to prevent the sample in the cell from collapsing. Chemical grade KAX supplied by ECS Chemistry was used as the collector. KAX (C5H11OCS2K) is a highly vigorous non-selective collector commonly used in the flotation of sulphide ores.
For the microflotation experiments, the desired amounts of collector and distilled water were mixed for 3 minutes. The sample was then added and the pulp was conditioned by mixing with a magnetic stirrer for 5 minutes. Tthe conditioned suspension was transferred to the microflotation cell and flotation was carried out with N2 gas supplied to the cell at 3 psi pressure and a flow rate of 50 cm3/min for 1 minute. The float and sink products were filtered on filter paper and dried in an oven, and the flotation recovery calculated.
To test repeatability, all experiments were performed at least three times. All flotation experiments were carried out at natural pH, keeping parameters such as time, mixing speed, and air flow rate constant. Microflotation experiments were carried out on samples with low, medium, and high roundness and roughness values at different KAX concentrations in order to observe the effect of particle morphology. The flotation experiments were carried out with very fine particle size (-74 + 38 |im) and the particles became spherical with the effect of comminution and tended to clump together in the pulp. It has been established that agglomeration increases with roughness and roundness (Uysal et al., 2021).
Experimental design
RSM is a correlation-based experimental design and statistical modelling method that reveals trial patterns that aim to reach the point where the response variable takes its maximum value on the response surface with the least possible number of observation values (Mead and Pike, 1975). Central composite design (CCD) is used extensively in building the second-order response surface models. It is one of the most important experimental designs used in process optimization studies (Obeng, Morrell, and Napier 2005; Aslan and Fidan, 2008). Statistical analyses were performed using Minitab 18 (Version 18.1.0) software. In this study, the central composite design method was used. Results were statistically tested with analysis of variance (ANOVA) with 95% confidence. A total of 13 experiments were performed for two factors according to the central composite full factorial design method (Box and Hunter, 1957; Obeng, Morrell, and Napier, 2005). Response values obtained from the experimental studies, coefficients of the response model, standard deviations, and size were determined by regression analysis. The quadratic polynomial in Equation [2] was used to explain the dependent variables.
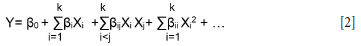
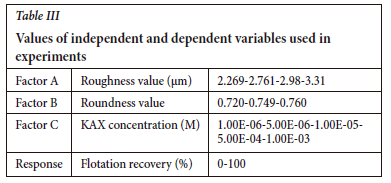
Here, Y is the function of the independent variables coded in terms of dependent variables Xi and Xj. 00 is the regression coefficient, |3i is the linear coefficient, Pu is the quadratic coefficients, and (3ij is the binary interaction coefficient. The values of the independent variable coded in the experimental design and the values of the dependent variable obtained as a result of the experiments are given in Table III.
Results and discussion
Analysis of variance
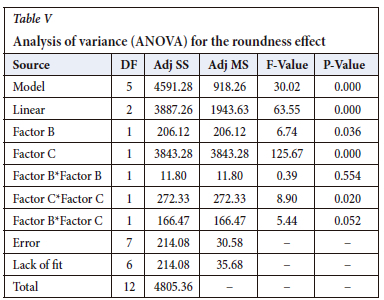
ANOVA was applied to ascertian if there was a significant difference between the means of the factors. ANOVA results showing the effect of roughening on the flotation recovery are given in Table IV, and results showing the roundness effect in Table V.
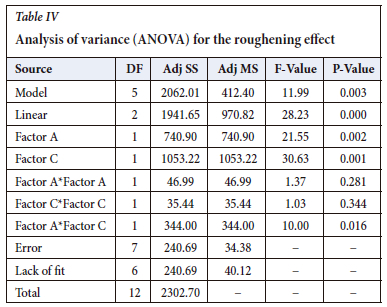
The most important criteria to consider in the ANOVA table are the F-value and the P-value. For a factor to have an effect on the response, the P-value must be less than 0.05 (Box and Hunter, 1957; Obeng, Morrell, and Napier, 2005; Hirotsu, 2017). The F statistic should be used in conjunction with the P-value when deciding whether the overall results are significant. For a factor to have an effect on the response, the P-value must be less than 0.05 (Whitley and Ball, 2002; §imsek and Uslu, 2020). P-values greater than 0.05 mean that the parameter is insignificant or has no effect on the response. Table IV shows that the roughness value and the collector concentration have a significant linear effect on the response. The collector concentration was more effective than the roughness value as indicated by the higher F-value and lower P-value. In addition, Factor A*Factor C was lower than 0.05, so both factors were found to be effective together. The expression of effect indicated here means a positive effect on the response surface. The effect value, on the other hand, is the quantitative expression of the positive or negative effect on the response surface.
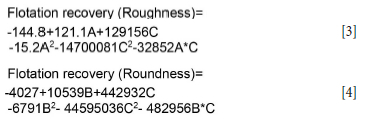
In Table V, it is seen that the roundness value and the collector concentration have a significant effect on the linear response. In addition, Factor B*Factor C was 0.052, so the effect of both factors together was found to be low. The estimated quadratic polynomial model equations proposed by the software program for the flotation recovery response value are given in Equations [3] and [4]. Using these equations, the recovery can be estimated and the experimental result compared with the model estimate. Multiple coefficients of determination and standard deviation values for dependent variables are given in Table VI.
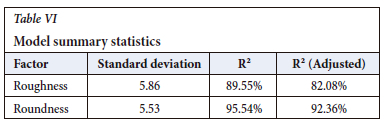
In Table VI, the multiple coefficients of determination are calculated as R2 = 89.55% for roughness, and R2 = 95.54% for roundness. The fact that these values are close to each other and to unity shows the success of the model. In addition, the R2 values and the adjusted R2 values are compatible with each other. This shows that the model fit is high. R2 values greater than 90% were obtained for the responses, and accordingly the RSM model created has the ability to accurately predict the effect on the flotation recovery responses at different roughness, roundness, and collector concentration values. The Pareto chart created by the model is given in Figure 3, and the three-dimensional graphs drawn to better understand the correlation between the factors are in Figure 4.
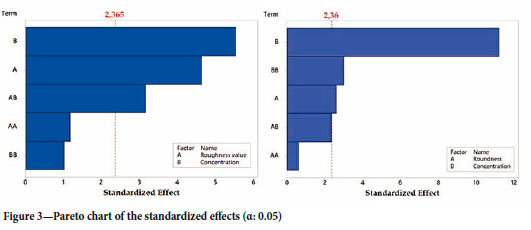
Factors to the left of the dashed red line in the Pareto chart have no effect on the answer, while those to the right have an effect on the answer. In other words, it was observed that the roughness value, roundness, and KAX concentration were effective. In addition, it is seen that the effect of collector concentration is greater than that of the roughness and roundness values. ANOVA analysis also supports this conclusion. It was observed that the effect value of roundness was low. Uysal et al. (2021) also concluded that the shape factor values are very close to each other, so the effect is low compared to other parameters. The lowest form factor value is 0.720, while the highest value is 0.760, a difference of only 0.040.
As seen in Figure 4, as the roughness and KAX concentration increase, the flotation recovery increases significantly. Efficiency similarly increases. It is clear that the effect of collector concentration on flotation recovery is greater than that of the roughness and roundness. Also, the roughness value is more effective than the roundness value. While the flotation recovery is 41.10% at the lowest roundness and lowest KAX concentration, it increases to 52.27% at the lowest roughness and lowest concentration value. Thus, the order in which the factors affect the flotation recovery is collector concentration > roughness > roundness. The correlation of the parameters with the flotation recovery was determined by the Minitab program, as was the Pearson correlation coefficient for linear curves. Accordingly, the closer the coefficient value is to ±1, the stronger the correlation. The correlation coefficient between roundness and flotation recovery was found to be 0.151, and the P-value 0.622. This result indicates a weak positive correlation. Similarly, the Pearson correlation coefficient between roughness and flotation recovery was found to be 0.586, and the P-value 0.035. This indicates a strong positive correlation.
Optimization and validation
The aim of the optimization is to determine the optimum roughness value, roundness, and collector concentration and to obtain the highest flotation recovery corresponding to the optimum operating conditions. All factors were optimized simultaneously. The results are shown in Table VII and the contour graph created by the model is shown in Figure 5.
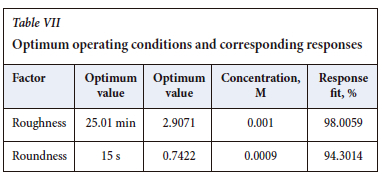
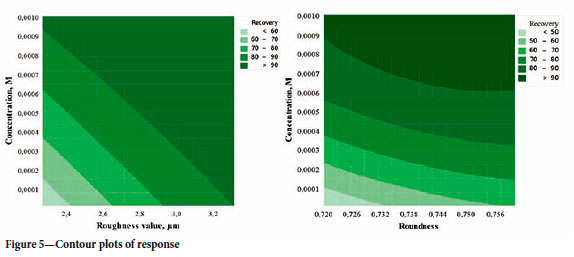
The optimum roughness value was found to be 2.9071 |im and the optimum collector concentration was 0.001 M. The response corresponding to the optimum roughness value and collector concentration is 98.01% recovery. Similarly, the optimum roundness value is 0.7421, the optimum KAX concentration is 0.0009 M, with a flotation recovery is 94.30% for these values.
The contour plots in Figure 5 confirm the optimization results. It is seen that as the roughness value increases, a high flotation recovery is obtained even at low collector concentrations. The roughness value is a very effective parameter. For example, while the efficiency is 60-70% in the 0.0001 M concentration region at a roughness value of 2.4, it increases to 80-90% at the same concentration at a roughness value of 3.2. Although the roundness value is not as effective as the roughness value, similarly, as the roundness value increases the same flotation recovery is obtained at a lower concentration value. Thus, even at low collector concentrations, higher flotation recovery can be obtained by optimizing the shape factor.
The optimum operating parameters obtained from the optimization exercise and the experimental results were compared. The results and the percentage errors are given in Tables VIII and IX. The errors were calculated with the formula in Equation [5].

It can be said that the optimization study was successful because the mean error value was below 6% for both morphological parameters. In the literature, there are studies with a similar or higher error (Kumar et al., 2020). Obviously, the values optimized by RSM were deduced to be significant.
Conclusions
In order to obtain the highest flotation recovery, the optimum roughness value, roundness, and collector concentration were determined and an optimization study was carried out using RSM.
> The roughness value and the collector concentration have a significant effect on the flotation response. The collector concentration value is more significant than the roughness and roundness values. The weak effect of roundness may be due to the fact that the roundness values are quite close to each other. The order of effectiveness of the parameters on the flotation recovery is concentration > roughness > roundness.
> The correlation of the parameters with flotation recovery was determined by the Minitab program. Accordingly, while the correlation between roundness and flotation recovery is weak, there is a strong correlation between roughness and flotation recovery and collector concentration and flotation recovery.
> According to the roughness studies, the optimum roughening time was found to be 25 minutes, the optimum roughness value was 2.9071 |im, and the optimum collector concentration was 0.001 M. Using these values, the flotation recovery was found to be 98.01%. Similarly, in shape factor studies, the optimum grinding time is 15 seconds, the optimum roundness value is 0.7421, and the optimum collector concentration is 0.0009 M, for a flotation recovery of 94.30%.
> The optimization study was successful, as indicated by the R2 values being greater than 90% for all responses obtained as a result of the regression, and the mean error value for both morphological parameters being less than 6%. This shows that the RSM model has the ability to accurately predict the effect of different morphological particles on flotation recovery.
Acknowledgement
The authors thank Professor DrMehmet Sabri Çelik and Dr Onur Güven for their contributions. This study was supported by The Scientific and Technological Research Council of Turkey (TUBITAK) with Project Number 117M659, and we thank TUBITAK 2218 Scholarship program for financial support.
References
Aslan, N. and Fidan, R. 2008. Optimization of Pb flotation using statistical technique and quadratic programming. Separation and Purification Technology, vol. 62, no. 1. pp. 160-165. [ Links ]
Aygun, A. 2012. Treatment of textile industry reactive and disperse dye bath waste water by electrocoagulation process: Optimization by response surface method. PhD thesis, Institute of Science and Technology, Selcuk University, Türkiye. [ Links ]
Box, G.E.P. and Hunter, J.S. 1957. Multi-factor experimental design for exploring response surfaces. Annals of Mathematical Statistics, vol. 28. pp. 195-241. [ Links ]
Feng, D. and Aldrich, C. 2000. A comparison of the flotation of ore from the Merensky Reef after wet and dry grinding. International Journal of Mineral Processing, vol. 60, no. 2. pp. 115-129. [ Links ]
Forssberg, E. and Zhai, H. 1985. Shape and surface properties of particles liberated by autogenous grinding. Scandinavian Journal of Metallurgy, vol. 14. pp. 25-32. [ Links ]
Guven, O. and Çelik, M.S. 2016. Interplay of particle shape and surface roughness to reach maximum flotation efficiencies depending on collector concentration. Mineral Processing and Extractive Metallurgy Review, vol. 37, no. 6. pp. 412-417. [ Links ]
Guven, O., Çelik, M.S., and Drelich, J. 2015. Flotation of methylated roughened glass particles and analysis of particle-bubble energy barrier. Minerals Engineering, vol. 79. pp. 125-132. [ Links ]
Hassas, B.V., Caliskan, H., Guven, O., Karakas, F., Cinar, M., and Çelik, M.S. 2016. Effect of roughness and shape factor on flotation characteristic of glass beads. Colloids and Surfaces A, vol. 492. pp. 88-99. [ Links ]
Hirotsu, C. 2017. Advanced Analysis of Variance. Wiley. https://doi:10.1002/9781119303374 [ Links ]
Khuri, A.I. and Mukhopadhyay, S. 2010. Response surface methodology. WIREs Computational Statistics. https://doi.org/10.1002/wics.73 [ Links ]
Koh, P.T.L., Hao, F.P., Smith, L.K., Chau, T.T., and Bruckard, W.J. 2009. The effect of particle shape and hydrophobicity in flotation, International Journal of Mineral Processing, vol. 93. pp. 128-134. [ Links ]
Kumar, A.N., Kishore, P.S., Raju, K.B., Ashok, R., Vignesh, A.K., Jeevanantham, K., Nanthagopal, and Tamîlvanan, A 2020. Decanol proportional effect prediction model as additive in palm biodiesel using ANN and RSM technique for diesel engine. Energy, vol. 213. 119072. [ Links ]
Mead, R. and Pike, D.J. 1975. A review of response surface methodology from biometric viewpoint. Biometrics, vol. 31, no. 4. pp. 803-851. [ Links ]
Mehrabani, J.V., Noaparast, M., Mousavi, S.M., Dehghan, R., and Ghorban, A. 2010. Process optimization and modelling of sphalerite flotation from a low-grade Zn-Pb ore using response surface methodology. Separation and Purification Technology, vol. 72, no. 3. pp. 242-249. [ Links ]
Obeng, D.P., Morrell, S., and Napier, T.J.N. 2005. Application of central composite rotatable design to modeling the effect of some operating variables on the performance of the three-product cyclone. International Journal of Mineral Processing, vol. 76. pp. 181-192. [ Links ]
Rezai, B., Rahimi, M., Aslani, M.R., Eslamian, A., and Dehghani, F. 2010. Relationship between surface roughness of minerals and their flotation kinetics. Proceedings of the XI International Seminar on Mineral Processing Technology. National Metallurgical Laboratory, Jamshedpur, India. pp. 232-238. [ Links ]
Símsek, S. and Uslu, S. 2020. Investigation of the effects of biodiesel/2-ethylhexyl nitrate (EHN) fuel blends on diesel engine performance and emissions by response surface methodology (RSM). Fuel, vol. 275. 118005. [ Links ]
Turan, M.D. and Altundogan, H.S. 2011. Use of response surface methods (RSM) in hydrometallurgical research. Scientific Mining Journal, vol. 50, no. 3. pp. 11-23. [ Links ]
Ulusoy, U., Yekeler, M., and Hiçyilmaz, C. 2003. Determination of the shape, morphological and wettability properties of quartz and their correlations. Minerals Engineering, vol. 16. pp. 951-964. [ Links ]
Uysal, T. and Guven, O. 2022. The effect of shape factor on flotation and aggregation of galena ore. Journal of Engineering and Architecture Faculty of Eskisehir Osmangazi University, vol. 30, no. 3. pp. 348-356. [ Links ]
Uysal, T., Karaagaçlioglu, I.E., and Guven, O. 2021. Effect of particle roughness on flotation and aggregation of galena mineral. Scientific Mining Journal, vol. 60, no. 4. pp. 191-196. [ Links ]
Uysal, T., Guven O., Ozdemir, O., Karaagaçlioglu, I.E., Tunç, B., and Çelik, M.S. 2021. Contribution of particle morphology on flotation and aggregation of sphalerite particles. Minerals Engineering, vol. 165. 106860. [ Links ]
Verrelli, D.I., Bruckard, W.J., Koh, P.T.L., Schwarz, M.P., and Follink, B. 2014. Particle shape effects in flotation. Part 1: Microscale experimental observations. Minerals Engineering, vol. 58. pp. 80-89. [ Links ]
Vizcarra, T.C., Harmer, S.L., Wightman, E.M., Johnson, N.W., and Manlapig, E.V. 2011. The influence of particle shape properties and associated surface chemistry on the flotation kinetics of chalcopyrite, Minerals Engineering, vol. 24. pp. 807-816. [ Links ]
Whitley, E. and Ball, J. 2002. Statistics review 3: Hypothesis testing and P values. Critical Care, vol. 6. 222. [ Links ]
Yekeler, M., Ulusoy, U., and Hiçyilmaz, C. 2004. Effect of particleshape and roughness of talc mineral ground by different mills on the wettability and floatability. Powder Technology, vol. 140, no. 1-2. pp. 68-78. [ Links ]
 Correspondence:
T. Uysal
Email: turan.uysal@inonu.edu.tr
Received: 20 Feb. 2023
Revised: 6 Sept. 2023
Accepted: 6 Sept. 2023
Published: September 2023

