Services on Demand
Article
Indicators
Related links
-
 Cited by Google
 -
 Similars in Google
Share
Journal of the Southern African Institute of Mining and Metallurgy
On-line version ISSN 2411-9717
Print version ISSN 2225-6253
J. S. Afr. Inst. Min. Metall. vol.123 n.5 Johannesburg May. 2023
http://dx.doi.org/10.17159/2411-9717/2063/2023
PILLAR DESIGN EDITION
A proposed method for optimizing coal pillar design using coalfield-specific uniaxial compressive strength
F.J.N. BruwerI, II; T.R. StaceyII
IAnglo American Platinum, South Africa
IIUniversity of the Witwatersrand, South Africa
SYNOPSIS
The research described considers whether the variability in coal material strength, as derived through a series of uniaxial compressive strength (UCS) tests, could be used to indicate the variability in coal pillar strength. The aim is to be able to use a distribution of UCS tests as input into the coal pillar strength calculation. This will allow the pillar design to be expressed in terms of a probability of failure rather than as the commonly used safety factor. To achieve this, the bulk strength factor associated with commonly used pillar strength formulae was replaced with a distribution of UCS results divided by an adjustment factor. The factor was determined so as to ensure that the resulting bulk strength does not deviate from the statistically determined bulk strength published in the original formulae. This approach enabled pillar strength distributions to be obtained using industry-accepted strength formulae, subsequently allowing for a probability of failure to be calculated for a specific pillar design. Using a regional coal material strength curve as a baseline, coalfields in which the coal is stronger than the regional mean can be identified and the pillar designs optimized. This is based on the stronger coals achieving lower probabilities of failure at similar safety factors. The research has considered actual UCS data from multiple mines in the Mpumalanga coalfields of South Africa, and has proved that the variability in material strength between coalfields could allow for some optimization using the proposed approach. Based on the data used in the study, a 2.78% increase in extraction could be achieved. However, further research will be required to validate the results of the study in an underground environment.
Keywords: coal, pillar design, probability of failure, uniaxial compressive strength.
Introduction
Very few methods exist that allow for a pillar design to be based on the material strength in a specific coalfield. One example is the work by Salamon and Canbulat (2006). The advantage of such methods is that they allow for pillars in stronger coal strata to be optimized relative to weaker coals. There have been multiple attempts to extrapolate coal pillar strength from UCS test results; however, none of these studies was able to accurately correlate pillar strength with the strength of the intact rock mass.
Unlike these studies, the research discussed in this report did not attempt to extrapolate pillar strength from UCS results, but rather investigated whether the variability in coal material strength, as observed in UCS data, could be used to estimate the variability in the strength of pillars. In so doing, the strength of a coal pillar can be expressed as a probability density function rather than a single strength value. This allows for the design to be expressed in terms of probability of failure rather than the more commonly used safety factor. As a result, the pillar size required to ensure stability could be optimized for coals with notably stronger material strengths.
Principles behind the research
A probability of failure can be determined by expressing multiple safety factors in the form of a probability density function (Hoek, 2007). The safety factor constitutes the ratio between the capacity of a design and the demand or load induced on that design. A safety factor above unity would therefore indicate that the capacity is greater than the demand and the design will be stable. A safety factor below unity would indicate instability. The concept is mathematically expressed in Equation [1].

By introducing a data distribution into either the capacity or the demand (or both), the resulting safety factor can be expressed as a probability density function. Empirical pillar strength equations make use of a statistically determined bulk strength value, k, to express the strength of a unit cube of coal. In the current pillar strength formulae. This bulk strength is multiplied with an adjusted width to height ratio to estimate the strength of a pillar. The common power-law formula on which many of these pillar strength equations are based, is given in Equation [2].

where S is the pillar strength, k is a statistically derived number related to the strength of the coal, h is the pillar height, w is the pillar width, and α and β are dimensionless constants.
Assumptions applied to the analysis
The study made use of the following assumptions:
> Pillar loading is accurately expressed by the application of the Tributary Area Theory (TAT), where every similar sized pillar carries an equal overburden load
> The set of UCS results used in the study, obtained from various South African collieries in Mpumalanga Province, provides a realistic indication of the strength of, and variability in, the coal in Mpumalanga coalfields.
History of coal pillar strength estimation
Several authors (Bieniawski, 1968; Wagner, 1974; van Heerden, 1975) have attempted to extrapolate coal pillar strength by studying the strength of small coal samples. None of the tests, however, provided definitive results in estimating coal pillar strength. Salamon and Munro (1967) opted for an empirical solution, compiling a database consisting of 125 pillar 'cases'. From the 125 data entries, 98 represented stable cases (unfailed) with the remaining 27 representing pillars that failed. Using the two data-sets, Salamon and Munro (1967) considered a probabilistic approach to describe the data, known as the maximum likelihood approach. The final pillar strength formula proposed by Salamon and Munro (1967) is shown in Equation [3].

Madden et al., (1995) conducted a re-analysis of an updated pillar failure database which contained 17 additional failures compared with the Salamon and Munro (1967) database. The results correlated well with those obtained by Salamon and Munro (1967), and although a different strength formula was obtained, the difference was not sufficient to warrant the replacement of the original Salamon and Munro (1967) formula. The failure database was again updated by van der Merwe (2003) with an additional 28 failures, while the 'unfailed' data-set consisted of the same 98 cases described in Salamon and Munro's (1967) study.
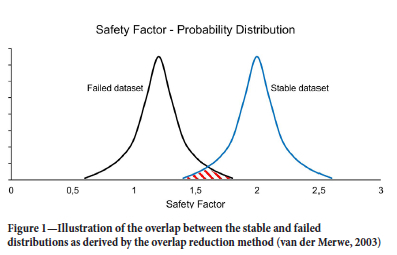
Van der Merwe (2003) approached the data analysis with what has become known as the overlap reduction method. This method presented both the failed and unfailed data-sets as probability distributions, arguing that the ideal formula would result in a complete separation between the two curves. The concept is illustrated in Figure 1.
The analysis resulted in the pillar strength formula in Equation [4].

where h is the pillar height and w is the pillar width.
In 2013 another update was made to the pillar failure database, this time by van der Merwe and Mathey (2013a). The updated database consisted of a total of 86 failed cases and 337 unfailed cases, and the analysis made use of both the overlap reduction and maximum likelihood methods. As a result, two formulae were produced. The maximum likelihood method provided Equation [5] while the overlap reduction approach resulted in Equation [6].

With specific focus on the variability in the strength of coal between various seams, Madden and Hardman (1992) conducted a comparison between their pillar strength formula and that of Salamon and Munro (1967) using data from different seams. Interestingly, they found that the differences between individual seams were statistically very minor, and they concluded that an average strength value could be used to effectively represent the different seams. Bertuzzi (2016) found, in a comparison of coal strengths between Australia, South Africa, the USA, India, and the UK, that the coal strengths between the different reserves, although not exactly equal, were very similar.
Contrary to this, van der Merwe (2016) stated that there is sufficient evidence indicating that the strength of coal is highly variable. A study by Salamon, Canbulat, and Ryder (2006), aimed at determining seam-specific strengths by means of back-analysis, also concluded that significant variations exist between coalfields. Van der Merwe and Mathey (2013a, 2013b) also highlighted the fact that the strength of coal varies between different coalfields and coal seams.
The use of uniaxial compressive strength in defining pillar strength
There have been many attempts to use the UCS of coal to estimate pillar strength, none of which returned usable results. York and Canbulat (1998) provide a detailed summary of these attempts, all of which led to the conclusion that the extrapolation of pillar strength from a laboratory sample is significantly affected by the 'scaling' effect. The scaling effect refers to the estimated reduction in sample strength obtained with increasing size of the sample.
A study of particular relevance to this report is that of Mark and Barton (1996), who investigated whether a stronger seam makes for a stronger pillar when extrapolating strength according to volume from laboratory coal samples. This was achieved by using UCS results from various seams to estimate the specific pillar strength associated with each seam. The pillar strengths were extrapolated using Gaddy's (1956) relationship and factors of safety were calculated using the Analysis of Retreat Mining Pillar Stability (ARMPS) formula of Mark, Chase, and Campoli (1995). Safety factors were calculated for the approximately 100 case histories used in the development of the ARMPS formula, with the case histories providing an almost even split between failed and unfailed pillars. The assumption in the study was that the weaker coal material would make for weaker pillars that would therefore show failure at a higher safety factor. The study, however, showed that the use of a uniform bulk pillar strength provides a significantly better fit to the back-analysis of case histories compared to the results based on the individual coal seam strengths. From this, Mark and Barton (1996) concluded that the use of seam-specific strength becomes meaningless when designing coal pillars, and that the use of a uniform bulk strength value of 6.2 MPa is preferred (specific to the US coalfields). Mark and Barton (1996) argued that one of the key reasons that laboratory results are not suited to the estimation of pillar strength is because a pillar is significantly influenced by geological features not represented in the sample. As a result, the laboratory sample will not only be significantly stronger, but the failure mechanisms for sample and pillar will differ. This being the case, full-scale pillar testing is currently not feasible, and even if it were, multiple pillar tests would be required to provide sufficient understanding of the variability in pillar strength within a specific coalfield. Additionally, to conduct a fair comparison between the strengths in various coalfields, a common testing approach is required. Currently one of the most common and relatively inexpensive indications of rock strength remains the UCS test. Despite all its shortfalls in describing pillar strength, it still provides an indication of the strength of the material. The use of a single bulk strength value in the design of pillars also limits the ability to conduct any optimization between reserves.
Research methodology
From a literature study it is clear that historical attempts to extrapolate pillar strength from UCS results by means of scaling did not provide reliable results unless cubic samples larger than 1.5 m were used (Bieniawski, 1968). For the interested reader, van Heerden (1975) provides a summary of large-scale testing programmes conducted on coal samples. The approach adopted for this study was therefore to keep to the bulk strength values determined for each of the formulae by the original authors, introducing UCS results only as a means of expressing variability.
Coal strength data
Coal, being naturally inhomogeneous and anisotropic, differs in strength from one position in a coalfield to the next. It is this variability which requires design engineers to make use of a safety factor when defining a pillar design. To effectively understand the variability in a coal seam, sufficient data-points (UCS test results) are therefore required.
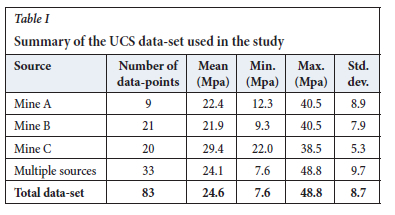
Van der Merwe (2003) and van der Merwe and Mathey (2013) opted to exclude the Kliprivier and Vaal basin pillar data during the development of the linear, maximum likelihood, and overlap reduction strength formulae. Taking this into account, applying these formulae to data sourced from the Vaal Basin is outside of the intended scope of the exercise and could provide unrealistic results. The data used in the current study was therefore sourced only from mines located in the Mpumalanga coalfields. The total data-set consisted of 83 coal UCS results and covered multiple mining operations. To preserve confidentiality, the mining operations are not identified in the study. Most operations had limited UCS data available. However, three mines, referred to as A, B, and C, provided sufficient data to allow the variability in coal strength at each operation to be defined to a satisfactory confidence level. The data used in the study was compiled from various sources, collected over a number of years. As such, not all laboratory reports were available to confirm that the tests adhered to ISRM standard. In the absence of this information, the test results were accepted as representative and accurate. Table I provides a summary of the UCS data used in the study.
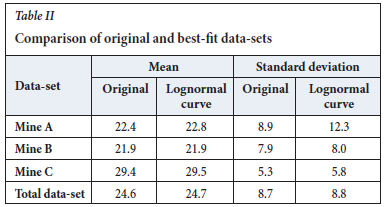
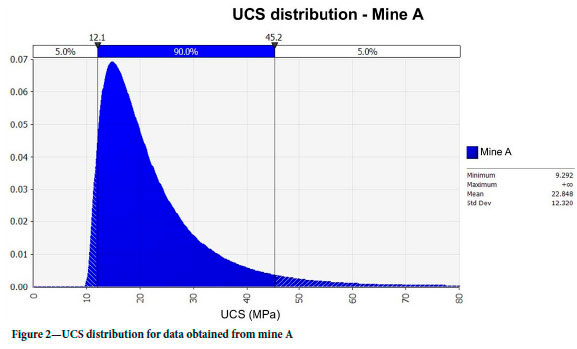
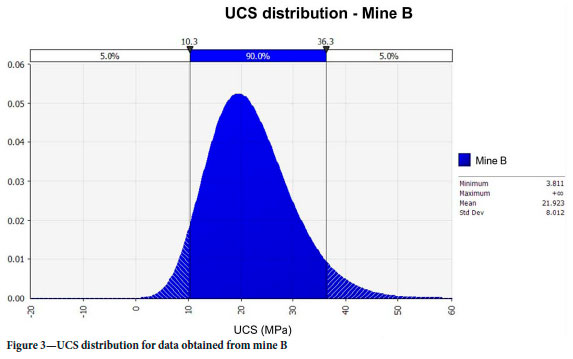
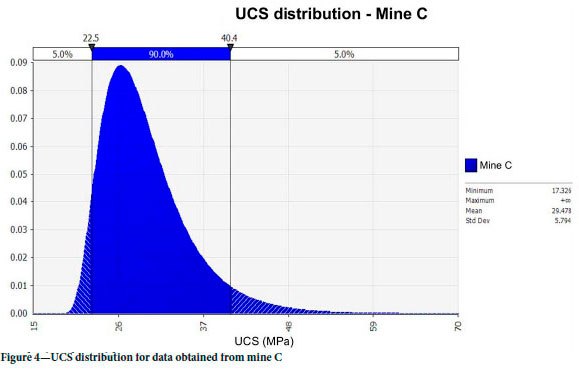
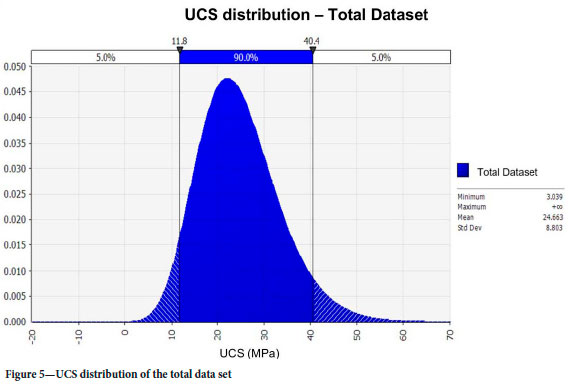
In order to calculate a probability of failure from the UCS data, the data was expressed as probability density functions. To assist with analysis, the function curves were produced using the software program @Risk. The program allows the user to select the statistical function which best fits the distribution of data in a specific data-set by indicating a 'fit ranking' of the available functions. The function selected for the study was Lognormal as this function provided the best representation of the actual distribution of data in each of the data-sets. A comparison between the original data and the lognormal functions is shown in Table II. The resulting distributions are illustrated in Figure 2 to Figure 5.
Pillar database
The South African pillar failure database was ideally suited to the study as it would allow for a direct comparison between the calculation method proposed in the study and the design methods currently used in industry. The latest iteration of the database contains a total of 424 pillar cases and covers a range of pillars at multiple depths (van der Merwe, 2021).
Adjustments to pillar strength formulae
The current pillar strength formulae make use of a statistically determined bulk strength factor (k) to describe pillar strength. This factor, however, is constant regardless of the coalfield being designed for. In order to introduce the variability of the UCS data into the calculation, adjustments were required to the existing pillar strength equations. It should be reiterated that the study is not aimed at extrapolating pillar strength from UCS results, but rather at describing the variability in pillar strength using the variability in UCS results. The intent was therefore to develop an approach that introduced the variability but returns a similar pillar strength to that obtained using the original formulae. This meant that the UCS had to be divided by a factor to ensure that the resulting bulk strength (k) used in the calculation is unchanged from the original formulae. The resulting strength parameter (k) used in the study was therefore calculated using Equation [7].

An appropriate adjustment factor for each formula was calculated using the entire data-set of UCS results. This was to ensure that the final strength factor would be appropriate for any of the Mpumalanga coalfields without being biased to any specific mine or seam. This was achieved by using the mean strength from the total Mpumalanga data-set (24.66 MPa). The final adjustment factor calculated for each of the formulae, was therefore based on the most likely UCS from the Mpumalanga data-set which when divided by the factor, matches the original bulk strength value (k) from the unadjusted equations. The adjusted formulae are listed in Equations [8] to [11].
Adjusted Salamon and Munro (1967) formula:

Adjusted van der Merwe (2003) formula:

Adjusted maximum likelihood formula:

Adjusted overlap reduction formula:

It should be noted that the adjusted formulae are a result of the distribution of UCS values used in this study and are not intended as universal formulae to be used for any operation within the Mpumalanga coalfields. Should a different UCS data-set be used, a different set of equations will be obtained. The aim of the formulae is merely to show the application of the proposed approach . Using the adjusted formulae, it is possible to calculate pillar strength using the strength of the coal material associated with a specific coalfield. Additionally, by expressing the material strength as a distribution of UCS values, the adjusted pillar strength formulae allowed the probability of failure to be calculated for different pillar scenarios.
Calculation of pillar failure probabilities and validation of adjusted pillar strength formulae
The four pillar strength formulae discussed in the previous section are all acceptable methods of calculating pillar strength and have been implemented by various mining houses in South Africa. In order to determine whether the adjustments to the formulae would alter the outcome, a comparison was conducted between the result from the adjusted formulae and those from the original formulae. To enable a direct comparison to be made, the results were stated in terms of safety factor, as probability of failure is beyond the application of the original formulae.
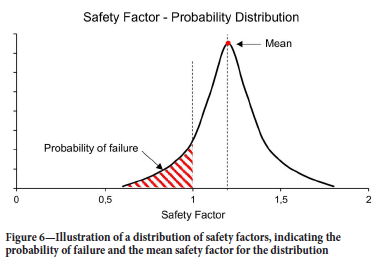
Keeping in mind that the adjusted formulae will produce a distribution of safety factors in order to determine a probability of failure, expressing the results from the adjusted formulae in terms of a single safety factor would require the distribution of safety factors to be reduced to a single representative value. This can easily be achieved by using the mean of the distribution as it represents the safety factor that most frequently occurs in the resulting data distribution (the peak of the distribution curve). Figure 6 illustrates a distribution of safety factors, graphically indicating the difference between the probability of failure obtained from a distribution and the mean of the distribution. In Figure 6, the probability of failure is indicated as the area below the curve for a safety factor less than unity, and is expressed as a percentage of the total area below the curve as shown in Equation [12].

In calculating the distribution of safety factors using the adjusted formulae, the total data-set of 83 UCS values was used. With the adjustments based on the total data-set, the resulting distribution of safety factors should return similar results to the unadjusted formulae. In order to conduct the comparison, a set of baseline pillar scenarios was selected from the South African pillar failure database. The pillar parameters obtained from the database included the pillar width, height, bord width, and depth below surface. In keeping with the industry norm, an overburden density of 2500 kg/m3 was used in all calculations. Subsequently, the only parameter that changed in the comparison was the bulk strength factor (k).
The calculations of pillar safety factor using the original formulae are discussed at length in the earlier sections of the report and will not be repeated here. The safety factors using the adjusted formulae were calculated as follows. The software program @Risk, allows the user to calculate a probability density function using a distribution of values as an input to an equation. The program then simulates results for a pre-set number of iterations. The UCS distributions discussed earlier were used as the input to the UCS parameters of the adjusted formulae. All calculations made use of 1000 iterations to produce a probability density function for each pillar scenario. The resulting distributions indicate the range of pillar strengths expected for each scenario. Using the distribution of pillar strengths as the input into the 'capacity' parameter in Equation [13], a distribution of safety factors is subsequently obtained in @Risk.

These distributions of safety factors are finally used to determine the mean safety factor for each scenario as well as the probability of failure. Probability density functions were calculated for all pillars in the South African pillar failure database (both failed and unfailed data-sets). An example of one of the 424 safety factor distributions (one distribution for each scenario in the database) obtained from @Risk is seen in Figure 7. The probability of failure is automatically calculated in @Risk as the area below the curve. In the example, this is 0.7% of the total area below the curve (based on a dividing line equal to a safety factor of unity).
Table III summarizes the results for five randomly selected pillars from the failed data-set and five from the unfailed data-set. From these results, it can be seen that although isolated scenarios did not provide the exact same safety factor, the difference is never more than 0.01. These results validate the adjusted pillar strength formulae for use in the study.
With the adjusted formulae validated for use, the calculated probabilities of failure were considered. Figure 8 and Figure 9 provide a graphical illustration of the calculated probabilities relative to the safety factors for both the failed and unfailed pillar data-sets. The graphs include the results of all four formulae, and interestingly, the relationship between safety factor and probability of failure remains constant regardless which formula is used. This could, however, be expected as the same distributions of variables were applied to all formulae.
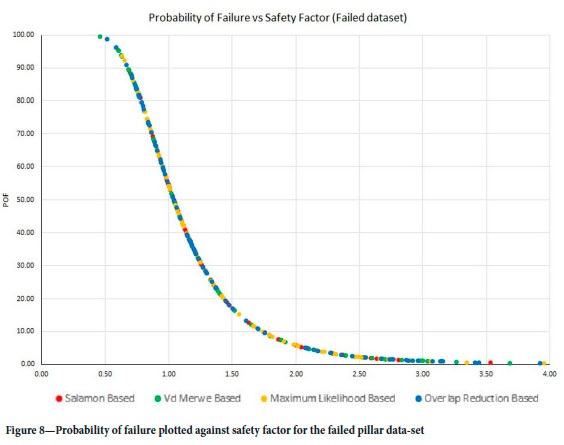
From Figure 8 and Figure 9, a probability of failure of 50% equates to a safety factor of 1.04. This aligns well with the assumption that a safety factor of unity, taken as the divide between stable and unstable pillars, should equate to a probability of failure of 50%. For both graphs, a safety factor of 1.6 is obtained at a probability of failure of 13.8%. Finding a probability of failure that aligns to a safety factor of 1.6 was necessary as a safety factor of 1.6 is commonly accepted as a design threshold for a stable pillar. This same design threshold was required for the probability of failure obtained using the approach proposed in this study. A value of 13.8% was therefore selected as the probability threshold for the interpretation of the results discussed in the following section.
Results obtained from the proposed method
In the previous section, we proposed a method with which pillar probability of failure can be calculated based on the laboratory strength of samples from a specific coal seam or mine. The calculation of the probability of failure is key to the study as this forms the basis with which pillar optimization can be justified. This is done by designing a pillar to the same probability of failure as the baseline pillar obtained using the total UCS data-set (therefore the same pillar strength that would be obtained from the original unadjusted formulae). As a result, the final pillar would have a similar probability of failure as the baseline, but be designed to a lower safety factor provided the coal material is of a higher strength.
To determine whether the variability in coal strength would allow for sufficient optimization in pillar size, the proposed method was applied to the data from mines A, B, and C outlined in Table I.
Earlier in the report it was confirmed that the 'failed' and 'nfailed' data-sets from the pillar failure database yield similar probabilities of failure across a range of safety factors. The decision was therefore made to use only the 'failed' data-set for this part of the study, thus reducing the number of calculations required while still having sufficient data from which to draw conclusions. The 'failed' data-set consists of 87 pillar scenarios and would therefore produce 87 datapoints from which distributions could be plotted. In calculating the safety factors and probabilities of failure for each of the mines, the UCS distributions discussed earlier were applied to the adjusted pillar strength formulae. Figure 10 provides a graphical comparison of the safety factor distributions obtained from each of the four data-sets, being the total Mpumalanga data-set as well as the data from the three individual mines A, B, and C. The distributions in Figure 10 were not graphed using @Risk, as the distributions would not be used as input into further calculations. The distributions were therefore compiled by dividing the results into bins of safety factors and plotting the number of data-points per bin across the range of safety factors applicable.
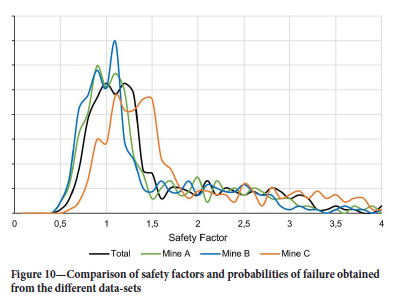
To determine whether the different distributions would allow for any pillar optimization, the distributions for each mine were compared to the original distribution from the total data-set (referred to as the baseline distribution). Should the distribution move towards a higher range of safety factors compared to the baseline distribution, the adjusted formula predicted higher pillar strengths, and pillar optimization would be possible. This would occur when the average UCS from the mine database is higher than the Mpumalanga mean, therefore inferring a stronger pillar material. Should the distribution move towards a lower range of safety factors, the adjusted pillar formula predicted lower pillar strengths and a larger pillar would be required to maintain the probability of failure indicated by the baseline distribution. Figures 11 to 13 provide graphical comparisons of the individual distributions to the baseline. Due to the distributions returning a bimodal curve, the harmonic mean from each distribution was used to provide a quantifiable measure for optimization.
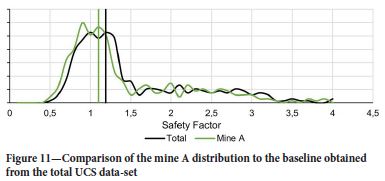
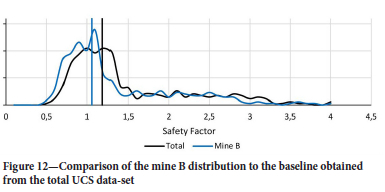
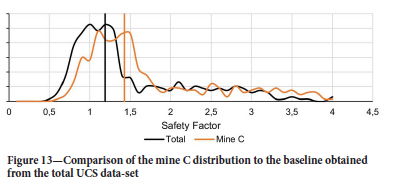
From Figures 11 to 13, it can be seen that the data-sets from mines A and B return lower safety factors compared to the baseline. Mine C, on the other hand, returns higher safety factors. This is in line with expectation when considering the mean UCS from the various data-sets (Table II). Mines A and B have mean UCS values of 22.4 MPa and 21.9 MPa respectively, compared to the total data-set mean of 24.6 MPa. Mine C, however, has a mean UCS of 29.4 MPa, indicating a stronger coal material compared to the Mpumalanga average. Based on these results, the pillars at mine C, could potentially be optimized in size without increasing the probability of failure. Figures 14 to Figure 16 graphically illustrate this effect. In these graphs, the adjusted formulae are compared with the results from the original formulae relative to the probabilities of failure obtained for each data-set. To determine the actual shift in safety factor, a probability of failure of 13.8% was used, as determined from the baseline distribution, to represent a safety factor of 1.6 prior to any adjustment of the formulae.
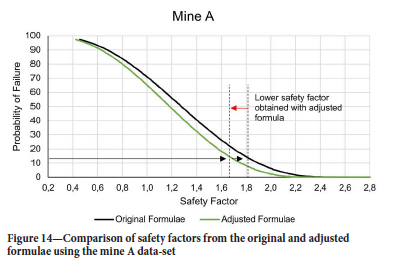
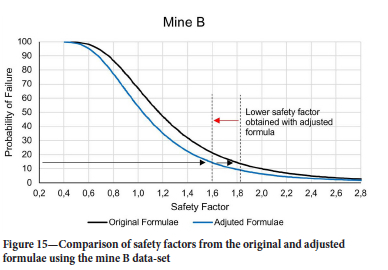
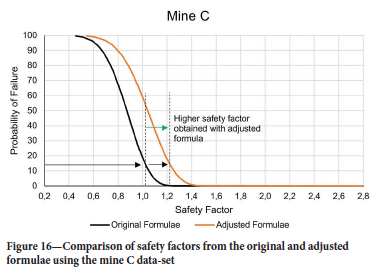
It should be noted that the graphs in Figure 14 to Figure 16 are only used to determine the difference in safety factor at the threshold probability of 13.8 %. The intent is therefore not to match the curve to a safety factor threshold of 1.6. The adjustment to the final pillar dimensions is conducted using the unadjusted formulae and is discussed later.
To quantify the potential for optimization using the data from the various mines, a single mining scenario was required. This would allow for the actual changes in pillar dimensions to be calculated and compared. This comparison was conducted using the parameters from Table IV.

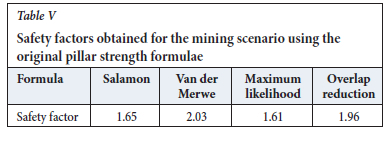
From the parameters in Table IV, the pillar load as calculated based on TAT is 6.33 MPa. The safety factors obtained from the original pillar strength formulae for this scenario are summarized in Table V.
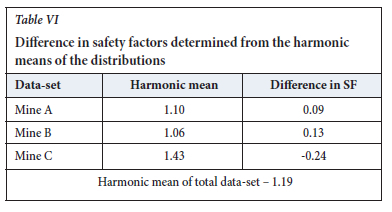
Using the difference in harmonic mean between the data-sets as illustrated in Figures 14 to 16, the allowable difference in safety factor was determined. Table VI summarizes the differences in harmonic means between the total and individual mine data-sets.
The 'optimized' pillar would therefore be designed to the original pillar safety factor, plus or minus the difference, depending on whether the safety factor should increase or decrease. Table VII provides a summary of the updated pillar widths determined from the analysis. The calculations were based on perfectly square pillars. Parameters such as depth below surface, mining height, and bord width were unchanged.
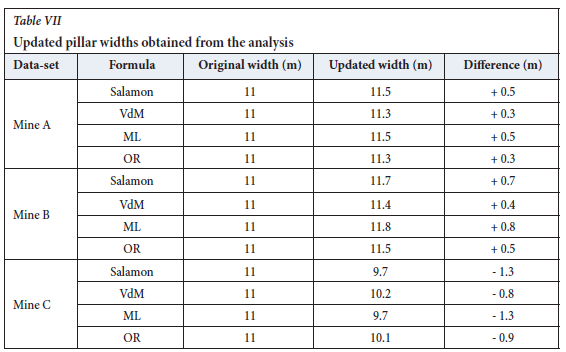
Based on the results from Table VII, the potential gain involves a reduction in pillar width of tbetween 0.8 m and 1.3 m. Due to practical mining considerations, a pillar width will not be adjusted by a value of 0.8 m or 1.3 m. The change would rather be made in increments of 0.5 m. This would mean that the pillar design values using the Salamon and Munro and maximum likelihood formulae would reduce by 1 m, and the van der Merwe and overlap reduction formulae by 0.5 m. To link this to the expected change in production profile, Table VIII provides a summary of the additional tons that could be mined per pillar based on these adjustments.
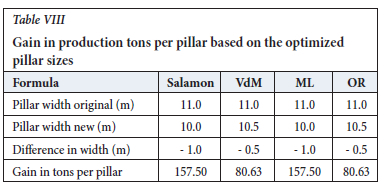
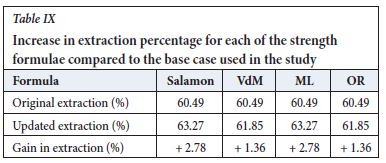
The reduction in pillar sizes stipulated in Table VIII increases the extraction percentage as indicated in Table IX, providing an additional 2.78% for the Salamon and maximum likelihood formulae, and 1.36% for the van der Merwe and overlap reduction formulae. Although the increase appears marginal, it would allow for better resource utilization and could aid in extending the life of a mining operation.
Discussion
From the results, it seems plausible that the method proposed in this study would allow for optimization of pillar design in situations where the coal material is stronger than the regional average. Multiple studies have concluded that pillar strength cannot be extrapolated from UCS results, the most notable being the study by Mark and Barton (1996). This being the case, the method proposed here does not attempt to extrapolate pillar strength from smaller samples by means of scaling, but rather matches the bulk pillar strength of the original formulae using the regional average UCS. The strength of a pillar is subsequently adjusted based on the UCS of the coal material specific to a seam or mine. A similar approach has been adopted in the hard-rock pillar design fraternity, with both Potvin, Hudyma, and Miller (1989) and Lunder and Pakalnis (1997) defining the pillar bulk strength by means of the UCS divided by an adjustment factor. Another approach commonly used in South African hard-rock mines, which supports the link between UCS and pillar strength, is to estimate the pillar bulk strength as one-third of the UCS (Ozbay,Ryder, and Jager, 1995). It is therefore not uncommon to use the UCS of a rock type to describe the expected pillar strength. Van der Merwe (2003) was also able to differentiate and rank the strength of various coals from weakest to strongest using a range of 'small sample' tests. What is different in our approach is the introduction of a distribution of UCS values for describing not only pillar strength, but also variability in pillar strength. This allows a pillar design to be expressed in terms of a probability of failure, which forms the basis on which optimization can be conducted. It should be noted that the use of probability of failure rather than safety factor as a basis for design is not a first in this field. Van der Merwe and Matthey (2013) and van der Merwe (2016) previously adopted a probability approach, which is currently in use on some mines.
A question that remains unanswered, however, is whether the behaviour of a pillar can effectively be estimated using only the UCS of a material without considering the effect that jointing has on the stability of the pillar. The study by Mark and Barton (1996) indicates this as unlikely, based on the inability of a laboratory UCS test to account for natural discontinuities and imperfections in the larger mass. Esterhuizen (2000) studied the effect of jointing on pillar stability using field data from South African coal mines. He concluded that the weakening effect of jointing in a pillar reduces with increasing width to height and is largely dependent on the joint orientation. This presents a challenge as the orientation of jointing in a seam is generally not well defined prior to start of mining and, based on the abovementioned studies, should be accounted for in the pillar design before mining begins.
Another consideration that should be taken into account is that the pillar strength formulae discussed in this report have been implemented in industry for many years without pillars failing abnormally as a result of jointing. This could be attributed to the fact that the pillars recorded in the South African pillar failure database provide an indication of actual pillar behaviour, including the effects of material imperfections, cleating, and discontinuities. This poses the question whether further adjustments to the pillar strength formulae to include the effect of discontinuities are in fact required,
Regardless of whether the effect of discontinuities is sufficiently accounted for in the current pillar strength formulae, the use of UCS test data in expressing pillar strength seems prudent. Additionally, it provides a logical and viable means with which to express probability of failure, based not on the statistical back-analysis of pillar failure data, but on the variability of the coal material as determined by existing laboratory testing methods. These failure probabilities subsequently provide a means with which to potentially optimize pillar design on a mine. The method proposed in this paper does, however, require further validation, ideally by means of underground trials in a controlled environment, to ensure that pillar stability is maintained for as long as underground stability and surface protection are required.
Conclusion
The research described in this paper was conducted on UCS data from actual mines, and proved the potential for pillar optimization by considering the difference in material strength obtained from UCS tests. Based on the data-sets considered, a potential increase in extraction of up to 2.78% could be obtained without any change to the calculated probability of failure. The results assume, however, that the variability in pillar strength can be effectively described by the variability in UCS of a specific seam. The probability of failure is determined from a distribution of safety factors, which in turn is calculated from a distribution of UCS results used in pillar strength formulae adopted from existing methods.
The results of the research confirm on a theoretical basis the applicability of the proposed optimization method. The additional extraction resulting from the optimization would aid in resource utilization as well as extending the life of mine. The results, however, do not imply that the proposed method can be implemented without due consideration. The assumption that the variability in small-scale test samples is representative of the variability in coal pillars remains to be confirmed. To ensure this approach does not compromise long-term pillar stability, further research is required. It is recommended that the optimized pillar sizes obtained from this approach be trialled in a controlled environment where abnormal pillar behaviour will not affect the rest of the mine. Once trial mining confirms that stable behaviour is maintained, the optimized design can be systematically introduced across the remainder of the mine.
References
Bertuzzi, R., Douglas, K., and Möstyn G. 2016. An approach to model the strength of coal pillars. International Journal of Rock Mechanics and Mining Sciences, vol. 89. pp. 165-175. [ Links ]
Bieniawski, Z.T. 1968. The effect of specimen size on compressive strength of coal. International Journal of Rock Mechanics and Mining Sciences, vol. 5. pp. 325-335. [ Links ]
Esterhuizen, G. 2000. Jointing effects on pillar strength. Proceedings of the 19th Conference on Ground Control in Mining, Morgantown, WV. Peng, S.S. and Mark, C. (eds). West Virginia University. [ Links ]
Gaddy, F.L. 1956. A study of the ultimate strength of coal as related to the absolute size of the cubical specimens tested. Bulletin 112, Engineering Experiment Station, Virginia Polytechnic Institute. [ Links ]'
Hoek, Ε. 2007. Practical Rock Engineering. https://www.rocscience.com/assets/resources/learning/hoek/Practical-Rock-Engineering-Full-Text.pdf [accessed 12 May 2020]. [ Links ]
Lunder, P.J. and Pakalnis, R. 1997. Determination of the strength of hard-rock mine pillars. CIM Bulletin, vol, 90, no. 1013. pp. 51-55. [ Links ]
Madden, B.J., Canbulat, I., Jack, B.W., and I'Rohaska, G.D. 1995. A reassessment of coal pillar design procedures. SlMRAC Final Project Report - COL021. CSIR Division of Mining Technology, Pretoria. [ Links ]
Madden, B.J. and Hardman, D.R. 1992. Long-term stability of bord-and-pillar workings. Proceedings of the Symposium on Construction Over Mined Areas, May 1992., South African Institution of Civil Engineers. [ Links ]
Mark, C. and Barton, ΧΜ. 1996. The uniaxial compressive strength of coal: Should it be used to Design Pillars? Proceedings of the 15th International Conference on Ground Control in Mining, Golden, CO. [ Links ]
Mark, C., Chase, F.E., and Campoli, A.A. 1995. Analysis of retreat mining pillar stability. Proceedings of the 14th International Conference on Ground Control in Mining, Morgantown, WV West Virginia University. [ Links ]
Ozbay, M.U., Ryder, J.A., and Jager, A.J. 1995. The design of pillar systems as practiced in shallow hard-rock tabular mines in South Africa. Journal of the South African Institute of Mining and Metallurgy, vol 95, Jan/Feb 1995: pp. 7-18. [ Links ]
Potvin, Y., Hudyma, M.R., and Miller H.D.S. 1989. Design guidelines for open stope support. Bulletin of the Canadian Institute of Mining and Metallurgy; vol. 82. 53262-. [ Links ]
Salamon, M.D.G. and Munro, A.H. 1967. A study of the strength of coal pillars. Journal of the South African Institute of Mining and Metallurgy, vol 67, September 1967. pp. 55-67. [ Links ]
Salamon, M.D.G., Canbulat, I., and Ryder, J.A. 2006. Development of seam-specific strength formulae for South African collieries. Final Report: Task 2.16. Coaltech, Johannesburg. [ Links ]
Van der Merwe, J.N. 2003. New pillar strength formula for South African coal. Journal of the South African Institute of Mining and Metallurgy, vol. 103. pp. 281-292. [ Links ]
Van der Merwe, J.N. 2016. A three-tier method of stability evaluation for coal mines in the Witbank and Highveld coalfields. Journal of the Southern African Institute of Mining and Metallurgy, vol. 116. pp. 1189-1194. [ Links ]
Van der Merwe, J.N., 2021. Coal pillar database. [e-mail]. [ Links ]
Van der Merwe, J.N. and Mathey, M. 2013a. Update of coal pillar strength formulae for South African coal using two methods of analysis. Journal of the Southern African Institute of Mining and Metallurgy, vol. 113. pp. 841-847. [ Links ]
Van der Merwe, J.N. and Mathey, M. 2013b. Probability of failure of South African coal pillars. Journal of the Southern African Institute of Mining and Metallurgy, vol. 113. pp. 849-857. [ Links ]
Van Heerden, W.L. 1975. In situ complete stress-strain characteristics of large coal specimens. Journal of the South African Institute of Mining and Metallurgy, vol 75, March 1975. pp. 207-217. [ Links ]
Wagner, H. 1974. The determination of the complete load deformation characteristics of coal pillars. Proceedings of the 3rd International Congress of the International Society for Rock Mechanics, Denver, CO, December 1974. pp. 1076-1081. [ Links ]
York, G. and Canbulat, I. 1998. The scale effect, critical rock mass strength and pillar system design. Journal of the South African Institute of Mining and Metallurgy, vol 98, January/February 1998. pp. 23-37. [ Links ]
 Correspondence:
F.J.N. Bruwer
Email: franz.bruwer@angloamerican.com
Received: 24 Mar. 2022
Revised: 16 May 2023
Accepted: 29 May 2023
Published: May 2023


