


Services on Demand
Article
 English (pdf)
 Article in xml format
 Article references
Indicators

Related links
-
 Cited by Google
 -
 Similars in Google
Share

 Permalink
Journal of the Southern African Institute of Mining and Metallurgy
On-line version ISSN 2411-9717
Print version ISSN 2225-6253
J. S. Afr. Inst. Min. Metall. vol.123 n.5 Johannesburg May. 2023
http://dx.doi.org/10.17159/2411-9717/2656/2023
PILLAR DESIGN EDITION
A study of UG2 pillar strength using a new pillar database
T.E. Oates; D.F. Malan
Department of Mining Engineering, University of Pretoria, South Africa
SYNOPSIS
A recent experimental pillar extraction project at a UG2 bord-and-pillar mine presented a unique opportunity to compile a new pillar database. Currently, the South African hard rock bord-and-pillar mines are designed using the Hedley and Grant formula with a modified K-value. This empirically derived formula was developed for uranium mines in the Elliot Lake district of Canada. The use of this formula for the design of pillars in South Africa is questionable. Very few pillar failures have nevertheless been observed and its current calibrations for the various reef types are possibly too conservative. A new UG2 pillar database of 66 pillars, of which seven are classified as failed, was compiled by the authors. This enabled a revised 'first-order' calibration of the K-value for the Hedley and Grant formula. The new estimated value for the UG2 is K = 75 MPa. This gives a pillar strength that is more conservative than the PlatMine formula. This work should nevertheless be considered as only a preliminary calibration as the database was small. Further work is also required to determine whether the exponents in the formula for the width and height parameters are appropriate for UG2 pillars.
Keywords: pillar strength, UG2, K-value, Hedley and Grant formula.
Introduction
Empirically derived pillar strength formulae are commonly used in the global coal and hard rock mining industries. The hallmark coal pillar strength formula proposed by Salamon and Munro (1967) has been used in the design of many South African collieries. The success of this empirically derived formula can be attributed to the size of the original database used, and the fact that all the pillars included are from South African mines. The database included 125 pillar cases of which 27 were failed. The updated South African coal pillar database, used by van der Merwe and Mathey (2013) included 86 failed pillar cases and 337 intact pillar cases. As a more recent development, van der Merwe (2019) noted a major shortcoming of the statistical back-analysis of coal pillar strength as it relies on the 'as-mined' pillar dimensions and ignores time-related pillar scaling with subsequent reduction in pillar width. By considering this, an equation for pillar strength which predicts significantly greater pillar strength than the previous statistical analyses was derived. Van der Merwe's paper gives valuable databases of failed and intact cases. An important aspect related to coal is that the pillar shapes and layouts of the bord-and-pillar mines in South Africa do not differ greatly, and this facilitates the development of empirically-derived pillar strength formulae.
In contrast, the Hedley and Grant (1972) pillar strength formula, which is still being used for the design of pillars in the hard rock mining industry of South Africa, was derived based on a data-set of only 28 pillars. This included only three crushed pillars and two partially crushed pillars. The source of this database was quartzite pillars in the Elliot Lake district of Canada and it did not include any South African pillars. The use of this formula in the South African mining industry is therefore questionable (Malan and Napier, 2011). It should be noted that both the Hedley and Grant and Salamon equations assume a power law strength formulation; the motivation for this is given below.
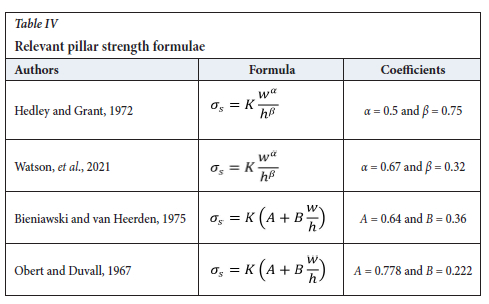
Following the work by Hedley and Grant (1972), there have been several other attempts to develop hard rock pillar strength formulae. These are given by Martin and Maybee (2000) and are listed in Table I. These formulae were developed based on observed pillar failures. Note the small number of pillars in most of the databases used. It is clear that the formulae take the form of either a power- or linear-type equation. These equations have been used to predict the pillar strength for a wide range of pillar shapes and rock mass strengths.
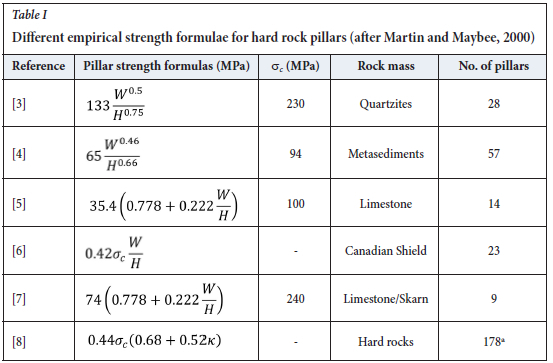
[3] Hedley and Grant (1972)
[4] Von Kimmelmann (1984)
[5] Krauland and Soder (1987)
[6] Potvin, Hudyama, and Miller (1989)
[7] Sjöberg (1992)
[8] Lunder and Pakalnis (1997.
Some discussion on the original adoption of the power-law formula for the coal mining industry is insightful. The general form of the equation is given as
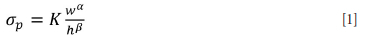
where σp (MPa) is the pillar strength, K (MPa) is the strength of a unit volume of coal, w is the width of the pillar, h is the mining height, and α and β are exponents. The selection of a power-law equation was motivated by Salamon and Munro (1967) as follows:
'The strength of a pillar depends on the strength of the material of which it is composed, its volume and its shape. Presumably, the effect of shape is due to the constraint imposed on the pillar by the roof and floor through friction or cohesion. The volume and shape of square pillars are completely defined by their width (w) and height (h). The most commonly-occurring pillar strength formula in the literature is a simple power function composed of these variables!
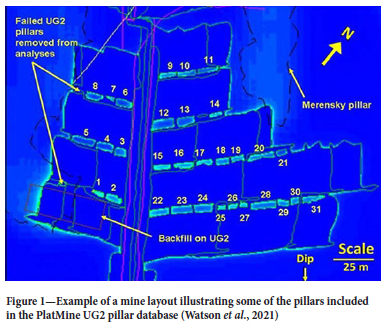
The emphasis on square pillars in the quote above is evident and its application to irregular-shaped pillars is uncertain. Work was conducted in the PlatMine research programme to develop local pillar strength formulae for the platinum industry. Watson et al. (2008) compiled a database of 179 Merensky Reef pillars, of which 109 were stable. In 2020, Watson et al. (2021) developed a new UG2 pillar strength formula for the platinum industry based on a larger data-set of 167 UG2 pillars. The conventional crush pillar layouts of the mines (Figure 1), from which these data-sets were compiled, differ from the shallow bord-and-pillar mines in the Bushveld Complex. Most of the pillar width:height ratios in the PlatMine database ranged between 1.5 and 4, and the heights were in the limited range of 1.5 m to 2 m. It should also be noted that the crush pillars in the conventional layouts are typically irregular in size, and this may cause difficulties when calibrating a strength formula for an assumed square pillar.
An experimental pillar extraction project at a mine in the eastern Bushveld Complex offered a unique opportunity to the authors to compile a new database of UG2 pillars in a mechanized bord-and-pillar mine. This database enabled an improved calibration of the Hedley and Grant formula. This can be used in areas of similar geotechnical conditions and layouts to optimize pillar design. As a cautionary note, however, this new calibration should be carefully tested in trial sections with suitable instrumentation and monitoring before it is adopted. The database is limited in size, and it should be expanded in future to verify its applicability.
Observations of pillar condition in an experimental pillar mining area
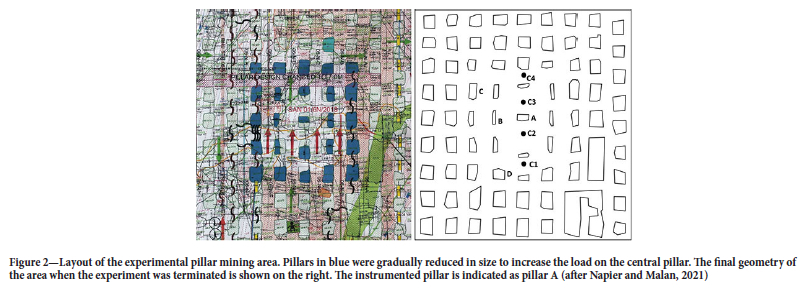
The experimental pillar mining area is illustrated in Figure 2. The site is described in Watson et al. (2021). The mine established this experimental section in an attempt determine the strength of UG2 chromitite pillars. A central pillar (pillar A in Figure 2) was instrumented, and the surrounding pillars were progressively mined until failure of the central pillar occurred. The central pillar showed signs of limited scaling, while the small neighbouring pillars were severely fractured. A peak average pillar stress (APS) value of 160 MPa acting on the pillar was inferred (although it should be noted that the stress measurements were done in the hangingwall above the central pillar and not directly in the pillar). Further details on the measurements recorded are described in Watson et al. (2021). As can be seen in Figure 2, the experiment resulted in pillars of different sizes and the observations indicated these are at varying degrees of stability. This is particularly valuable to estimate pillar strength as it is in the same area and therefore in the same geotechnical area.
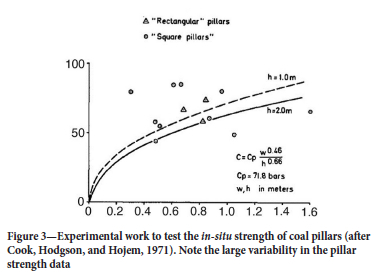
Napier and Malan (2021) simulated this area using a displacement discontinuity code and a limit equilibrium failure model. They found it difficult to reconcile the simulated APS of the central pillar with the peak APS value presented in Watson et al. (2021). Napier and Malan (2021) simulated a peak APS in the order of 40-50 MPa for simulations where the central pillar failed, and 60-70 MPa for simulations where the pillar was still intact. The reason for the large discrepancy between the measured peak APS and the simulated APS is not known. An aspect that should be considered with these experiments is that strength variability will be encountered when conducting underground pillar strength experiments. As an example, Figure 3 illustrates the data collected by Cook, Hodgson, and Hojem (1971) in an attempt to verify the Salamon power-law strength formula. These were actual underground strength tests of large coal pillars loaded to failure. The significant scatter of the data is striking. It is reasonable to assume that a similar variability will be found for the in-situ testing of hard rock pillars. This is concerning, as a single underground hard rock pillar reduction test may therefore not be enough to verify the applicability of any formula. This emphasizes the need of building large site-specific pillar databases to obtain improved estimates of pillar strength.
Data collection
Site observations
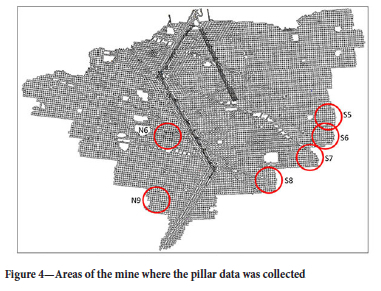
In June 2021 a number of underground visits were conducted to assess the pillar conditions at the mine. A total of 66 pillars in six different areas (Figure 4) were selected for detailed observations and for populating the database. The pillars selected for the database typically fell into the following categories:
> Pillars with dimensions smaller than the design specifications
> Pillars in the experimental project area
> Pillars with 'anomalous' behaviour
> 'Normal' pillars at different depths.
Only limited observations were recorded in the old areas of the mine owing to the following reason. Pillars with 'anomalous' behaviour or with dimensions smaller than the design specifications are rehabilitated by the mine using shotcrete and a double row of resin bolts spaced 1 m χ 1 m. Apart from examining the integrity of the shotcrete lining, visual observations of these pillars were not useful for making meaningful statements about pillar stability.
The following information was collected for each pillar:
> Dimensions of the pillar
> Photographs of each side of the pillar
> Comments on geological structures in or nearby the pillar
> The pillar classification based on Figure 5.
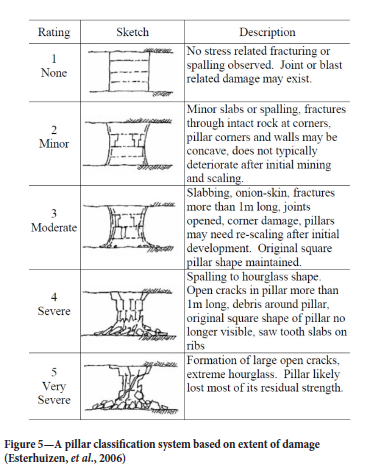
The pillar classification proposed by Esterhuizen et al. (2006) was used to categorize the pillars (Figure 5). They based this classification on the systems developed by Lane, Yanske, and Roberts (1999), Siefert et al. (2003), Krauland and Soder (1987), Lunder (1994), and Pritchard and Hedley (1993). The similarity of the classification system, for the different databases in literature, enables their use in a larger, consolidated database.
Esterhuizen et al. (2006) noted that pillars with a classification of 3 and below are typically made safe with regular scaling procedures and may require occasional rib bolting or screen. Pillars classified as 4 and above are generally barricaded off and require extensive support systems to preserve the integrity of the pillars. Regarding the current study, the classification was modified and pillars 1-2 were defined as stable, 3 as unstable, and 4-5 as failed. This slight modification was used as it was considered a more appropriate ranking of pillar behaviour at the UG2 mine. Pillars classified as failed were deemed to no longer function as stable pillars with an intact core which can carry the required tributary area load. Pillars in the unstable and stable categories used in this study were considered functional pillars that still carry their full load. It should be noted that this is a subjective measure based on the extent of fracturing and visual condition recorded for a pillar. This is a potential flaw in all studies, including the previous PlatMine study, that attempt to classify pillars based on visual observations alone. Measurement techniques to objectively determine if the core of the pillar is still intact, and the magnitude of the load carried, are unfortunately too expensive and time-consuming.
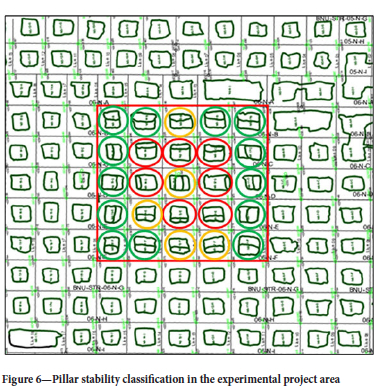
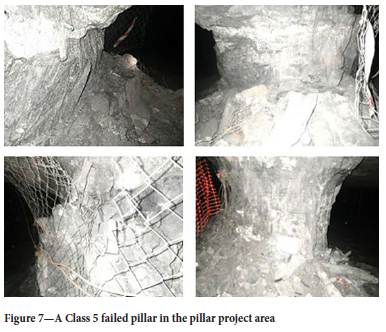
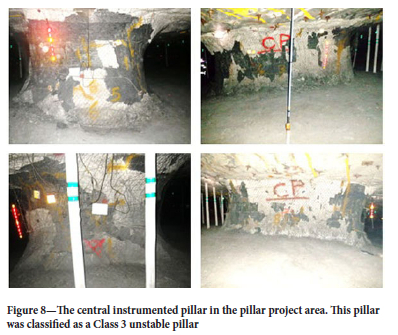
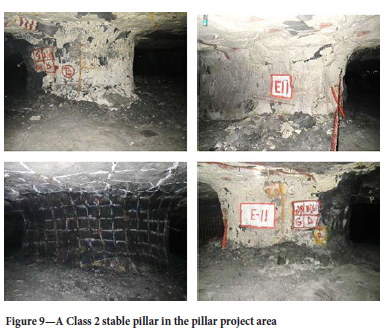
The experimental pillar project area was the only area in the mine where pillars in each of the categories could be found. It should be noted that all the failed and unstable pillars in the database are from the 25 pillars in the experimental pillar project area. A total of 7 of the 25 pillars in the area were classified as failed and are circled in red in Figure 6. An example of a Class 5 failed pillar is shown in Figure 7. A total of 5 of the 25 pillars were classified as unstable and are circled in yellow in Figure 6. Based on the classification system, the centre pillar (Figure 8) was classified as a Class 3 unstable pillar. The remaining pillars in the experimental project area were classified as Class 1-2 stable pillars and are circled in green in Figure 6. An example of a pillar in this class is shown in Figure 9.
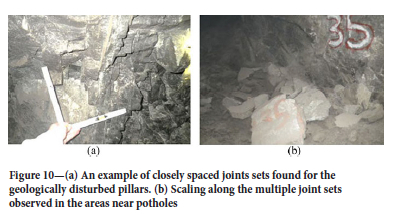
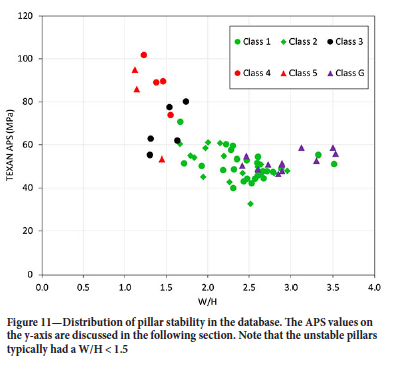
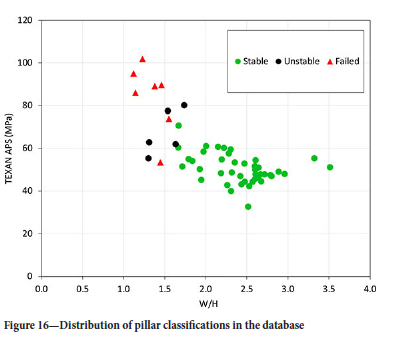
The other pillars in the database are classified as either stable or 'geologically disturbed' (Class G) pillars. Class G pillars were recorded as a separate class as the failure of these pillars is driven by multiple joint sets (Figure 10a) and proximity to reef rolls and potholes. Figure 10b shows the type of scaling observed for these pillars. Figure 11 summarizes the different pillar classifications in the database for various width to height ratios (W/H) and the simulated APS values (described in the following section).
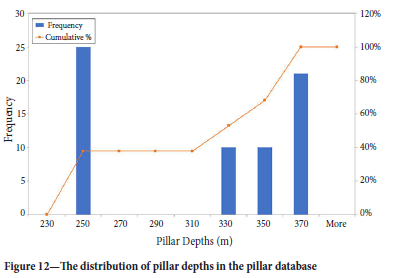
The surface topography around the mine is mountainous, making it difficult to determine the precise mining depth for the different areas. The overburden was nevertheless assumed to be flat above each of the modelled sections to simplify the modelling. The depths of the pillars in this database were calculated by determining the centre of mass of the overburden above the modelled areas. Deswick mine planning software was used to calculate the centre of mass using the surface contour mapping and excavation layers (Deswick, 2021). The depth distribution of the pillars in the database is shown in Figure 12.
The effective widths for the pillars were calculated using the 'perimeter rule' method proposed by Wagner (1974). Malan and Napier (2011) highlight the problems associated with the use of this method. The perimeter rule is nevertheless widely adopted in the industry. Further work is currently under way to determine the applicability of the rule (Maritz and Malan, 2023). The pillar database described in this paper should be re-examined in future if improved methods are developed to cater for pillars that are not square.
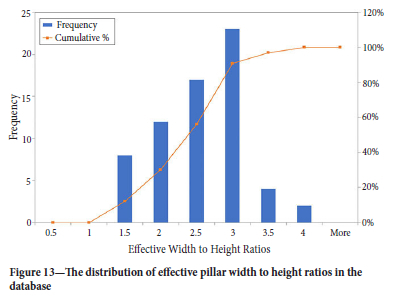
The distribution of the effective width to height ratios of the pillars is shown in Figure 13. It is noteworthy that all pillars in the database with an effective width to height ratio smaller than approximately 1.5 were classified as either failed or unstable.
Numerical simulations to estimate pillar stress
A database of pillar behaviour is of value only if the stress acting on each pillar can be estimated. For the earlier studies on pillar strength, such as Salamon and Munro (1967) and Hedley and Grant (1972), the pillar stress was estimated using tributary area theory (TAT). TAT is a conservative approach as it assumes a regular layout, with all pillars of equal size, with the layout continuing to infinity in all directions. The effect of large pillars and abutments are not considered (see Napier and Malan, 2011). A more accurate approach was used for this study by simulating the average pillar stress (APS) using numerical modelling techniques.
The TEXAN code used in this study is a displacement discontinuity boundary element code that was specifically developed to simulate bord-and-pillar layouts. It incorporates the use of triangular boundary elements to enable an accurate representation of irregular-shaped pillars and layouts (Napier and Malan, 2007; Esterhuyse and Malan, 2018). The code can explicitly simulate small pillars and the crushing of the pillars using a limit equilibrium model. The use of TEXAN to simulate small crush pillars is described in du Plessis and Malan (2018). Owing the restrictions on the number of elements that can be practically solved in TEXAN (270 000 elements in the version used by the authors), smaller areas were simulated in detail for this study and not the entire mine. To simplify the digitizing of the outlines and the meshing procedure, the pillar outlines were approximated by using straight line segments.
The mined areas were covered using a triangular mesh. In terms of element sizes, the centroids of adjacent triangular elements are spaced approximately 1 m apart, but this varied from area to area. Where necessary, elements were modelled with the centroids spaced approximately 0.5 m apart to accurately simulate the APS values of the smaller pillars. This spacing is referred to as the 'element size' in this paper, but this is not strictly correct as the meshes consisted of triangular elements. The pillars of interest also had to be meshed for the APS calculations. In displacement discontinuity codes, any area not covered by elements is considered as solid material and therefore not all the pillars had to be meshed to get an accurate solution. Also note that element size can affect the simulated pillar APS values -this is described in Napier and Malan (2011).
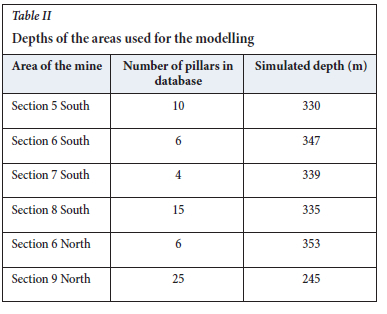
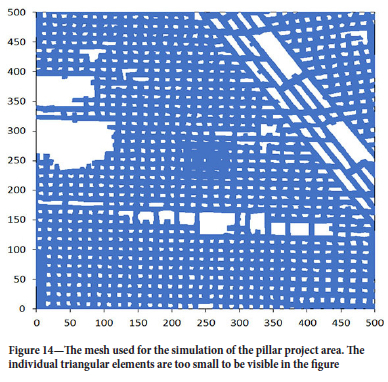
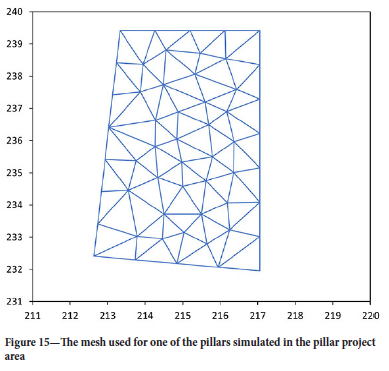
The six areas of the mine visited (Figure 3) were simulated using TEXAN. The depths of the different areas are given in Table II. The overburden density was assumed to be 3100 kg/m3. This requires further verification. The other model parameters were Young's modulus = 70 000 GPa, Possion's ratio = 0.2. The elastic parameters were only estimated values for the particular rock mass, but are nevertheless considered acceptable. Young's modulus does not affect pillar APS values unless total closure occurs. The pillars were simulated as 'rigid' pillars that were not allowed to deform. Figure 14 illustrates the mesh used to simulate one of the areas, namely the experimental pillar project area. Approximately 230 000 elements were used to simulate the 500 m x 500 m layout. The APS values for all the pillars in the database were calculated using these simulations. Figure 15 illustrates the mesh used for one particular pillar within this model to illustrate the element size.
Rock strength
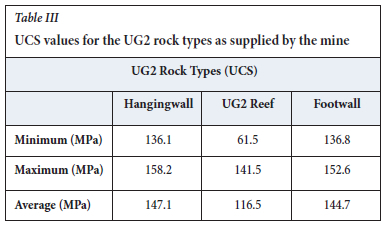
A geotechnical testing programme on the rock types in the stratigraphy of the UG2 reef was conducted by the mine. The information presented to the authors by the mine was the uniaxial compressive strength (UCS) of the pillar material given in Table III. Note that this is limited data and no additional information, such as number of tests, was available. The UCS of the chromitite reef varies significantly from 61.2 MPa to 141.5 MPa. The average UCS value for the reef was used when estimating the K-values for the older formulae in Table IV. Owing to the composite nature of the pillar material, this UCS gives only a crude estimation of the strength of the 'bulk' pillar material. Without large-scale in-situ tests similar to the experiments conducted by Bieniawski and van Heerden (1975), it is difficult to determine the actual strength of the rock mass material in the pillars. The seemingly large variation in UCS values may make it difficult to calibrate pillar strength formulae. The possible variation in pillar strength in different areas of a mine has been largely ignored to date. This needs to be studied in future, and it is also recommended that additional laboratory testing be done on the UG2 material.
Pillar strength estimation
The Class G pillars were not included in the studies to estimate the pillar strength. The pillar data-set was also simplified by adopting the three categories shown in Figure 16. An analysis of the data using statistical methods was attempted, but this was not successful. The maximum likelihood estimation (MLE) used by Salamon and Munro (1967) and the overlap reduction technique used by van der Merwe (2003) were not suitable for this study owing to the limited size of the database. Pillar failure also occurred in one area only where the mining height was constant. Furthermore, without variability in the height for the failed pillars, there is no accurate statistical method to determine the appropriate exponent for the height parameter.
The pillar data-set was initially evaluated using the common hard-rock pillar strength formulae (Table IV). Figure 17 illustrates the formulae with adjusted K-values by using the new pillar database. Ideally, pillars in an unstable condition should be close to the failure envelopes with the red (failed) pillars above the line and green (stable) pillars below it. It is clear from the figure that the original Hedley and Grant calibration with K = 35 MPa is too conservative for this particular mine. Notably the Hedley and Grant (1972), Bieniawski and van Heerden (1975), and Obert and Duval (1967) formulae with an adjusted K = 65 MPa provide a good approximation of the pillar strength. This K-value was an arbitrary value of approximately two-thirds of the UCS of the pillar material.
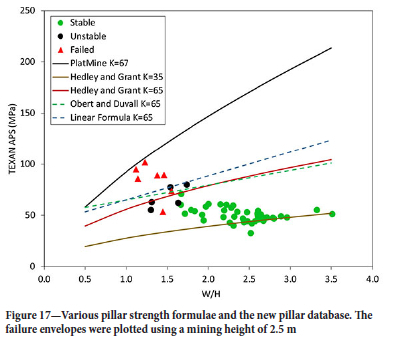
A preliminary calibration of the Hedley and Grant (1972) formula was done by the authors by adjusting the K-value to obtain a reasonable fit to the data. The Hedley and Grant (1972) formula is well established in the design of hard rock pillars in South Africa and, as no suitable alternative was available to the authors, this formula was recalibrated using this new data-set. Future work will need to be conducted to verify the applicability of the exponents for the width and height parameters in this formula.
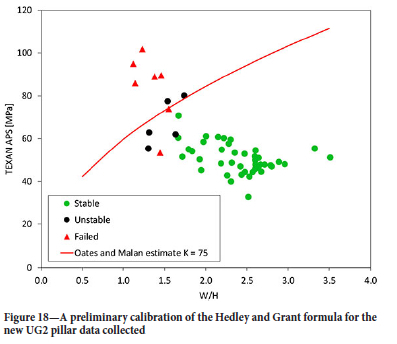
The estimated value of K was 75 MPa. The fitted curve is illustrated in Figure 18. This calibration seems to give a reasonable failure envelope to separate the failed and stable pillars with all the intact pillars below the envelope. Note that this line is only a first trial-and-error estimate done by hand. Additional data will be required to verify the most appropriate failure envelope as there is one failed pillar data-point far below the line. This may be an outlier, but further work needs to be done to refine this calibration with a larger database. Of particular significance, however, is that this calibration is substantially more conservative than the PlatMine formula and all the failed pillars are below the PlatMine strength envelope. This is one of the important findings of this study.
Conclusions
The compilation of a new UG2 pillar database for a bord-and-pillar mine in the eastern Bushveld Complex will assist with the development of locally derived and calibrated pillar strength formulae. This study illustrated that care should be exercised when using the traditional statistical methods employed to evaluate pillar databases. Owing to the limited variability in mining height in the database, it is difficult to determine the effect of pillar height on the strength of the pillar and to calibrate the exponent of the height parameter in a power-law strength equation.
Analysis of the database indicates that the Hedley and Grant formula with a Κ-value of 35 MPa is too conservative for this particular mine. The 'first-order' calibration indicates that a value of Κ = 75 MPa may be more appropriate. Additional data will nevertheless be required to verify this value. Further work is also required to determine if the Hedley and Grant formula provides an accurate reflection of the changes in pillar strength for pillars at different widths and heights. Of interest is that this calibration is substantially more conservative than the PlatMine formula, and all the failed pillars in the new database are below the PlatMine strength envelope. As further cautionary note, this new calibration should be tested in trial sections with suitable instrumentation and monitoring before it is adopted at any mine.
Acknowledgements
This work forms part of the MEng study of Thomas Oates at the University of Pretoria. The authors would like to thank Northam Platinum for permission to publish this data.
References
Bieniawski, Z. 1992. A method revisited: coal pillar strength formula based on field investigations. IC 9315. US Bureau of Mines. [ Links ]
Bieniawski, Z. and van Heerden, W. 1975. The significance of in situ tests on large rock specimens. International Journal of Rock Mechanics and Mining Sciences and Geomechanics Abstracts, vol. 12, no. 4. pp. 101-113. [ Links ]
Cook, N.G.W., Hodgson, K., and Hojem, J.P.M. 1971. A 100-MN jacking system for testing coal pillars underground. Journal of the South African Institute of Mining and Metallurgy, vol. 7i. pp. 215-224. [ Links ]
Deswik. 2021. Deswik.CAD. https://www.deswik.com/product-detail/deswik-cad/ [ Links ]
Esterhuizen, G., Iannacchione, A., Ellenberger, J., and Dölinar, D. 2006. Pillar stability issues based on a survey of pillar performance in underground limestone mines. Proceedings of the 25th International Conference on Ground Control in Mining, Morgantown, WV pp. 354-361. https://www.cdc.gov/niosh/mining%5C/UserFiles/works/pdfs/psibo.pdf [ Links ]
Esterhuyse, J. and Malan, D. 2018. Some rock engineering aspects of multi-reef pillar extraction on the Ventersdorp Contact Reef. Journal of the Southern African Institute of Mining and Metallurgy, vol. 118. pp. 1285-1296. [ Links ]
Hedley, D. and Grant, F. 1972. Stope-and-pillar design for Elliot Lake Uranium Mines. CIM Bulletin. pp. 37-44. [ Links ]
Hustrulid, W. 1976. A review of coal pillar strength formulas. Rock Mechanics, vol. 8. pp. 115-145. [ Links ]
Krauland, N. and Soder, P. 1987. Determining pillar strength from pillar failure observations. Engineering and Mining Journal, vol. 8. pp. 34-40. [ Links ]
Lane, W. Yanske, T., and Roberts, D. 1999. Pillar extraction and rock mechanics at the Doe Run Company in Missouri 1991 to 1999. Proceedings of the 37th U.S. Symposium on Rock Mechanics (USRMS), Vail, CO, June 1999. American Rock Mechanics Association, Alexandria, VA. pp. 285-292. [ Links ]
Lunder, P. J. 1994. Hard rock pillar strength estimation an applied approach. MSc thesis, University of British Columbia. [ Links ]
Lunder, P. J. and Pakalnis, R. 1997. Determination of the strength of hard-rock mine pillars. Bulletin of the Canadian Institute of Mining and Metallurgy, vol. 90. pp. 51-55. [ Links ]
Malan, D.F. and Napier, J.A.L. 2011. The design of stable pillars in the Bushveld Complex mines: A problem solved? Journal of the Southern African Institute of Mining and Metallurgy, vol. 111. pp. 821-836. [ Links ]
Malan, D. and Napier, J. 2021. A review of the role of underground measurements in the historic development of rock engineering in South Africa. Journal of the Southern African Institute of Mining and Metallurgy, vol. 121. pp. 201-216. [ Links ]
Maritz, J. and Malan, D.F. 2023. A review of the effect of pillar shape on pillar strength. Journal of the Southern African Institute of Mining and Metallurgy [in press]. [ Links ]
Martin, C.D. and Maybee, W.G. 2000. The strength of hard rock pillars. International Journal of Rock Mechanics and Mining Sciences, vol. 37. pp. 1239-1246. [ Links ]
Napier, J.A.L. and Malan, D.F. 2007. The computational analysis of shallow depth tabular mining problems. Journal of the Southern African Institute of Mining and Metallurgy, vol. 107. pp. 725-742. [ Links ]
Napier, J.A.L. and Malan, D.F. 2011. Numerical computation of average pillar stress and implications for pillar design. Journal of the Southern African Institute of Mining and Metallurgy, vol. 111. pp. 837-846. [ Links ]
Napier, J.A.L. and Malan, D.F. 2021. A limit equilibrium model of tabular mine pillar failure. Rock Mechanics and Rock Engineering, vol. 54. pp. 71-89. [ Links ]
Obert, L. and Duvall, W. 1967. Rock Mechanics and the Design of Structures in Rock. Wiley. [ Links ]
Potvin, Y., Hudyma, M.R., and Miller, H.D.S. 1989. Design guidelines for open stope support. CIM Bulletin, vol. 82. pp. 53-62. [ Links ]
Pritchard, C. and Hedley, D. 1993. Progressive pillar failure and rock bursting at Denison Mine. Ontario. Rockbursts and Seismicity in Mines: Proceedings of the 3rd International Symposium, Kingston, Ontario, 16-18 August 1993. Young, R.P. (ed.). Balkema, Rotterdam. [ Links ]
Ryder, J.A. and Jager, A.J. 2002. A Textbook on Rock Mechanics for Tabular Hard Rock Mines. Safety in Mines Research Advisory Committee, Johannesburg. [ Links ]
Ryder, J.A., Watson, B.P., and Kataka, M. 2005. PlatMine 1.2: Estimation of UG2 and Merensky Reef pillar strengths through back-analyses. Platmine, Johannesburg. [ Links ]
Salamon, M. and Munro, A. 1967. A study of the strength of coal pillars. Journal of the South African Institute of Mining and Metallurgy, vol. 67. pp. 56-67. [ Links ]
Siefert, M., Mali, H., Wagner , H. ,and Frommer, T. 2003. Geotechnical risk assessment of an underground magnesite mine. Proceedings of ISRM 2003 -Technology Roadmap for Rock Mechanics. South African Institute of Mining and Metallurgy, Johannesburg. pp. 1073-1076. https://pureadmin.unileoben.ac.at/ws/portalfiles/portal/13137316/isrm_10congress_2003_185.pdf [ Links ]
Sjoberg, J. 1992. Failure modes and pillar behaviour in the Zinkgruvan mine. Proceedings of 33rd U.S. Rock Mechanics Symposium, Santa Fe. Tillerson, J.A. and Wawersik W.R. (eds). Balkema, Rotterdam. pp. 491-500. [ Links ]
Van der Merwe, J.N. 2003. New pillar strength formula for South African coal. Journal of the South African Institute of Mining and Metallurgy, vol. 103. pp. 281-292. [ Links ]
Van der Merwe, J.N. 2019. Coal pillar strength analysis based on size at the time of failure. Journal of the Southern African Institute of Mining and Metallurgy, vol. 119. pp. 681-692. [ Links ]
Van der Merwe, J.N. and Mathey, M. 2013. Update of coal pillar strength formulae for South African coal using two methods of analysis. Journal of the Southern African Institute of Mining and Metallurgy, vol. 113. pp. 841-847. [ Links ]
Von Kimmelmann, M.R., Hyde, B., and Madgwick, R.J. 1984. The use of computer applications at BCL Limited in planning pillar extraction and design of mining layouts. Proceedings of the ISRM Symposium: Design and Performance of Underground Excavations. Brown, E.T. and Hudson J,A, (eds). British Geotechnical Society, London. pp. 53-63. [ Links ]
Wagner, H. 1974. Determination of the complete load-deformation characteristics of coal pillars. Advances in Rock Mechanics. Proceedings of the Third Congress of the International Society for Rock Mechanics, Denver, CO. Vol, II, part B.National Academy of Science, Washington. pp. 1076-1081. [ Links ]
Watson, B., Ryder, J.A., Kataka, M.O., Kuijpers, J.S., and Leteane, F.P. 2008. Merensky pillar strength formulae based on back-analysis of pillar failures at Impala Platinum. Journal of the Southern African Institute of Mining and Metallurgy, vol. 108. pp. 449-456. [ Links ]
Watson, B., Lamos, R., and Roberts, D. 2021. PlatMine pillar strength formula for UG2 Reef. Journal of the Southern African Institute of Mining and Metallurgy, vol. 121. pp. 437-448. [ Links ]
Watson, B.P., Theron, W., Fernandes, N., Kekana, W.O., Mahlangu, M.P., Betz, G., and Carpede, A. 2021. UG2 pillar strength: Verification of the PlatMine formula. Journal of the Southern African Institute of Mining and Metallurgy, vol. 121. pp. 449-456. [ Links ]
York, G. and Canbulat, I. 1998. The scale effect, critical rock mass strength and pillar system design. Journal of the South African Institute of Mining and Metallurgy, vol. 98. pp. 23-37. [ Links ]
 Correspondence:
D.F. Malan
Email: francois.malan@up.ac.za
Received: 3 Mar. 2023
Revised: 21 Apr. 2023
Accepted: 20 May 2023
Published: May 2023

