


Services on Demand
Article
 English (pdf)
 Article in xml format
 Article references
Indicators

Related links
-
 Cited by Google
 -
 Similars in Google
Share

 Permalink
Journal of the Southern African Institute of Mining and Metallurgy
On-line version ISSN 2411-9717
Print version ISSN 2225-6253
J. S. Afr. Inst. Min. Metall. vol.123 n.5 Johannesburg May. 2023
http://dx.doi.org/10.17159/2411-9717/2451/2023
PILLAR DESIGN EDITION
Numerical simulation of large-scale pillar-layouts
J.A.L. Napier; D.F. Malan
Department of Mining Engineering, University of Pretoria, South Africa
SYNOPSIS
A number of shallow coal or hard rock mines employ pillar mining systems as a strategy for roof failure control. In certain platinum mine layouts, pillars are designed to 'crush' in a stable manner as they become loaded in the panel back area. The correct sizing of pillars demands some knowledge of the pillar strength and the overall layout stress distribution. It is particularly important to understand the impact of the layout geometry on the effective regional 'stiffness' of the rock mass around each pillar. An important design strategy is to model relatively detailed layout configurations which include a precise representation of the local pillar layout geometry and to analyse multiple mining scenarios and extraction sequences to select optimal pillar sizes and barrier pillar spacing. Although computational solution techniques are now impressive in terms of run time efficiency, a major difficulty is often encountered in assigning suitable material properties to the pillars and in devising an effective material description of the layered rock strata overlying the mine excavations. This paper outlines an efficient numerical strategy that can be used to assess large-scale pillar layout performance while retaining the ability to modify individual pillar constitutive behaviour. The proposed method is applied to selected layouts to compare estimated average pillar stress values against values determined by detailed modelling and against observed behaviour.
Keywords: pillar layout, numerical simulation, pillar stress, extraction ratio.
Introduction
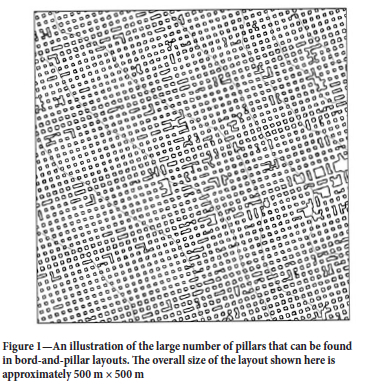
The displacement discontinuity boundary integral equation method has been applied successfully to the solution of tabular mine layout problems in South Africa for many decades (e.g. Plewman, Deist, and Ortlepp, 1969; Deist, Georgiadis, and Moris, 1972; Ryder and Napier, 1985). A particular class of applications relates to the solution of pillar layout problems which exhibit a number of multi-scale numerical features (Malan and Napier, 2006; Napier and Malan, 2021; Couto and Malan, 2022). Extensive mining operations can comprise thousands of individual pillars (Figure 1). The layout design demands an understanding of both the individual pillar deformations and failure mechanisms as well as assessment of the overall layout stability properties. which must be recognized to prevent large-scale pillar collapses. Individual pillar strength and failure response can be estimated using local fine-scale models of a single pillar employing either detailed displacement discontinuity simulations in which the pillar height effects are modelled indirectly, or finite element or finite difference models of the pillar height and a selected portion of the hangingwall and footwall in a limited volumetric region surrounding an individual pillar, (Esterhuizen, 2014; Li et al., 2021). In the latter case the main difficulty is that some explicit assumptions have to be made about the loading conditions on the selected volume-bounding surfaces. A crucial analysis step is then required to infer how the individual detailed response is incorporated into the overall layout configuration which addresses regional issues such as the positioning of barrier pillars and, in certain cases, multiple seam extraction sequences.
The main advantage of the boundary element approach as opposed to finite element or finite difference analysis is the reduction of the numerical analysis space from three to two dimensions. However, even with this significant advantage it can be an arduous task to set up models of large-scale pillar layout problems comprising several thousand pillars and simultaneously requiring a sensitive response to individual pillar failure characteristics. For example, if a layout comprises 5000 pillars and if the allocated tributary unit cell area surrounding each pillar is tessellated using 20 χ 20 = 400 elements, then the overall layout area is covered by two million elements. The use of finer grid sizes becomes progressively more prohibitive in total computational effort. In this paper we address this problem by proposing a numerical strategy to represent each pillar 'cell' as a single composite element equipped with an appropriate 'effective stiffness' constitutive description. The composite element construction can allow the extraction ratio to be specified individually in each cell region, together with a specified pillar strength and residual strength which controls the pillar failure state. This approach yields a significant reduction in the problem specification detail by allowing the overall layout performance to be analysed in terms of the average load carried by each pillar and providing an indication of the overall pillar collapse potential. The detailed stress distribution and failure regions within individual pillars can be assessed by embedding submodels of selected local layout regions in a multi-scale simulation approach if required. This extension is not discussed in the present work.
Effective pillar stiffness model
A large-scale pillar layout will generally assume a nominally regular rectangular mesh pattern, which may include the periodic use of barrier pillars to limit the potential for extensive pillar collapses. In this paper we assume that each pillar is located within a unit cell which includes both the intact pillar and an allocated surrounding mined area. The proposed numerical scheme seeks to approximate the response of the unit cell to reflect the average seam closure and the average load carried by the pillar. The layout is assumed to fall in an approximately horizontal x-y coordinate plane with the z-axis normal to the plane. The stope closure is represented by the z-component of the displacement discontinuity vector. Ride components are not considered in the present development. The average stress component Tzc in each unit cell is determined implicitly by the following relationship:
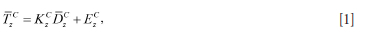
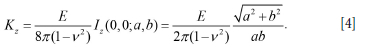
where Dzc is the average closure in the cell and ΚzC is the cell element self-effect stiffness modulus. Ec2 represents the sum of the average field stress at the centre of the unit cell and all external' stress values that are induced by the remaining layout cells and by other displacement discontinuity elements. The superscript C is used to distinguish quantities that are properties of each pillar cell region. The influence functions that are used to calculate the induced stress values have been described in detail by Napier and Malan (2007). For the special case of a rectangular displacement discontinuity element centred at the origin and having edge lengths 2a and 2b in the x and y directions respectively, it can be shown that the induced seam-normal traction component at a point R(x, y) in the plane is given by
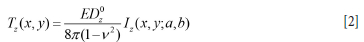
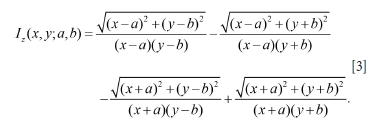
where Ε is the rock mass Young's modulus, ν is the Poisson's ratio, and Dz0 is the assumed constant closure value. The influence function Iz (x, y, a, b)is defined by
The self-effect stiffness modulus of the element is given by
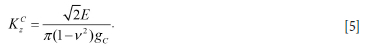
In the special case where the unit cell is a square with side length gc = 2a = 2b this expression becomes
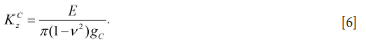
The case of a plane strain geometry can be represented by taking the limit b->°° in Equation [4] and setting gc = 2a. In this case Equation [4] assumes the form
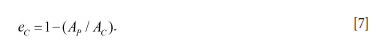
Let the unit cell area be Ac and assume that the intact pillar area within the cell is Ap. The unit cell extraction ratio ec is therefore given by
For the case of a plane strain geometry of parallel-sided panels separated by intervening strip pillars, define the unit cell width to be gc and let the pillar width be W. In this case Ac = gc and Ap = W.
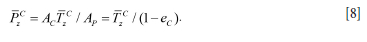
If a particular unit cell average stress is TZC, the average stress acting on the unmined pillar area within the cell must satisfy the stress balance relationship.
It is assumed further that the average unit cell stress Tzc is related to the average unit cell closure Dcz by a relationship of the form
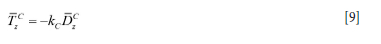
where kc is defined to be the 'effective stiffness modulus' of the unit cell. The minus sign in Equation [9] reflects the assumption that compressive stress values are deemed to be negative. Substituting Equation [9] into Equation [1] allows the average cell closure to be expressed as

The effective stiffness modulus kc depends on the extraction ratio and on the local geometry of the intact pillar within the unit cell. The value of kc can be determined analytically for the special case of a regular, infinite train of strip pillars but must in general be 'calibrated' using a numerical sub-model of the detailed layout of each pillar cell. Once the effective cell stiffness values are established the overall pillar layout can be solved by recursively solving Equation [10] at each defined pillar cell element. It should be noted that this approximate scheme allows each pillar cell to have a unique extraction ratio ec and can be combined with elements that represent additional mining regions or fault structures. The computational saving that can be achieved relies on the assumption that an effective stiffness modulus can be determined for a few characteristic types of cell geometry and is controlled mainly by the unit cell extraction ratio.
The case of a plane strain horizontal layout comprising an infinite sequence of pillars of width W with pillar centre spacing gc was solved by Salamon (1968). Using Salamon's solution it can be inferred (see Napier, 1991) that the average closure in each pillar cell is given by
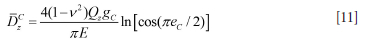
where Qz is the vertical field stress at the excavation horizon. (The field stress is negative for compressive stress values.) The average pillar cell stress in the case of an infinite sequence of similar pillars is equal to the vertical field stress and consequently ff = Qz. Employing Equations [9] and [11], the effective cell stiffness modulus is therefore deduced to be

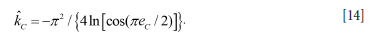
It is useful to scale the effective stiffness modulus by the unit cell self-effect modulus and to define the scaled effective stiffness modulus kc by

Hence, combining Equations [6] and [12],
Calibration of effective pillar stiffness
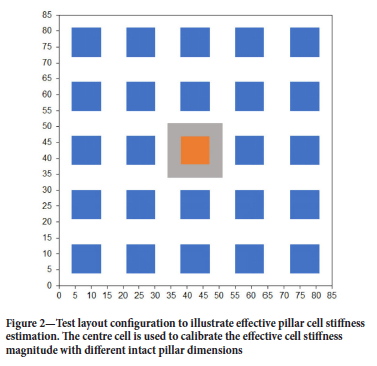
In order to demonstrate the proposed calibration procedure, consider the case of a 5 χ 5 pillar sub-layout in which each pillar cell has a side dimension of 17 m. The composite unit cell is illustrated for the central pillar and the associated mined region in Figure 2. The overall layout dimensions are 85.0 m χ 85.0 m and the layout is assumed to be tessellated by a fine grid of square displacement discontinuity elements with grid size 1/3 m. In this case, each unit cell in the layout shown in Figure 2 has 51 χ 51 square elements and the overall layout is covered by 65 025 square elements. This problem was analysed with five different intact pillar sizes having widths of 5, 7, 9, 11, and 13 m respectively. The corresponding cell extraction ratios and effective stiffness values are summarized in Table I. The assumed rock mass modulus was E = 7200 MPa and Poisson's ratio v = 0.2. The field stress Qz at the excavation horizon was assumed to be -9.0 MPa. It should be noted, however, that the calibration test run is not dependent on the explicit field stress value in the case where no failure of the intact pillar region occurs.
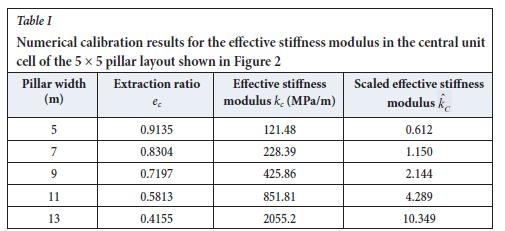
The unit cell self-effect stiffness modulus given by Equation [5] is equal to 198.6 MPa/m for the assumed elastic parameters. The last column in Table I expresses the scaled effective stiffness values that are calculated using Equation [13].
Figure 3 shows a plot of the scaled pillar cell stiffness values, kc = kc / kcz, as a function of the extraction ratio ec together with the corresponding values that arise for the regular strip pillar layout given by Equation [14]. It should be noted that kc = 0 in the limiting case ec -> 1 as no intact pillar is present in the fully mined unit cell. The planar layout values reported in Table I and depicted in Figure 3 can be seen to follow a remarkably similar trend to the plane strain results of Equation [14] but are lower than the plane strain case when the extraction ratio exceeds 0.5.
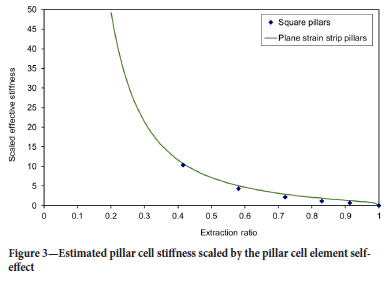
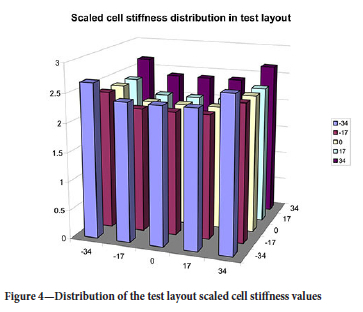
Figure 4 is a plot of the scaled effective stiffness modulus values that arise in each unit cell of the 5 χ 5 pillar calibration layout when the extraction ratio is equal to 0.7197 (pillar width = 9.0 m). This indicates that the edge unit cells are somewhat stiffer than the central cells, which have nearly uniform values. The differential stiffness arises from the fact that no mining is included outside the 5 χ 5 pillar cluster depicted in Figure 2. This suggests that the stiffness calibration should include a modest 'pad' region around a unit cell of specific interest.
It should be noted that the extraction ratio ec is used in Equation [8] to determine the pillar average stress PCz in the layout solution. If the average pillar stress exceeds a specified failure strength Smax, the pillar stress is assumed to fall to a specified residual stress level Sf. This assumption is conservative in the sense that no post-failure compression softening slope of the pillar is assumed in the current analysis. It is noted also that the post-failure pillar compression within the unit cell is ultimately limited by the failed pillar volume.
The maximum allowed closure of the failed unit cell is therefore bounded according to
where H is the pre-failure pillar height. If this closure restriction arises, the corresponding pillar cell stress is determined from Equation [1] in the iterative solution procedure with the imposed boundary condition DCZ = Dzmax. The overall iterative scheme includes a cell status flag indicating whether the pillar is 'intact' or 'failed'. The status flags are revised at the end of each mining step cycle depending on the transition from 'intact' to 'failed' status that is determined for each cell. Experience to date suggests that updating each cell status at the end of each mining step cycle generally precludes the possibility of encountering pathological cyclic oscillations between cell intact/failed states.
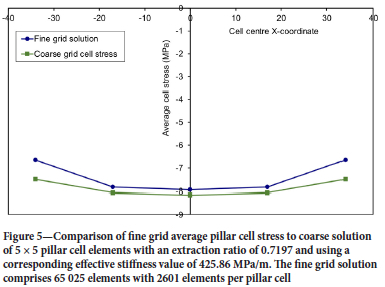
A final consistency test run of the 5 χ 5 pillar calibration layout was carried out using the coarse unit cell layout having only 5 χ 5 = 25 elements with element edge length 17.0 m and with each element assigned an effective stiffness value of 425.86 MPa/m corresponding to an extraction ratio of 0.7197 (see Table I). Figure 5 is a plot of the coarse cell layout average pillar stress values across the centreline y = 0, compared to the average values calculated in the fine scale layout simulation comprising 65 025 elements. The average pillar cell stress can be seen to compare favourably with the detailed layout results, indicating overall consistency of the results despite the massive reduction of the problem size to only 25 elements. In order to reduce grid size errors, it may be noted that the calibration could be carried out in two steps using element mesh grid sizes g1 and g2 = g1 /2 respectively and then using an extrapolative technique, such as outlined by Napier and Malan (2011) to estimate the asymptotic unit cell stiffness modulus values as g -> 0.
Large-scale layout simulations
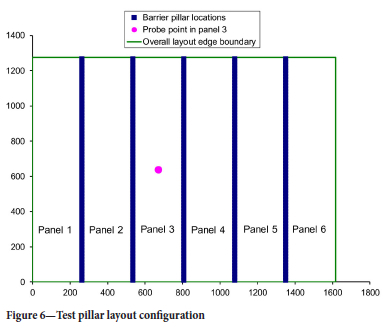
The use of the effective stiffness algorithm for a large-scale layout is illustrated by considering a hypothetical pillar layout comprising six mining panels separated by five barrier pillars as shown in Figure 6. The overall layout covers an area of 1615 m by 1275 m and comprises 95 χ 75 = 7125 pillar cells with a cell grid size of 17.0 m. The test layout comprises six pillar panels separated by five barrier pillars. In the illustrative cases presented here it is assumed that the extraction ratio of the panel pillars is 0.7197 with an effective stiffness of 425.86 MPa/m (see Table I). The barrier pillars are simulated as pillar cells with an extraction ratio of 0.4155 and an effective cell stiffness of 2055.2 MPa/m. This ad hoc choice for the barrier pillar description can, however,- be amended.
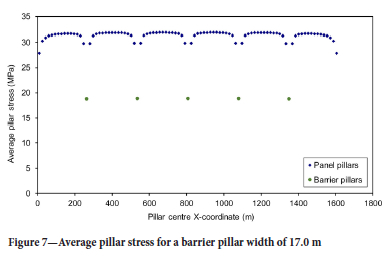
The initial effective width of the barrier pillar cell was set to one element (17.0 m) and the absolute field stress magnitude was assumed to be 9.0 MPa at the excavation horizon. The rock mass modulus and Poisson's ratio were chosen to be 7200 MPa and 0.2 respectively. Figure 7 illustrates the distribution of the calculated average absolute pillar stress values across the pillars centred on the layout centreline (y-coordinate = 637.5 m; see Figure 6). No failure is permitted to occur in this case and the peak panel pillar stress was approximately equal to 31.8 MPa. (The theoretical tributary area stress in this case is 32.11 MPa.)
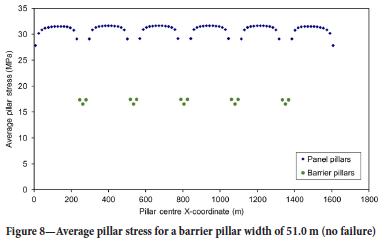
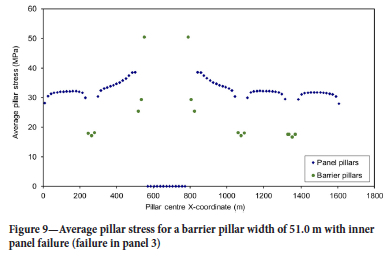
Assuming that the nominal pillar strength is 40.0 MPa, it was found that if the nominal barrier pillar width was equal to 17.0 m the entire layout would collapse if the centre element in panel 3 were to fail. Figure 8 shows the equivalent centreline plot to Figure 7 when the barrier pillar width was increased from 17.0 m to 51.0 m and when no pillar failure occurs. In this case the peak pillar stress decreases nominally to 31.68 MPa. Figure 9 shows the centreline pillar stress status if the centre pillar cell in panel 3 fails and using a nominal pillar strength of 40.0 MPa. It can be seen in this case that all the pillars in panel 3 collapse but the wider barrier pillars prevent this collapse from spreading to the adjacent panels. These hypothetical examples illustrate the potential use of the model to explore rapidly various layout configurations that comprise large numbers of pillars.
Case study to illustrate the application of the proposed model
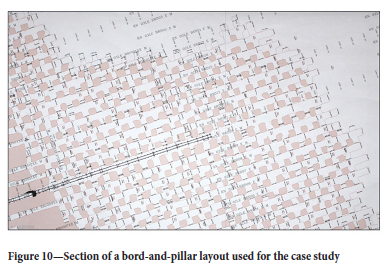
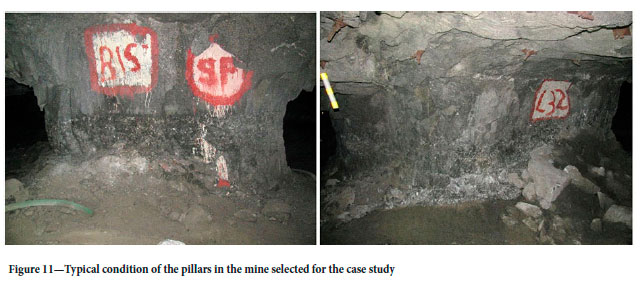
The proposed model has been applied to the simulation of a platinum mine in the western Bushveld Complex. The mine uses a bord-and-pillar layout to exploit the Merensky Reef. A detailed portion of the mine layout is illustrated in Figure 10, showing the pillars that were established in a square grid pattern with a nominal pillar centre spacing of 12 m. The designed pillar size was 6 m χ 6 m, yielding a nominal extraction ratio of 0.75. The average mining height is 2.3 m. The typical condition of the pillars is shown in Figure 11.
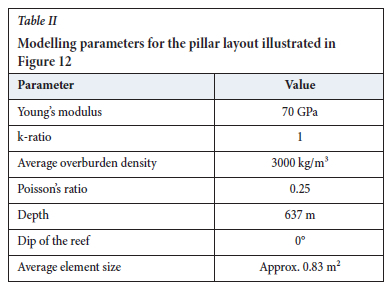
A simplified diagram of the mine layout is illustrated in Figure 12, showing the 294 pillars that were established in a square grid pattern in the area of interest. A modelling exercise was undertaken initially to obtain an accurate estimate of the load carried by each individual pillar without using the effective stiffness model. The detailed model was constructed using triangular displacement discontinuity elements to facilitate the representation of local irregularities in the pillar shapes and the surrounding borders of the mined region. The model comprised 49 380 triangular elements. Only the pillars of interest were discretized. The dip of the reef is small in this area and it was simulated to be 0° to simplify the modelling. The depth of the area was approximately 637 m. The overburden density was estimated to be 3000 kg/m3 and the vertical virgin stress magnitude is therefore 19.11 MPa for the assumed depth. The modelling parameters are summarized in Table II.
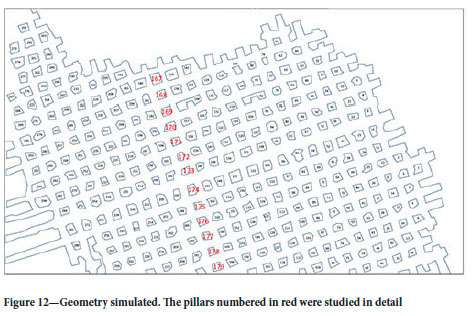
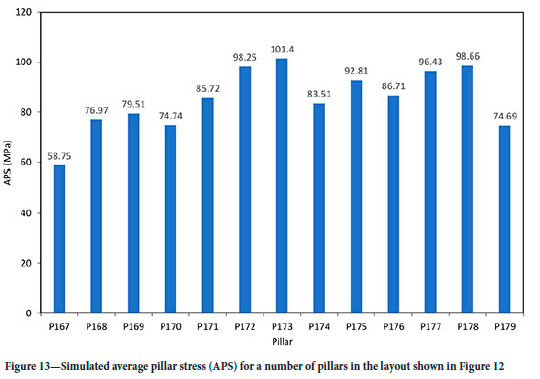
The total simulated layout area was 49 679 m2 and this included a total pillar area of 10 568 m2. It should be noted that these areas imply an overall extraction ratio for the simulated mine layout of approximately 0.7873. The average pillar stress values that were calculated for the highlighted row of pillars shown in Figure 12 are illustrated in Figure 13. The assumed field stress at the mining horizon of 19.11 MPa implies an overall layout tributary stress of 89.83 MPa for each pillar. The simulated pillar stress values for some of these pillars were higher than this tributary pillar stress as the pillar cutting is poor and some pillars are smaller than the dimensions specified for the layout design. It should be noted as well that two pillars (P167 and P179) adjacent to the abutments in the model have lower average stress values.
The approximate pillar cell model using the effective stiffness concept was formulated utilizing the individual pillar areas from the detailed model to calculate each individual pillar cell extraction ratio ec as defined by Equation [7]. Using these values, the scaled effective stiffness values kc within each pillar cell can be inferred by using an empirical polynomial function to interpolate the square element point values shown in Figure 3 and in the last column of Table I. The interpolation function is given by
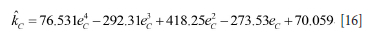
Equation [16] yields a value of kc = 0 when ec=1 and provides a smooth representation of the stiffness values between each point reported in Table I and in Figure 3 when ec > 0.4. (This relationship should, however, not be used if ec < 0.4.) The effective stiffness modulus of each cell is found by combining Equation [5] and Equation [13] to yield
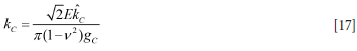
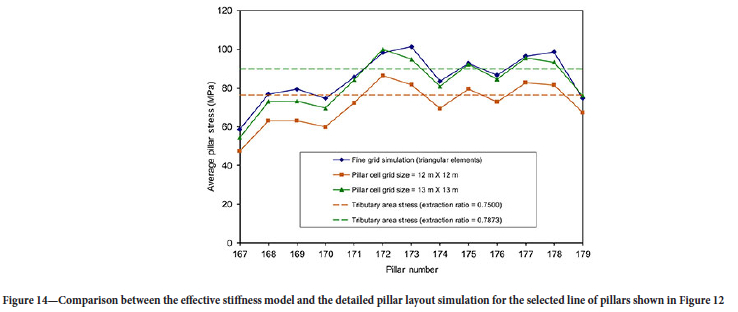
Two effective stiffness models were constructed to simulate the detailed layout shown in Figure 12. In the first case a square element grid was solved with a pillar cell grid size of 12.0 m superimposed over the 294 pillars depicted in Figure 12. The individual pillar cell effective stiffness modulus was calculated from Equation [17] with gc = 12.0m and using the interpolated value of kc relevant to each pillar together with the elastic property values Ε = 70 000.0 MPa and v = 0.2. Figure 14 shows a comparison between the simulated average pillar stress values (square-shaped points) and the detailed fine grid results (diamond-shaped points). The approximate cell values can be seen to fall below the detailed model results but do follow the individual pillar stress fluctuations qualitatively.
The underestimation of the approximate average pillar stress values evidently arises since the total area of the pillar cell elements is 294 χ 144 = 42336 m2, which is significantly lower than the area of 49 679 m2 that is used in the detailed layout simulation. This discrepancy can be reconciled by allocating a nominal average area of 49679/294 (168.98 m2) to each pillar cell element. The approximate solution was re-computed by adjusting the extraction ratio in each pillar cell using the actual pillar areas and an amended cell area of 169.0 m2. The effective stiffness modulus values were re-computed using the adjusted pillar cell extraction ratios kc and using gc = 13.0 in Equation [17]. The simulation results are plotted in Figure 14 and show a remarkably good agreement between the approximate pillar cell average stress values (triangular point markers) and the detailed model average pillar stress values for the selected line of pillars.
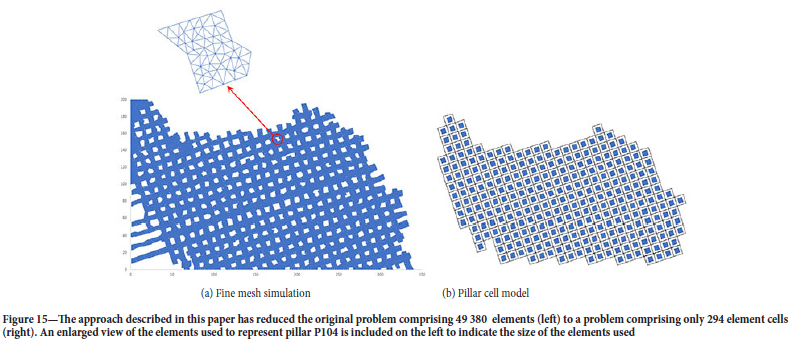
It should be re-iterated that the original problem comprising 49 380 elements has been reduced significantly to a problem comprising only 294 element cells (Figure 15). The effective pillar stiffness concept therefore appears to have considerable merit in providing a rapid means to assess the overall behaviour of large-scale pillar layout problems. At the same time it must be emphasized that local mining regions can still be assessed in detail if necessary. In this case, the approximate pillar cell scheme can be adapted to provide an excellent approximation to the background stress values that are induced by the overall layout configuration within a local region of interest which can be modelled in finer detail.
The reduction of the problem size also allows for the possibility of analysing multiple seam problems and the effective stiffness values can, in principle, be adjusted as well to simulate time-dependent pillar strength decay and pillar edge scaling behaviour.
Conclusions
A simple pillar cell stiffness concept has been proposed to facilitate the assessment of the stability of large-scale pillar layout problems. The approximate scheme allows for individual variations of pillar extraction ratio within each pillar cell to be specified. The effective stiffness of a representative pillar cell can be established numerically for planar layout problems. Comparisons between the proposed scheme and detailed simulations of an actual pillar layout indicate encouraging agreement. It is noted that the overall mined area and overall extraction ratio should be represented accurately in order to obtain correctly scaled average pillar stress values.
The effective cell stiffness scheme provides a tool for the rapid assessment of large-scale pillar layout performance with selected pillar extraction ratios. The new pillar cell feature can be combined with any existing layout configurations and can be incorporated as well in multi-scale simulations.
References
Couto, P.M. and Malan, D.F. 2022. A limit equilibrium model to simulate the large-scale pillar collapse at the Everest Platinum Mine. Rock Mechanics and Rock Engineering, vol. 56. pp. 183-197. https://doi.org/10.1007/s00603-022-03088-z [ Links ]
Deist, F.H., Georgiadis, E., and Moris, J.P.E. 1972. Computer applications in rock mechanics. Journal of the South African Institute of Mining and Metallurgy, vol. 72. pp. 265-272. [ Links ]
Esterhuizen G.S. 2014. Extending empirical evidence through numerical modelling in rock engineering design. Journal of the Southern African Institute of Mining and Metallurgy, vol. 114. pp. 755-764. [ Links ]
Li, C., Zhou, J., Armaghani, D.J., and Li, X. 2021. Stability analysis of underground mine hard rock pillars via combination of finite difference methods, neural networks, and Monte Carlo simulation techniques. Underground Space, vol. 6, no. 4. pp. 379-395. [ Links ]
Malan D.F. and Napier J.A.L. 2006. Practical application of the TEXAN code to solve pillar design problems in tabular excavations. Proceedings of the SANIRE Symposium "Facing the Challenges", Rustenburg. South African National Institute of Rock Engineering. pp. 55-74. [ Links ]
Napier, J.A.L. and Malan, D.F. 2007. The computational analysis of shallow depth tabular mining problems. Journal of the Southern African Institute of Mining and Metallurgy, vol. 107. pp. 725-742. [ Links ]
Napier, J.A.L. 1991. Energy changes in a rockmass containing multiple discontinuities. Journal of the South African Institute of Mining and Metallurgy. vol. 91. pp. 145-157. [ Links ]
Napier, J.A.L. and Malan, D.F. 2011. Numerical computation of average pillar stress and implications for pillar design. Journal of the Southern African Institute of Mining and Metallurgy, vol. 111. pp. 837-846. [ Links ]
Napier, J.A.L. and Malan D.F. 2021. A limit equilibrium model of tabular mine pillar failure. Rock Mechanics and Rock Engineering, vol. 54. pp. 71-89. [ Links ]
Plewman, R.P., Deist, F.H., and Ortlepp, W.D. 1969. The development and application of a digital computer method for the solution of strata control problems. Journal of the South African Institute of Mining and Metallurgy, vol. 70. pp. 33-44. [ Links ]
Ryder, J.A. and Napier, J.A.L. 1985. Error analysis and design of a large-scale tabular mining stress analyser. Proceedings of the 5th International Conference on Numerical Methods in Geomechanics, Nagoya, Japan. Balkema, Rotterdam. pp. 1549-1555. [ Links ]
Salamon, M.D.G. 1968. Two-dimensional treatment of problems arising from mining tabular deposits in isotropic or transversely isotropic ground. International Journal of Rock Mechanics and Mining Sciences, vol. 5. pp. 159-185. [ Links ]
 Correspondence:
D.F. Malan
Email: francois.malan@up.ac.za
Received: 13 Nov. 2022
Revised: 8 May 2023
Accepted: 30 May 2023
Published: May 2023

