


Serviços Personalizados
Artigo
 Inglês (pdf)
 Artigo em XML
 Referências do artigo
Indicadores

Links relacionados
-
 Citado por Google
 -
 Similares em Google
Compartilhar

 Permalink
Journal of the Southern African Institute of Mining and Metallurgy
versão On-line ISSN 2411-9717
versão impressa ISSN 2225-6253
J. S. Afr. Inst. Min. Metall. vol.123 no.4 Johannesburg Abr. 2023
http://dx.doi.org/10.17159/2411-9717/1902/2023
PROFESSIONAL TECHNICAL AND SCIENTIFIC PAPERS
M. Handley
Retired
SYNOPSIS
The Witwatersrand Basin contains by far the most gold ever found, and has hosted mining from its discovery in 1886 to the present. For many years, South Africa was the world's largest producer of gold, nearly all of which came from the Witwatersrand. Since 2000, South Africa has fallen back several positions because of declining gold output. There are many complex and varied reasons for this; however, declining gold resources in the Witwatersrand Basin are not one of them. As far as the author knows, there are no qualified estimates in the literature of gold remaining in the Witwatersrand Basin. This paper collects mining data from several sources and then, using elementary gold accounting and error analysis, attempts to estimate the amount of gold remaining in the Witwatersrand Basin. It includes gold underground in existing and defunct mines, in evaluated ore resources, and dumps. Compiled data from 1887 to 2019 shows that 50 200 t of gold were produced by Witwatersrand mines, while it is estimated that a further 48 100 t remain underground, both within and outside of mine leases, a further 1 600 t on the surface in tailings, and an unknown amount in rock dumps. Nearly all of this gold will remain inaccessible with current mining methods, and major technical developments in mining will be necessary before any of the gold can be categorized as a code-compliant resource or reserve. To win this prize, the mining industry will have to rethink its approach to mining, both in old mining leases and in the unexploited ground. It will also have to find effective means of preventing gold theft and informal mining, which are on the rise.
Keywords: gold, Witwatersrand Basin, remaining resources.
Introduction
The Witwatersrand Supergroup contains arguably the largest known economically extractable resource of gold in the world, perhaps even more than that dissolved in the oceans and the rocks and sediments on the ocean floor. Seawater contains approximately 50 fmol/l or 10-11 g/l gold in solution (about 13 500 t in all the oceans (Faulkner and Edmond, 1990), and an unknown amount in ocean floor sediments and the oceanic crust, while the Witwatersrand has so far yielded approximately 50 200 t of gold with at least a further 48 100 t remaining. This paper addresses the question of the remaining gold contained in the known reefs, which have been exposed since the discovery of gold on the Witwatersrand in 1886. There was no significant production of gold from the Witwatersrand before 1887, the year that the first mining companies on the Witwatersrand were formed (Handley, 2004). This synthesis includes 1886, even though gold production from the Witwatersrand in that year amounted to little more than a few hundred kilograms obtained from early crushing of outcrop rocks and panning the fines for demonstration, evaluation, and to attract investment.
Since 1886, there has been unbroken production of gold from Witwatersrand ores to the present day. The rise of informal production of gold from defunct as well as producing mines, mergers between existing mines and gold mining companies in South Africa, and the formation of new companies have impaired accurate record-keeping of gold production from the Witwatersrand. Hence, publicly available statistics for gold mines producing from Witwatersrand Basin ores became more difficult to collect in the mid-1990s, to the point that reliable statistics after 2005 could not be compiled. To bring the discussion up to date, estimates of Witwatersrand gold mine production, with significantly increased error for the years 2006 to 2019, supplement the statistics to 2005, with insignificant increases in the overall error of estimating the remaining gold in the Witwatersrand Basin.
The Witwatersrand Supergroup, comprising the upper and younger Central Rand Group (deposited between 2914-2714 Ma) and the lower and older West Rand Group (deposited between 2970-2914 Ma) is an ancient sedimentary deposit (Hayward et al., 2005, McCarthy, 2006; Tucker, Viljoen, and Viljoen, 2016). Its outline appears in Figure 1 within a grid spanning latitudes 25.5° S to 29.0° S, and longitudes 25.5° E to 29.5° E. Section A-A' in Figure 1 lies in the plane of the great circle with a dip 27° S and dip direction 24° E - if the Earth's equatorial plane and the Greenwich Meridian are used as references - and appears in Figure 2.
Figure 2 shows that the Witwatersrand Supergroup occupies a very small volume of the Earth's crust, yet it contains such a large concentration of gold. The grid in Figure 1 is enlarged in Figure 3 to show the surface geology, the mine leases, and important cities and towns in the region. Figure 3 shows that much of the Witwatersrand Supergroup is covered by younger rocks, outcropping only in the Johannesburg-Soweto region, to the east of Klerksdorp on the western rim of the Vredefort impact structure (Reimold, 2006), and the south-southeast of Johannesburg in the Balfour region. The Vredefort structure brings the deep-lying rocks in the centre of the basin back to the surface, where it is evident that gold is still present in conglomerate reefs there.
The Central Rand Group rocks, known to be the main gold carriers, span approximately 300 χ 120 km, covering an area of approximately 33 600 km2, or 0.0066% of the Earth's surface (Handley, 2004). The gold mine leases were established along approximately one-third of the basin edge where the gold-bearing reefs are shallowest and richest. The mining leases cover an estimated 2 700 ± 300 km2, appearing in Figures 3 and 4. They are fluid as new areas are incorporated into or dropped from them. Figure 4 shows the Witwatersrand Supergroup with the surface rocks stripped away, along with the mine leases on the basin edges as best as they can be drawn with available data and at the scale for the diagram. The leases as shown are by no means completely current, but they do roughly outline the seven major goldfields that have been discovered and exploited to date.
The diagram shows, by the distribution of mine leases, that economic gold concentrations occur mainly along the basin edges. The gold was concentrated and then remobilized in conglomerate bands, or 'reefs' of sedimentary origin (see Minter et al., 1986; Hayward et al., 2005; McCarthy, 2006; Tucker, Viljoen, and Viljoen, 2016 for more on the nature of the reefs). Palaeocurrent studies reveal that the sediments and gold were brought into the basin from the outside. Gold was concentrated by sedimentary processes and remobilized by later hydrothermal events once the sediments had consolidated into rock. These hydrothermal events coincided with the deposition of the lower portion of the Transvaal Supergroup (approximately 2 500 Ma), the deposition of the upper portion of the Transvaal Supergroup (approximately 2 300 Ma), and the emplacement of the Bushveld Complex followed by the Vredefort impact structure (approximately 2 050-2 000 Ma, Robb and Meyer, 1995). Most features of the Witwatersrand Basin are currently best explained by a modified placer theory (Hayward et al., 2005), although the origin and quantity of the gold found in it are still enigmatic. Discussion of the origin of the gold is beyond the scope of this paper; interested readers should refer to the rich and varied literature that has been published on the subject, beginning with the authors cited above.
The reefs at the basin edge dip toward the centre of the basin, the gold concentration declining with increasing distance from the basin margin. They probably lie no deeper than 8 000 to 10 000 m below the surface at their deepest point before rising towards the surface around the Vredefort impact structure. Mponeng mine in the south-central Carletonville Goldfield is the deepest mine in the world, reaching 4 000 m below the surface. On the scale of Figure 2, this is still little more than 'a scratch on the surface' of the planet. This brief introduction to the Witwatersrand Supergroup hardly does justice to this remarkable resource, or the many great gold mines that produced from it.
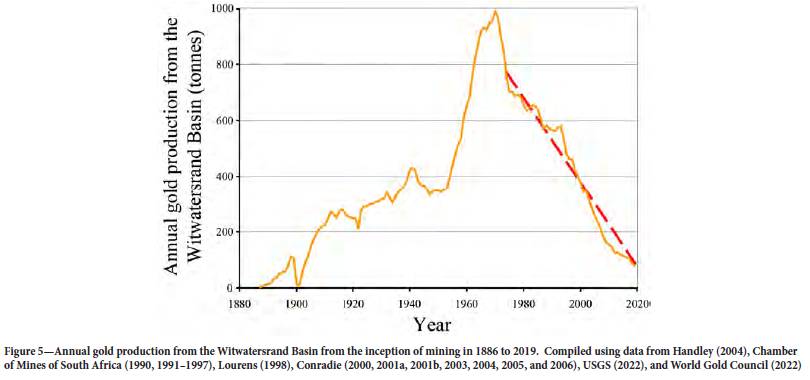
Table I contains statistics spanning the 120 years of continuous mining from 1886 to 2005 for the seven goldfields that have been discovered to date. Overall, almost 6 χ 109 t of gold-bearing reefs have been mined and processed in this period, at an average grade of 8.07 g/t. The major gold-carrying reefs mined are the Basal Reef (Free State), Carbon Leader Reef (Carletonville), Kimberley Reef (Evander), Main Reef (West Rand, Central Rand, East Rand), Main Reef Leader (Central and East Rand), Middelvlei Reef (stratigraphically related to the Main Reef, Carletonville), South Reef (Central and West Rand), Vaal Reef (Klerksdorp), and Ventersdorp Contact Reef (Carletonville and Klerksdorp). The amount of ore and grade of these reefs far exceeds any other gold deposit in the world, and South Africa became the world's largest gold producer from the late nineteenth century to approximately 2006. South Africa has slipped back in recent years from being the world's largest gold producer because of declining production from the Witwatersrand Basin. Figure 5 shows the gold production from 1887 to the present. This plot does not suggest that the gold resource of the Witwatersrand Basin has been depleted; far from it, there is probably more gold to be won than has been recovered in the 136 years since mining began.
The author estimates that just over half of the known gold reserve in the Witwatersrand Supergroup had been extracted by the end of 2019, with slightly less than half remaining to be mined. Three unquantified losses are gold theft, informal mining, and gold-bearing ore sent to surface rock dumps. Theft has persisted throughout the history of mining, while informal mining has accounted for an increasing proportion of gold won from both producing and defunct mines in the Witwatersrand Basin. Since these losses cannot be quantified (see Gastrow, 2001; Minerals Council, 2019) the author has been forced to ignore them. Gold-bearing ore can be sent to surface waste rock dumps instead of processing for a variety of reasons not explored in this paper. Like theft and informal mining, there are no records of the amount of gold sent to waste rock dumps, so this loss remains unaccounted for until discussion of the mine call factor. The net effect is an underestimate of the amount of gold produced by the Witwatersrand mines, and possibly a corresponding over-estimate of the amount of remaining gold.
The author concludes that current mining methods will not be able to extract more than a fraction of the remaining inferred to measured gold resources, and that gold theft and informal mining will continue to play an important role in limiting future production unless more effective controls are implemented. Gold mining companies and research institutions should collaborate to improve future gold extraction methods and to minimize gold theft so that the huge remaining prize can be won for the benefit of all.
Estimate of remaining gold
An estimate of remaining gold is made in this paper using mining data from the Witwatersrand mines from 1886 to 2019 and gold exploration data from the Witwatersrand Basin up to the end of 1998 (Handley, 2000, p. 2). For this analysis, it is assumed that no significant new gold finds were made in the Basin between 1998 and 2019. An enormous amount of mining and production data have been collected and recorded, the best of which comes from the listed producing gold mines themselves and the Chamber of Mines, which compiled and summarized the data from its member mines.
The Chamber of Mines (renamed the Minerals Council South Africa in 2016) was first formed at a meeting of representatives on Saturday 5 October 1889 and named the Witwatersrand Chamber of Mines. It succeeded the 'The Old Chamber', which was formed in December 1887, but failed because of a lack of support from the mines and some of the mining houses. One motivation for the formation of the current Chamber was to compile 'authoritative information on the output of the Witwatersrand goldfield that would be acceptable to the financial capitals of the world' (Lang, 1986).
The Chamber and its forerunners certainly adhered to that objective, producing mining statistics for its gold mining members that are amongst the finest anywhere in the world (Handley, 2004, p. 78). It must not be forgotten that the quality of the Chamber statistics is a direct result of the quality of reporting by all its members, namely the producing mines of the Witwatersrand. The Chamber of Mines, followed by the Minerals Council South Africa, has continued as representative organization for mines and mining-related activities in South Africa for the last 133 years. This paper will refer to it as the Chamber, or the Chamber of Mines because the references for nearly all the data used came from the earlier-named Chamber of Mines.
The data and discrepancies in the data
The statistics used with confidence in this paper were compiled from the Chamber of Mines of South Africa (1990), Lourens (1998), Handley (2000, 2004), and Conradie (2000, 2001a, 2001b, 2003, 2004, 2005, 2006). The second and fourth authors collected and published gold mining data for the Department of Minerals and Energy, which will collectively be referred to as 'government data'. The initial discussion covers a period of 120 years from 1886 to 2005 inclusive, since this is the period covered by the most reliable data. Although the statistics for gold production in South Africa for the last 136 years are very good, uncertainties remain because early records from 1886 to 1910 are incomplete (Chamber of Mines, 1990, p. 8S). In the mid- to late 1990s, the quality and availability of data declined because of sweeping changes in South Africa and the mining industry.
The production statistics compiled by the Chamber of Mines were obtained from the gold mining companies listed on the Johannesburg Stock Exchange, and who were members of the Chamber. As far as the author knows, no industry before or since has produced such transparent, accurate, and comprehensive reports as did the gold mining companies of the Witwatersrand. Quarterly reports, or gold quarterlies as they became known, were published in the morning edition broadsheet-format Rand Daily Mail, the Business Day after the dissolution of the Rand Daily Mail, the Saturday Star, and the tabloid-format Citizen in the days following the end of each quarter (31 March, 30 June, 30 September, and 31 December). The reports appeared in tranches, as they were published by the different mining houses that administered the individual gold mines (see Handley, 2004 pp. 51-92 for a history of the development of the gold mines and mining houses on the Witwatersrand). For example, Gold Fields of South Africa Limited would publish the quarterly reports for its seven producing gold mines (West Driefontein, East Driefontein, Doornfontein, Venterspost, Libanon, Kloof, and Deelkraal) on a pre-arranged day in the morning daily newspapers named above. The other mining houses, namely Anglo American Corporation of South Africa Limited, Union Corporation Limited, Johannesburg Consolidated Investment Company Limited, Rand Mines Limited, General Mining and Finance Corporation Limited, and Anglo Transvaal Limited would all do the same on pre-appointed, but different days in the same dailies. As far as the author can recall, the Saturday Star published summaries of the gold quarterlies, while the weekday evening newspaper, The Star did not publish any gold quarterlies.
The gold quarterlies usually appeared in tabular form for each mine, reporting at least the following (this list is not complete):
> Area mined in square metres
> Average stope width
> Number of tons of ore that had been milled in the quarter
> Amount of gold produced
> Gold yield in g/t
> Cost per ton milled
> Average gold price received for the quarter
> Gold and other revenue generated per ton milled
> Profit/loss for the quarter for the mine, and taxation according to the lease area formula
> Ore reserves and measured grade of reserves
> Dividends declared (if there was a dividend for shareholders)
> Capital expenditure, and a description of where capital had been spent during the quarter, and where it was planned for the following quarter
> Comment on the gold market and factors affecting it, and the outlook for the coming quarter.
These reports were not trivial; the tranche of quarterly reports from one mining house would occupy up to a complete spread in the broadsheet newspapers and possibly more in the Citizen.
In addition to the quarterlies, each mine would publish an audited annual report at the end of each financial year. Most of the gold mines had financial years ending either in June or in December. The annual reports were more detailed than the quarterlies and were usually published in full-colour magazine format with good quality matt or gloss paper from the 1960s onward. A full-colour surface plan of the mine showing shafts, dumps, and other infrastructure together with a full-colour plan of underground workings - both usually 1:30 000 scale - accompanied or were bound into the report. These annual reports were 30-100 pages, containing all the information described above, but in more detail than in the quarterlies. The annual report typically published and discussed audited figures for the mine, auditor's statements, and a history of production and financial results from the inception of the mine. During the war years (the late 19th, and early 20th centuries) the annual reports were not always this elaborate; they were unembellished 10-20 page reports printed on recycled paper. Sometimes an underground plan of mine workings printed in monochrome or single-colour accompanied the reports.
The Chamber of Mines compiled all this information and much more into its annual Statistical Tables. This publication was informative and accurate. The best years stretched from 1910 to 1989, when virtually 100% of gold production came from mines that were members of the Chamber. Although the author has no access to any meaningful quantitative information, the Witwatersrand gold production from non-members of the Chamber - including the periods before 1910 and after 1989 - was truly insignificant, estimated at less than 1% of that of Chamber members (see also the footnotes to Table I).
With the major restructuring of the South African mining industry beginning in the early 1990s, this flow of information began to falter. The break-up of the mining houses, the delisting of mines from the Johannesburg Stock Exchange, and the incorporation of the delisted mines into newly formed gold-focused mining companies hastened the process. The break-up of the mining houses and the delisting of mines compromised the funding of the Chamber of Mines, severely hampering its ability to collect and compile annual mining data from about 1996, after which the Chamber no longer had such good access to gold mining data from the Witwatersrand. These events led to a gradual deterioration in both the quality and detail of Witwatersrand gold mining statistics.
Mining data reported by the Chamber before 1910 are by its admission incomplete (Chamber of Mines, 1990). Early mining data from the Witwatersrand mines were thoroughly researched by Handley (2004), who had compiled from various sources records of ore processed, gold production, and grade for the years 1886-1909. From 1910-1989 inclusive the data for the Witwatersrand gold mines, members of the Chamber, are consistent and reconcilable with small errors, and are considered reliable. The only omissions from these data is gold produced by operators who were not members of the Chamber of Mines. Figure 6 contains a graphic representation of listed gold mining companies, gold producers, and Chamber of Mines members from 1880 to the present, together with representations of major world events, and important local events that influenced mines and mining in the Witwatersrand Basin. The nominal gold price in US dollars forms a background to the plot.
The author had to resort to other sources for mining statistics from 2005 to the present, with decreasing confidence in the data obtained. Handley (2004) collected data to 2002; however. revision of Chamber of Mines statistics shows discrepancies with that data from 1990, for both tonnage treated and gold produced. These differences amount only to a difference in judgment between the author and Handley (2004).
In addition to compiling annual data for the gold mines of the Witwatersrand, the Chamber of Mines maintained records of total mine production from inception to closure for all member mines, unless they amalgamated with an existing mine or terminated Chamber membership. Cumulative records of total production for all closed and producing member mines appear in Chamber of Mines, (1990, Tables I and II, pp. 11S-12S. These data, as well as the annual data already discussed, were used by the author to estimate gold remaining in the Witwatersrand Basin and the uncertainties associated with the calculation.
The government data (Lourens, 1998; Conradie, 2000-2006) separated gold production annually from the seven major Witwatersrand goldfields, without producing similar statistics for the number of tons milled or the gold grades. The producers were not named, so reconciliation with the Chamber of Mines (1990) and Handley (2004) data was not possible. These data included gold production from non-members of the Chamber, and in addition there are other discrepancies arising from the time of declaration of gold produced in the mines and the time when these declarations were recorded by the government. There were therefore unexplained discrepancies between data from these two sources.
There are very few data publicly available on gold production from the Witwatersrand Basin by non-members of the Chamber, aside from that included in the government statistics. Companies for whom there are few or no public statistics are the Boschoff Group of Companies (Meiring, 1963), Consolidated Modderfontein Mines, Lindum Reefs, East Rand Gold and Uranium (ERGO), Knights Gold, Crown Gold, Golden Dumps, and more recently DRDGold, which has consolidated several gold mine dump retreatment operations. Although this list is by no means complete, the output from these operations is small (<1%) in relation to that of the Witwatersrand mines that were members of the Chamber of Mines.
Aside from the fact that the data produced both by the South African government and the Chamber of Mines cannot be reconciled, there are occasions from approximately 2000 where the records suggest that tonnage treated and gold produced by Witwatersrand mines exceeded the output for South Africa as a whole. This came about because foreign production by Chamber members was not - or could not be - separated from production from Witwatersrand mines. After 2005, the data become so unreliable that tonnage treated by the Witwatersrand mines had to be omitted, so grade calculations together with gold residue sent to mine dumps could not be included in the statistics.
The correct figures for tonnage milled, gold produced, and grade are not known. The figures from the Chamber of Mines (1990), Handley (2004), and minor revisions during the compilation of this paper are compared in Table II. Since there are no indications of which figure is the more accurate, all must be accepted as equally good, and are assumed measurements from a hypothetical population of normally distributed Witwatersrand gold mining statistics that has a mean and a standard deviation. The purpose of Table II is to illustrate the determination of the residual between two comparable statistics so that an error can be defined for them for the estimations that will be discussed later.
The standard deviation is the most widely used estimate of dispersion and standard error. However, in very small samples it is biased, even if Bessel's correction for variance computed from a sample with an unknown mean is applied. The population standard deviation computed from a sample containing only two data-points is underestimated by about 20% when computed this way. This is a well-known shortcoming of the standard deviation, but is confined to very small samples, which are of particular importance to laboratory experiments and quality control in industrial processes (see for example Duncan, 1979). Expected normalized residuals expressed as percentages have been computed for different sets of figures of tons milled and gold produced in rows 1 to 5 of Table II, and listed in rows 6 to 8 below the changed headings. The methods of computing these residuals, which can be considered standard errors, is described in the Appendix.
The Chamber of Mines (1990) has acknowledged that data before 1910 are incomplete for annual tonnages milled and gold produced by Witwatersrand mines, yet it has a complete record of tonnages and production for all its member mines since inception - many of which had started production in the period 1887 to 1910. The differences between the Chamber figures in rows 1 and 2 are relatively small, even though the comparisons do not cover the same period. The other two comparisons do cover the same period but show larger differences. Table II suggests the errors in tonnage and production are roughly 1% and 2% respectively. It would take a lifetime of dedicated work reconstructing all the records from the data available and gold mine annual reports - if these could all be found - to obtain better error estimates. It may be possible to do so using the quarterlies from the archives of the Business Day, Citizen, and The Star.
Uncertainties in tonnage milled, gold produced, and grade from 1886-2005
As far as the author is aware, uncertainty in the actual tonnage processed by any mine has never been reported publicly. All the mines in the Witwatersrand Basin used conveyor belts in the final stage of ore transfer to the crushing and milling circuits, where belt scales measured tonnage input. Morrison (2008, p. 95) observes that the in-service precision of belt scales is ± 0.5-2.0%. Assuming an industry-wide mean belt scale error of ± 1.0% over the last 133 years, and a secondary error of 1% for incomplete tonnage data from the Witwatersrand from Table II, the author assumes for error analysis that the two uncertainties are linearly additive (the maximum possible uncertainty, see Appendix). This results in an overall uncertainty of tonnage treated of 2%. The tonnage of ore milled during the 120 years from 1886 to 2005, to three significant figures with a 2% uncertainty, is 5.87 ± 0.12x10' t. This comes from row 4 of Table II, appears without an error or rounding in Table I, and with a 2% uncertainty in row 1 of Table VIII. The uncertainty of approximately 120 Mt amounts to a very large Witwatersrand mine, yet it represents only a 2% uncertainty in total tonnage treated by mines in the Witwatersrand Basin!
The gold production data are expected to be more accurate than the tonnage milled and should include all small operations in data submitted to, and reported by, the South African government. Gold data declared to the government is collected for South Africa as a whole, and even though it is reported for the six major goldfields separately, the author was unable to separate the proportions produced by member mines of the Chamber and small operations.
Besides the output of small operators, most if not all Witwatersrand mines re-ground and re-treated relatively high-grade tailings material. They also reprocessed sorted or unsorted waste rock dump material towards the end of their lives to supplement the declining production from underground, if gold-bearing ore had been sent to the rock dumps during the life of the mine. They also cleaned up processing equipment (stamp mills, tube mills, settling tanks, pumps, orepasses, conveyor belts, and other equipment) in the milling and treatment circuits to retrieve captured gold during and at the end of their lives. The gold was included in their declarations, while the extra tonnage milled when processing dump rock was also captured and reported.
In many mines, the tonnage treated exceeds the tonnage milled as they re-treated some of the previously milled tailings. Bearing all these factors in mind, and assuming that the gold declared by all the mines is accurate, an uncertainty of roughly 2% is applied to the produced gold, as was determined in Table II. This should also account for dump retreatment operations and small operators who were not covered by the Chamber of Mines. If not, there will be a small under-estimation of gold produced from the Witwatersrand, of the order of 1% or less. Therefore, the total amount of gold produced from the Witwatersrand Basin to 2005 appears in row 4 of Table II, repeated in Table I without error or rounding, and given in row 2 of Table VIII as 4.74 ± 0.09x10" t (a 2% uncertainty). This accumulated uncertainty over 120 years amounts to 947 t, the total gold production of a large Witwatersrand mine.
The average grade of the ore is obtained from the above two quantities, with the two uncertainties in tonnage milled and gold output now being added in quadrature for a quotient, since we assume that the errors in the data for tonnage milled and gold produced are independent and random (see Appendix). The average grade of all the gold-bearing ore treated by the Witwatersrand mines is given in row 4 of Table II, repeated in Table I, and in row 3 of Table VIII as 8.07 ± 0.23 g/t, for an uncertainty of 2.83%. These three uncertainties form the foundation of all the estimates that follow.
After 2005, ore tonnage data were unreliable to the point that they could not be used, and gold production data were becoming increasingly unreliable, and so South African production figures from the US Geological Survey (2022) and the World Gold Council (2022) were used (see Table III). Neither of these data-sets was considered much more reliable than data from local sources, but they could be averaged and an error determined in the same way as was done for Chamber data up to 2005. There was an average 10% disparity between data from each organization for each year (see Table III), which is assumed as the error for reported gold production from 2010-2019. The analysis assumes the same level of uncertainty for the Chamber of Mines (2010) figures for the years 2006-2009. An amount of 13 t for by-product gold from the platinum mines and gold from the Barberton gold mines, amongst other sources, was subtracted from figures for South African production from 2006-2019 to arrive at an estimate for the Witwatersrand production. The annual 13 t deduction was determined by averaging the differences between South African production and Witwatersrand production from the decade ending in 2005. The larger uncertainty in Witwatersrand gold production figures from 2006 has little influence on the overall uncertainty in gold production for the period 1886-2019.
Estimate of gold remaining in Witwatersrand mine leases 1886-2005: Step 1
The estimates were produced in two steps:
> The first is for the period 1886-2005, where estimates for gold remaining in tailings and left underground in mine leases up to 2005 are included (the quantity of gold in waste rock dumps remains unknown)
> A second - less reliable - estimate of gold production only from 2006-2019, since there were insufficient data to estimate gold left underground and in tailings. This step includes the evaluated gold resource within and between mine leases declared by mining and exploration companies up to the end of 1998 (Handley, 2000). The second step culminates in an estimate of the remaining gold in the Witwatersrand Basin. It includes the gold left behind in the current mining leases from step 1, the evaluated gold resource after Handley (2000), and the gold lost during the mining process from 2005-2019, although the latter figure cannot be quantified because of the poor data.
The preliminary stage of the first step Involves computing the grade and size of the mineral reserve in which the Witwatersrand mines were worked. The tonnage milled and gold declared as given above are part indicators only of the size of the mineral reserve exploited, because they exclude gold not recovered in the mining and metallurgical processes, residual gold in mine tailings, and gold in waste rock dumps. The discussion that follows details the calculations as they appear in Table VIII. The losses during the mining process include gold lost during mining and transport and never retrieved and unrecovered gold ore sent to waste rock dumps; they do not include losses from gold theft, and informal mining. To include these, the term broken gold is used, but theft and informal mining remain excluded:
broken gold = declared gold + gold not recovered in metallurgical extraction + gold in tailings + gold in waste rock dumps)x(1/(1-fraction of gold lost in mining))
The multiplication factor at the end of the gold sum is none other than the reciprocal of the mine call factor (MCF), expressed as a decimal fraction, so rewriting the above equation (the MCF will be discussed later):
broken gold = (declared gold + gold not recovered in metallurgical extraction + gold in tailings + gold in waste rock dumps) / (MCF expressed as a decimal fraction)
The first term in the above sum has been dealt with, is known with reasonably good accuracy, and has an assumed uncertainty of ± 2% as discussed previously. The second, metallurgical term, has been addressed throughout the history of mining and has resulted in improving extraction efficiency, while some of the gold lost in the extraction process has been retrieved by retreatment of high-grade slimes and sand, and cleaning of metallurgical extraction equipment during active mine life. Gold lost in the metallurgical process is therefore assumed negligible, aside from the gold in tailings dumps which represents a small fraction of the broken gold resource that could not be extracted from the crushed ore.
Data for the residual grade of tailings sent to tailings impoundments is usually contained in the mines' annual financial statements and reports. However, most annual reports are no longer available. In the late 19th century, ore was crushed in stamp mills and then split into sand (approximately 11% -75 μm) and slime (about 95% -75 μm) fractions, after which the sand-sized residue was treated by percolation cyanidation, and the slime fraction impounded without treatment (Bosch, 1987). In 1894, the decantation process was introduced, and both accumulated and run-of-mill slime were leached, leaving a residue of 0.05-0.5 g/t after the gold had been extracted. The sand fraction typically carried 0.3-1.5 g/t gold after percolation cyanidation (Bosch, 1987). The introduction of tube mills in 1904 to regrind the stamp mill sand fraction reduced the sand-to-slime ratio. Up to 1936 a substantial fraction of gold ore (the author estimates 35%) was still being treated in sand plants, but after 1946 nearly all the ore was ground to slime in tube mills with a residual grade of 0.1-0.5 g/t (Bosch, 1987).
The author assumes that before 1946 all Witwatersrand mining had taken place only in the East, Central, and West Rand. According to Table I, these goldfields processed about 44% of the ore, with a diminishing contribution after 1946, when the newly discovered and developing Carletonville, Orange Free State, Klerksdorp, and Evander goldfields produced the lion's share of South Africa's gold. The mines developed in the new goldfields used an all-sliming process with residual grades of 0.1-0.5 g/t. Using the Bosch (1987) data and weighting residual grades appropriately for the entire mining history of the Witwatersrand result in an average grade for tailings of 0.36 g/t. Van Rensburg (2016) quoted the average gold content in tailings for the East Rand, Central Rand, West Rand, and Free State goldfields (67% of all Witwatersrand ore processed) of 0.34 g/t. These data did not cover the entire Witwatersrand Basin; therefore, the author uses the average of 0.36 g/t computed after Bosch (1987) but allows for an uncertainty of 0.1 g/t because of the wide margins for residual gold concentrations given by Bosch (1987). The residual grade with its uncertainty is given in row 4 of Table VIII. The average grade of ore sent for processing was therefore the average yield of mined reef plus the average gold grade of tailings, with its uncertainty determined in quadrature in row 5 of Table VIII and given as 8.43 ± 0.25 g/t.
The amount of gold sent to tailings impoundments is the average residual grade of the tailings (row 4, Table VIII) multiplied by the tons treated (row 1, Table VIII), indicating that a total of 2.11 ± 0.59x10³ t gold were sent to tailings impoundments from 1886 to 2005 (row 6, Table VIII). The uncertainty is nearly 28%, dominated by the relatively large uncertainty in residual grade set in row 4 of Table VIII. The percentage of dump material treated and given in row 8 of Table VIII cannot be determined from publicly available data. The author estimates that up to 2005, about 40% of tailings impoundments had been re-treated for their gold content by producers who were non-members of the Chamber of Mines. Examples are East Rand Gold and Uranium (ERGO), the Crown Gold (CM3) reprocessing plant at Crown Mines, Golden Dumps, Knights Gold, reprocessing at Stilfontein on the Klerksdorp goldfield, and the DRDGold dump reprocessing at Blyvooruitzicht and Doornfontein in the Carletonville goldfield. Their collective production amounts to 5.07 ± 2.08x10³ t of gold by 2005, appearing in row 10 of Table VIII. The output of dump retreatment operations such as the OFS Joint Metallurgical Scheme is included in the Chamber's data as gold declared by the mines that were members of the Chamber.
The gold produced by small operators re-opening closed mines, but who were not members of the Chamber, is not included (see footnote to Table I). The uncertainty introduced for tonnage milled and gold declared in rows 1 and 2 in Table VIII may cover this. If not, the amount of gold produced from the Witwatersrand Basin will be underestimated by an unknown, but relatively small amount of approximately 1%. The total mined and treated gold resource is the sum of the gold declared, gold recovered from dumps, and gold in dumps (rows 2, 10 and 11, Table VIII), with an uncertainty of 2.29%, namely 4.95 ± 0.11x10⁴ t (row 12, Table VIII).
The amount of gold that remains in untreated waste rock dumps is unknown; it is likely to represent a small fraction of the reserve mined because the dumps received waste rock mined from tunnels and other off-reef mine excavations used to access the ore. There were occasions when ore was mistakenly sent to the waste dumps, and waste was treated in the metallurgical plant. The details of managing such problems are beyond the scope of this paper; thus, the amount of ore and its grade, as well as waste in waste rock dumps, is unknown. All mines sampled their waste rock dumps from time to time to determine the amount of gold that might be present. They would certainly have decided to sort the ore from the waste in cases where the amount of ore in the dumps was small or process the entire dump if there were relatively large concentrations of gold. Examples of this took place at Blyvooruitzicht, West Driefontein, and Western Deep Levels among the modern mines, and it certainly took place to some degree in all the Witwatersrand mines. In such cases, this gold would have been included in gold declared by the mine, and the tonnage of sorted or unsorted dump rock material milled would have been reported and captured by the mines themselves and later by the Chamber of Mines. The author assumes that the gold content of unprocessed waste rock dumps is approximately zero because there are no data for this. This assumption does not alter the overall picture significantly, and the mine call factor - discussed next - accounts for gold lost during the mining process, including gold lost in surface rock dumps.
The mine call factor (MCF) is the ratio, expressed as a percentage, of the total quantity of recovered and unrecovered mineral product after processing to the amount estimated in the ore based on sampling. It is therefore the ratio of the expected gold minus gold lost in the mining and transportation process divided by the expected gold. The gold lost in the mining and transport processes includes the following:
> Gold fines created by blasting and left in the stopes in cracks in the footwall, and embedded in stope supports
> Fines not properly removed from stopes (sweepings)
> Broken ore and fines not removed from stopes or abandoned in collapsed stopes, either in rockbursts or aseismic collapses
> Gold fine accumulations in orepasses over extended periods of use, in orepasses that were never properly emptied, and in collapsed or abandoned orepasses
> Unmined gold-bearing reef left in the footwall or hangingwall
> Gold fine accumulations in haulages, shaft infrastructure (belts, silos, spillage arrangements), and surface transport and tipping arrangements
> Ore and gold fines sent to waste rock dumps instead of metallurgical processing.
The Witwatersrand mines instituted many management controls to minimize these losses, such as grade control, geological control, mining sequence control, blasting control, and underground support. The controls were more effective in ensuring that broken ore did come out of the mine, but were generally unable to deal with the loss of fines effectively, especially where the reef was rich and friable. The theory that fines were lost in footwall cracks was not borne out by de Jager (1997) in a thorough study of the mine call factor at Western Holdings Mine in the Free State. The MCF cannot be discussed in detail for the Witwatersrand mines as a whole because its application varied both over time and from mine to mine.
In this paper the total gold losses are estimated by comparing the expected gold to be extracted from a sampled orebody and the actual gold declared by the mine when mining in that orebody, using company annual reports. Every listed Witwatersrand mine did record in every annual report the grade and gold content of the proved mineral reserves that it expected to mine in the ensuing 2-3 years. Two examples, Blyvooruitzicht Gold Mining Company Limited and its down-dip neighbour Western Deep Levels Limited, are analysed for gold losses.
If the ore reserve evaluations were accurate, and all the gold was extracted with zero loss, then the annual gold production would vary randomly above and below the expected output. Over years, the mean of the annual difference between the two would be zero, with a standard error related to the spread of the gold production data around the mean of zero. Expressed in terms of the mine call factor, it would have fluctuated above and below 100%, but would have averaged 100% over the long term. In the case of Blyvooruitzicht, there were 13 years where gold losses were negative (actually a gold gain) and 42 years with gold losses, for a net gold loss of 110 145 kg. Western Deep Levels recorded one gold gain in 21 years, and gold losses in the remaining 20 years for a net loss of 113 294 kg (see Table IV). Western Deep Levels has the higher measured percentage gold loss because it is the deepest mine in the world with the highest rockburst potential. The author notes from personal experience (1984-1999), that on any day following the blast, up to 50% of the mining panels were closed or partially closed either because of a collapse or a rockburst. Blyvooruitzicht is situated directly up-dip of Western Deep Levels and is therefore shallower, with a correspondingly lower tendency for rockbursts and loss of mining panels. This would undoubtedly have led to smaller gold losses underground than at Western Deep Levels.
There is discussion in the literature about the reliability of proven mineral reserve estimates obtained from chip sampling of stope faces in gold mines (see for example Fourie and Minnitt, 2016). The biases of chip sampling and evaluation may render perceived mineral losses non-existent, but on the other hand they may mask real mineral losses. The mine call factor can be misleading if the sampling and evaluation methods show any bias (de Jager, 1997). Table V provides a simple model that shows how mineral valuation bias can influence the measurement of gold losses without affecting the mine call factor at all.
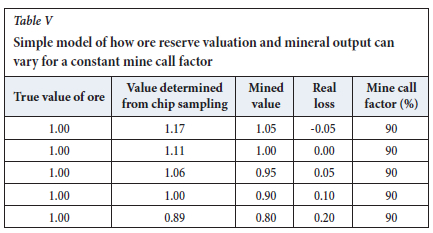
The author does not intend Table V to provide any further insight into the problem, except that it is unlikely that ore reserve estimates based on chip sampling could have been biased more than a few per cent either way. Secondly, all the mines of the Witwatersrand can't have extracted all the gold with 100% efficiency (i.e. a mine call factor of 100%, based on accurate and precise ore evaluation figures). Since the gold losses computed for the two mines in Table V cover a long period and a large tonnage of processed ore, they are considered representative of the real value of the ore reserves of the two mines, and the losses recorded are real losses. It is likely that there will always be a real gold loss because no mine can be 100% efficient, regardless of the mine call factor, real or perceived, as illustrated in Table V. The average percentage loss for the two mines in Table IV will represent the percentage of gold lost in the mining process for the Witwatersrand Basin as a whole, with an uncertainty of 10% (i.e. losses ranged from 9-1% for an average mine call factor of 89-91%, see row 13, Table VIII).
This figure and the associated uncertainty will most likely be revised if a wider sample of mines were assessed for gold losses in the mining process, or a more detailed study of gold losses was undertaken for the Witwatersrand Basin as a whole. From this analysis, approximately 10 ± 1% of gold is lost in the mining and ore transportation process - including unrecovered gold-bearing ore in surface waste rock dumps. The amount of broken gold that reflects as a sum of gold declared, gold lost in the metallurgical process, gold in tailings impoundments, and unrecovered gold in waste rock dumps must be multiplied by a factor of 10/9 (100/MCF), to 5.50 ± 0.56 χ 104 t if the measured average 10% loss is real (row 14, Table VIII). This figure has a 10.3% uncertainty, while the amount of gold lost to mining in the Witwatersrand Basin is 5.50 ± 0.58 χ 103 t with a 10.5% uncertainty (row 15, Table VIII). Finally, the actual grade of reef mined is therefore the amount of broken gold divided by the tons milled (assuming that it was mostly the fine fraction of broken rock lost during the mining process, not large volumes of gold-bearing rock) to give an in situ grade of 9.36 ± 0.98 g/t (row 16, Table VIII). The mine call factor now accounts for unrecovered gold in waste rock dumps, even though it remains unknown.
The next category of gold left underground is unmined reef. Safe mining practices sometimes require gold-bearing reef pillars to stabilize the underground workings. On other occasions, the reef grade may be too low for economic mining; in such instances, the ore remains underground. Reef pillars take on many forms, of which the following are examples:
> Shaft pillars to protect shafts
> Bracket pillars on either side of geological features such as faults or dykes to stabilize them
> Barrier pillars between mine leases
> Water barrier pillars (the Carletonville goldfield has examples)
> Regularly spaced stabilizing pillars
> Remnants that could not be mined because their grade was low or the stress and resulting rockbursting problem in the remnant was too severe
> Low-grade areas of reef left to form pillars. Geological losses in bracket pillars are not included in pillar area losses, since these pillars normally contain no gold. When planning the mining layout, mine planners strive to leave the lowest grade reef underground in pillars and remnants, so that the highest possible grade reef is extracted. This is done by planning to leave pillars and remnants in the lowest-grade areas as far as possible. This policy is not always successful, so the author has assumed that the average grade of all pillars and remnants left underground is 75 ± 10% of the average actual grade of the reef for the Witwatersrand Basin, given above as 9.36 ± 0.98 g/t (row 18, Table VIII). The expected average grade of all unmined ground in all the Witwatersrand mines is therefore 7.02 ± 1.19 g/t (row 19, Table VIII).
The author assumes further that 20 ± 10% of all reef exposed in the Witwatersrand mines was left unmined; in the shallow mines, this figure is lower, while in the deeper mines it is higher. Thus, on average, throughout the history of mining in the Witwatersrand Basin, four out of five parts of the reef accessed underground were mined, while a fifth of all gold-bearing reef was left unmined, amounting to 1.47 ± 0.74x10' t in pillars or remnants (row 20, Table VIII). At an average grade of 7.02 ± 1.19 g/t, this amounts to 1.03 ± 0.55 χ 104 t gold (row 22, Table VIII). The total resource of gold-bearing reef available to the Witwatersrand mines amounted to the sum of the total milled (row 1) and the total left underground (row 20) with uncertainties determined in quadrature for a total of 7.34 ± 0.74 χ 109 t of reef (row 21, Table VIII). The total gold resource available to the Witwatersrand mines was the sum of gold broken and unbroken gold (rows 14 and 22, Table VIII), with uncertainties in these two rows added in quadrature, and totalling 6.53 ± 0.78 χ 104 t (row 23). The average grade of all reef mined is the quotient of rows 21 and 23, namely 8.90 ± 1.40 g/t (row 24, Table VIII). The Witwatersrand mines, therefore, had access to a gold resource of 65300 ± 7800 t of gold (row 23), from which they were able to produce 47 400 ± 947 t gold, with the remainder of 17 400 ± 7900 t of gold never extracted (row 25, Table VIII 8), amounting to a percentage never extracted of 26.7 ± 12.5% (row 26, Table VIII). Table VI summarizes these figures, which appear as the raw quantities from Table A1.
Table VI indicates the challenges posed by mining the deep-lying narrow tabular gold-bearing reefs of the Witwatersrand. The gold mines are not amenable to mechanization, or rather engineering and technological innovation have so far not been able to make them amenable, despite substantial research (see Pogue, 2008). The drill-and-blast practice for excavating the ore has never been successfully replaced by gentler mechanical extraction methods because of the strength, hardness, and abrasiveness of the quartzitic rocks that host the gold. Mechanical extraction of the reef would substantially reduce the mining gold losses of 10% that have been estimated for the Witwatersrand mines, but would not contribute to minimizing the amount of ore that is left behind in remnants and pillars to stabilize the mines. These two losses amount to a clear mandate to revisit and research new mining methods for the Witwatersrand mines since the large amount of gold remaining in current mining leases is unlikely to be extracted by current methods. Therefore, this gold may not meet the principle of Reasonable Prospect of Eventual Economic Extraction (RPEEE), which forms the core of the SAMREC Code (2009, 2016, Clause 24 for solid ore), and which is clearly explained by Lock (2020). Further research is necessary to make these resources efficiently and economically extractable. The author briefly outlines new research objectives in the discussion and conclusions below.
Estimate of gold remaining in the Witwatersrand Basin 2006 - 2019: Step 2
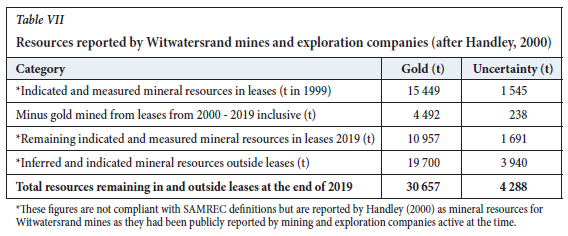
This step follows from the previous step and includes gold left behind in the current mining leases from step 1. The evaluated gold resource after Handley (2000) has been included, while the gold lost during the mining process from 2006-2019 cannot be quantified because of the poorer data. The previous section establishes that there are 17 400 ± 7 900 t of gold that was never extracted from the mine leases of the Witwatersrand gold mines (Table VIII, row 25). The gold mines still operational in 2000 had also indicated that the total resource within their leases - current at the time - was 15 400 t gold. In addition to this resource, Handley (2000) has carefully documented another 19 700 t of gold present outside mine leases and in parts of the Witwatersrand basin between goldfields. The evaluations from within and beyond leases took place at least a decade before the development of the SAMREC Code (2009, -2016). The author assumes that the mining companies concerned would not have made these declarations unless they believed that they could exploit these resource economically at some point in the future. Handley (2000) would not have documented them so carefully if they were inaccessible. Therefore, the author believes that they comply with the RPEEE principle outlined above, and can be included as unmined resources in the Witwatersrand Basin.
There is little doubt that most of the exploration evaluations compiled by Handley (2000) contain data from multiple intersections from surface drills, knowledge of the local geological structure, sedimentology, and continuity of the Witwatersrand reefs intersected. A few may be more speculative. It is difficult to separate the two, since Handley (2000) did not assign any quantitative confidence levels or errors to these estimates. The SAMREC Code does not provide any confidence guidelines besides those for Pre-Feasibility and Feasibility studies (see SAMREC, 2016, p. 77 and Table 1, pp. 43-65).
The author assumes that the exploration evaluations for gold between mine leases were at an exploration or pre-feasibility level, where the amount of gold had been evaluated to an approximate 20% uncertainty. Therefore gold outside and between mine leases is estimated by the author from Handley (2000) to be 19 700 ± 3 940 t (row 33, Table VIII). The gold within existing mine leases was also not assigned any confidence limits by Handley (2000) but should be known with higher confidence. The author set the confidence in these estimates at the Pre-Feasibility - Feasibility level of approximately 10% uncertainty, or 15 400 ± 1 540 t (row 30, Table VIII). These estimates and their associated uncertainties do not constitute an estimate compliant with the SAMREC (2016) Code, but are intended to provide a better answer than the estimates of gold in the Witwatersrand Basin given in the literature, as well as an error for those estimates.
This analysis is global in nature and serves as a guide to the Witwatersrand Basin as a whole. It should not be applied to parts of the basin only, and it excludes low-grade gold-bearing reefs described below. It considers exploration results compiled by Handley (2000), which cover areas within mine leases and between mine leases along the edges of the basin, or in down-dip extensions to reefs currently being mined. It does not consider reefs at depth toward the centre of the basin, where gold is known to be present.
Therefore, this estimate of gold remaining in the Witwatersrand Basin is likely to be far less than the amount of gold actually remaining, because of the sub-economic gold resource left largely untouched in the minor reefs in the existing mine leases, and between mine leases, all of which are low grade (< 3-5 g/t). The higher-grade sub-economic reefs, namely the Leader Reef, 'A', and 'B' Reefs (Free State), the Middelvlei Reef and North Leader (Carletonville), the many minor reefs on the West and Central Rand, and the Kimberley Reef (East and Central Rand) all fall into this category. There are other sub-economic reefs which remain excluded, and perhaps some - both economic and sub-economic -that are still unknown. Finally, gold theft and informal mining are ignored, for reasons already stated. The effect of omitting these two is to underestimate the amount of gold that has been extracted from the Witwatersrand with a potential overestimate of gold remaining in and around the existing mine leases.
The figures given in the third and fourth rows of Table VII appear in rows 31 and 32 of Table VIII. Added to the gold resource never extracted by the Witwatersrand mines, they amount to 48 100 ± 9 000 t known gold that might be extractable from within existing mine leases and between mine leases (row 35, Table VIII).
Discussion and conclusion
The known extractable gold resource in the Witwatersrand Basin based on data up to 2005 has been estimated as 98 300 ± 8 900 t, of which 50 200 ± 1 200 t had been extracted to 2019, leaving 48 100 ± 9 000 t to be extracted. Since 2006, a further estimated amount of 2 340 ± 234 t has been mined, and this has already been accounted for in Table VIII and the figures above by subtracting it from the non-SAMREC resources listed by the Witwatersrand mining and exploration companies in 1999 (Handley 2000). Gold losses for the period 2006 - 2019 have not been computed, but are automatically included in the gold not extracted from the Witwatersrand Basin. The remaining gold, amounting to 48 100 ± 9 000 t, consists of the following:
> 1 600 ± 600 t in surface tailings impoundments up to 2005
> 5 500 ± 600 t lost underground and on the surface during mining and ore transportation to 2005
> 10 300 ± 5 500 t left underground in pillars and remnants up to 2005
> 11 000 ± 1 700 t in mining leases at the end of 2019
> 19 700 ± 3 900 t identified by pre-SAMREC (2016) exploration outside mining leases and between mining leases in the Witwatersrand Basin up to 2019.
The gold remaining in mine leases in 2019 automatically includes gold sent to tailings impoundments, gold lost during the mining and transportation process, and gold left underground in pillars and remnants in the years 2006-2019. It is assumed that none of the gold between mine leases was mined in the years 2006-2019.
A significant amount of the gold remaining in mine leases -approximately 30% of 11 000 t, or 3 300 t - will not be accessible to economic extraction using the current labour-intensive mining methods because most of it is relatively deep. The surface tailings impoundments are likely to release about 60% of their gold using modern metallurgical extraction techniques; DRDGold has already launched several projects to extract some of this gold. Currently, Witwatersrand mines and dump reprocessing operations could be expected to yield a further 8 000 t gold, leaving about 40 000 t underground in pillars, remnants, and outside the current mining leases. The effect of the current illegal extraction of gold from existing and defunct mines is unknown and has been ignored. Informal mining could access and extract a significant fraction of the gold in pillars, gold lost during mining and transport, and the lost portion of the remaining resources identified on current mining leases, amounting to approximately 16 400 t. This is made up of 15 800 t left in mines to 2005 (see rows 11 and 25 in Table VIII). It is assumed that tailings impoundments are too low in grade to be effectively exploited by informal mining techniques. An approximate further 600 t has been left underground during mining in the years 2006-2019 (25% of 2 300 t, see row 28, Table VIII). The illegal miners have at least recognized the size of the prize to be won, and are working hard at making a living mining gold in whichever Witwatersrand mines they have been able to enter.
The remaining gold outside mining leases and between goldfields is unlikely to be exploited because of the risks involved. The resource within leases is accessible by current means if a total loss of approximately 30% is acceptable. This will not change appreciably unless the industry adopts a new approach to mining. With further research aimed at achieving the 11 goals outlined below, all the remaining gold could fall within reach of the RPEEE principle of the SAMREC Code (2009, 2016):
> Much lower mining costs (10-25% of current costs)
> Much lower mining losses (3% of the gold content)
> Much lower capital costs (25% of current capital)
> Mining methods that are less vulnerable to gold theft
> Mining methods with low, and controllable, environmental impact
> Communities affected by mining enjoying benefits that far outweigh the disadvantages
> No lasting scars on the surface such as pits and dumps
> No expensive or long periods of research and development
> Mining or extraction methods that are adaptable to the gold left underground in closed mines, existing mines, and in the known resources between goldfields
> Methods flexible enough to cope with complex geological structures, depth, and heat
> Safe and seismicity-free mining to 10 km below the surface.
It is obvious that all surface and underground mining methods used to date fall far short in nearly every attribute described. A completely new approach is needed; this is a challenge for the South African mining industry to take the lead again. Rita Mae Brown is credited with saying through the fictional character Jane Fulton: Insanity is doing the same thing over and over again, but expecting different results (Brown, 1983). We have to think again. Further economic extraction of gold from the Witwatersrand Basin must use an approach different from the labour-intensive methods that have prevailed to date.
References
A. Goerz and Company, Limited, 1905. Map of the Witwatersrand Goldfields. (Detailed fold-out map of Central Rand gold mining interests drawn to a scale of 1 inch to 500 Cape Roods). Johannesburg. [ Links ]
Anglo American Corporation of South Africa Limited. 1985. Free State Geduld Mines Limited Annual Report, Johannesburg. [ Links ]
Anglogold. 1996. Freegold 49th Annual Report December 1996. Johannesburg. [ Links ]
Anglogold Ashanti. 1998. Annual Report Supplementary Statistics, 1998. Johannesburg. [ Links ]
Bosch, D.W. 1987. Retreatment of residues and waste rock. Extractive Metallurgy of Gold. Stanley G.G. (ed.). South African Institute of Mining and Metallurgy, Johannesburg. pp. 707-743. [ Links ]
Brown, R.M. 1983. Sudden Death. Bantam, New York. p. 68. [ Links ]
Chamber of Mines of South Africa. 1990. One Hundredth Annual Report 1989. Johannesburg. [ Links ]
Chamber of Mines of South Africa. 1991-2000. Statistical Tables. Johannesburg. [ Links ]
Chamber of Mines of South Africa. 2009. Facts and Figures 2008. Johannesburg. [ Links ]
Chamber of Mines of South Africa. 2010. Facts and Figures 2010. Johannesburg. [ Links ]
Chamber of Mines of South Africa. 2013. Facts and Figures 2012. Johannesburg. [ Links ]
Chamber of Mines of South Africa/ 2017. Facts and Figures 2016. Johannesburg. [ Links ]
Chapman, K.M., Tucker, R.F., and Kidger, R.J. 1986. The Klerksdorp Goldfield. Witwatersrand Gold - 100 Years. Antrobus, E.S.A. (ed.). Geological Society of South Africa, Johannesburg. [ Links ]
Cleverly, A.J. 1927. The South Africa map of the Witwatersrand Gold Fields showing the controls of the chief mining houses. [Undated fold-out map published by the Offices of South Africa, London. Date estimated from the fact that the listings of the mines on the map give dividends for 1926]. [ Links ]
Conradie, A.S. 2000. Gold. South Africa's Mineral Industry 1998-1999. In: Department of Minerals and Energy, Pretoria. pp. 31-37. [ Links ]
Conradie, A.S. 2001a. Gold. South Africa's Mineral Industry 1999-2000. Department of Minerals and Energy, Pretoria. pp. 27-31. [ Links ]
Conradie, A.S. 2001b. Gold. South Africa's Mineral Industry 2000-2001. Department of Minerals and Energy, Pretoria. pp.30-33. [ Links ]
Conradie, A.S. (2003. Gold. South Africa's Mineral Industry 2002-2003. Department of Minerals and Energy, Pretoria. pp. 30-34. [ Links ]
Conradie, A.S. 2004. Gold. South Africa's Mineral Industry 2003-2004. Department of Minerals and Energy, Pretoria. pp. 39-44. [ Links ]
Conradie, A.S. 2005. Gold. South Africa's Mineral Industry 2004-2005. Department of Minerals and Energy, Pretoria. pp. 30-33. [ Links ]
Conradie, A.S. 2006. Gold. South Africa's Mineral Industry 2005-2006. Department of Minerals and Energy, Pretoria. pp. 29-32. [ Links ]
De Jager, E.J. 1997. The analysis of the mine call factor in gold mining, with specific reference to Western Holdings Mine. PhD thesis, Faculty of Engineering, University of the Witwatersrand, Johannesburg. [ Links ]
Duncan, A.J. 1979. Quality Control and Industrial Statistics. 4th edn. R.D. Irwin, Homewood, IL.1047 pp. [ Links ]
Faulkner, K.K. and Edmond, J.M. 1990. Gold in seawater. Earth and Planetary Science Letters, vol. 98, no. 2, May 1990. pp. 208-221. [ Links ]
Fourie, A. and Mlnnitt, R.C.A. 2016. Review of gold reef sampling and its impact on the mine call factor. Journal of the Southern African Institute of Mining and Metallurgy, vol. 116, no. 11. pp. 1001-1009. [ Links ]
Gastrow, P. 2001. Theft from South African mines and refineries: The illicit market in gold and platinum. Institute of Security Studies, Cape Town. [ Links ]
Gillan, R. 1990. Winkelhaak Mines Limited Mine Valuation. Frankel, Kruger, Vinderine Incorporated, Johannesburg. February 1990. [ Links ]
Gold Fields of South Africa, Limited. 1984. Driefontein Consolidated Limited Annual Report, 1984. Johannesburg. [ Links ]
Gold Fields of South Africa, Limited. 1992. Map of the West Wits Line. Johannesburg. [1:100 000 scale surface map of the mines of the Carletonville Goldfield showing local towns, topography, and mining leases as they were in 1992]. [ Links ]
Google Earth. 2014. Southern Africa centered approximately on 27°S, 24°E, eye altitude 3000 km. SIO, NOAA, US Navy, NGA, GEBCO, © 2014 AfricaGIS (Pty) Ltd, US Dept. of State Geographer. 15 October 2014. [ Links ]
Hammerbeck, E.C. 1986. New geological map of Southern Africa. Mineral Deposits of Southern Africa Vol. II. Anhaeusser, C.R. and Maske, S. (eds.). Geological Society of South Africa, Johannesburg. pp. 2323-2324. [ Links ]
Handley, J.R.F. 2000. World gold resources - A global view in space and time. PhD thesis, University of the Witwatersrand, Johannesburg. [ Links ]
Handley, J.R.F. 2004. Historic Overview of the Witwatersrand Goldfields. Published by the author 224 pp. [ Links ]
Hayward, C.L., Reimold, W.U., Gibson, R.L., and Robb, L.J. 2005. Gold mineralization within the Witwatersrand Basin, South Africa: Evidence for a modified placer origin, and the role of the Vredefort impact event. Mineral Deposits and Earth Evolution. McDonald, I., Boyce, A.J., Butler, I.B., Herrington, R.J.. and Polya, D.A. (eds.). Special Publications 248. The Geological Society, London. pp. 31-58. [ Links ]
Janse van Rensburg, S. 2016.): Guidelines for retreatment of SA gold tailings: Mintek's learnings. Proceedings of the 23rd WasteCon Conference, Emperor's Palace, Johannesburg, 17-21 October 2016. Internationa; Solid Waste Association, Rotterdam. pp. 367-376. [ Links ]
Jeppe, C.B. 1946. Gold Mining on the Witwatersrand Volumes I and II. Transvaal Chamber of Mines, Johannesburg. pp. 48-49. [ Links ]
Lang, J. 1986. Bullion Johannesburg. Jonathan Ball, Johannesburg. 509 pp. [ Links ]
Lock, N. 2020. RPEEE (Reasonable Prospects for Eventual Economic Extraction): The critical core to the SAMREC Code. Journal of the Southern African Institute of Mining and Metallurgy, vol. 120, no. 9. pp. 497-504. [ Links ]
Lourens, J.P. 1998. Gold. South Africa's Mineral Industry 1997-1998. Department of Minerals and Energy, Pretoria. pp. 26-33. [ Links ]
McCarthy, T.S. 2006. The Witwatersrand Supergroup. The Geology of South Africa. Johnson, M.R., Anhaeusser, C.R., and Thomas, R.J. (eds). Geological Society of South Africa, Johannesburg and Council for Geoscience, Pretoria. pp. 155-186. [ Links ]
Meirlng, P. 1963. Goud vir die Soeker. Tafelberg, Cape Town. 143 pp. [ Links ]
Minerals Council South Africa. 2019. Illegal mining fact sheet. Johannesburg. [ Links ]
Minter, W.E.L., Hill, W.C.N., Kidger, R.J., Kingsley, C.S., and Snowden, P.A. 1986. The Welkom Goldfield. Mineral Deposits of Southern Africa Vol. I. Anhaeusser, C.R. and Maske, S. (eds) Geological Society of South Africa, Johannesburg. pp. 497-539. [ Links ]
Mooney, W.D., Laske, G., and Masters, T.G. 1998. CRUST 5.1: A global crustal model at 50 χ 50. Journal of Geophysical Research, vol. 103 B1. pp.722-747. [ Links ]
Pogue, T.E. 2008. Missed opportunities? A case study from the South African mining sector. Resource Intensity, Knowledge and Development. Human Sciences Research Council, Pretoria. Chapter 5, pp. 179-213. [ Links ]
Pretorius, D.A. 1986. The compilation of the map of the Witwatersrand Basin. Mineral Deposits of Southern Africa, Vol. 1. Annhaeusser, C.R., and Maske, S. (eds). Geological Society of South Africa, Johannesburg. pp.1019-1020. [ Links ]
Reimold, W.U. 2006. Impact structures in South Africa. The Geology of South Africa. Johnson, M.R., Anhaeusser, C.R., and Thomas, R.J. (eds). Geological Society of South Africa, Johannesburg and Council for Geoscience, Pretoria. pp. 629-649. [ Links ]
Robb, L.J. and Meyer, F.M. 1995. The Witwatersrand Basin, South Africa: Geological framework, and mineralization processes. Ore Geology Reviews, vol. 10. pp. 167-194. [ Links ]
SAMREC. 2009. South African Mineral Resource Committee. The South African Code for Reporting of Exploration Results, Mineral Resources and Mineral Reserves (the SAMREC Code). 2007 Edition as amended July 2009. http://www.samcode.co.za/downloads/SAMREC2009.pdf [ Links ]
SAMREC. 2016. South African Mineral Resource Committee. The South African Code for the Reporting of Exploration Results, Mineral Resources and Mineral Reserves (the SAMREC Code. 2016 Edition. http://www.samcode.co.za/codes/category/8-reporting-codes?download=120:samrec [ Links ]
Sauer, H. 1934. The Witwatersrand Goldfield - A Vital Asset of the British Empire. Financial Times, London. [ Links ]
Taylor, J.R. (1997. An Introduction to Error Analysis. 2nd edn. University Science Books, Sausalito, CA. 327 pp. [ Links ]
Tucker, R.F., Viljoen, R.P., and Viljoen, M.J. 2016. A review of the Witwatersrand Basin - The world's greatest goldfield. Episodes, vol. 39, no.2. pp. 105-133. [ Links ]
USGS. 2022. Mineral Commodity summaries 2021. https://pubs.usgs.gov/periodicals/mcs2021/mcs2021.pdf [ Links ]
World Gold Council 2022. Global Mine Production. www.gold.org/goldhub/data/historical-mine-production [ Links ]
 Correspondence:
M. Handley
Email: handley@icon.co.za
Received: 12 Nov. 2021
Revised: 7 Nov. 2022
Accepted: 19 Apr. 2023
Published: April 2023
Appendix
Statistics for very small samples (after Duncan, 1979)
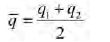
If one has two quantities (two independent measurements in an experiment, for example) which are disparate and differ by an independently random amount, then the best estimate of the measured quantity is the arithmetic mean of the two quantities. The best estimate of the dispersion, hence an indication of the error of the measurements, is the standard deviation. For a sample containing only two measurements the arithmetic mean remains an unbiased estimator, while the standard deviation, even if Bessel's n/ (n-1) correction has been applied, is still biased. In normal practice, samples contain many more than two data points, so this bias disappears.
The arithmetic mean for a sample containing two data points is given by:
The standard deviation with Bessel's correction for an n = 2 sample is given by:
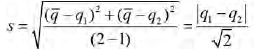
The standard deviation for a two-data sample is underestimated by about 20%, so it must be corrected by a variable known in industrial quality control as c4, and is given by:
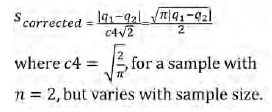
The means to calculate c4 can be found in Duncan (1979) or on the internet. Applying c4 to the standard deviation makes it an unbiased estimator of the population variance, provided that the sample is random and the population is normally distributed. It is reasonable to assume that the cumulative mine production statistics contain many random errors in the form of omissions, incorrectly recorded statistics, double-counting, and so on. Furthermore, the compiled statistics are sums of multiple mines' production over their lifetimes, or the sum of all producing mines' production per annum over a number of years. Both of these statistics, if computed again and again, will behave in exactly the same way as the sampling distribution of means and will, by the central limit theorem, be normally distributed. When comparing two cumulative mine production figures computed different ways, r is used to estimate an expected normalized residual expressed as a percentage:
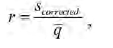
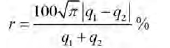
so that the expected normalized residual expressed as a percentage is
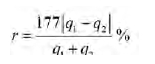
The above formula was simplified for the calculations of residuals in Table II by the following approximation:
This can be treated as a standard error for the population of normally distributed cumulative mine production statistics, and is used as a means to provide an unbiased estimate of the expected error in the published statistics.
Guidelines for computing uncertainties in error analysis (after Taylor, 1997)
When several quantities x, y, z, ... w are measured with small uncertainties δx, δy, δz,.....δw, and the measured values are used to calculate another quantity q, then the uncertainty in q will depend on the uncertainties in x, y, z,.....w as described below, if and only if the uncertainties δx, δy, δz,.....δw are both random, and independent of each other.
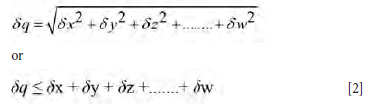
If q is a sum of two or more variables, i.e. q = x + y + z +... + w, then uncertainties add in quadrature.
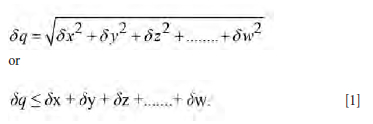
If q is the difference of two or more variables, i.e. q = x - y - z -... - w, then the uncertainties add in quadrature.
If q is a product or quotient of several variables, i.e.
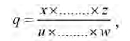
then the fractional uncertainties add in quadrature
The uncertainties are expressed as positive quantities, and the sum in quadrature is always less than or equal to the sum of the uncertainties expressed as positive fractions. The above equations are used to determine all the uncertainties in Table VIII.
Table VIII is repeated in Table A1 in figures similar to the way the mines reported them. The author notes here that all of the figures except those in rows 1-3 are estimates from sparse data, and are not scientifically acceptable as estimates in the form reported. They are repeated here in their raw form so that the reader can follow the author's calculations as they were done in a spreadsheet. The rounded estimates made to three significant figures with their uncertainties reported in Table VIII above are more acceptable.


