


Services on Demand
Article
 English (pdf)
 Article in xml format
 Article references
Indicators

Related links
-
 Cited by Google
 -
 Similars in Google
Share

 Permalink
Journal of the Southern African Institute of Mining and Metallurgy
On-line version ISSN 2411-9717
Print version ISSN 2225-6253
J. S. Afr. Inst. Min. Metall. vol.123 n.3 Johannesburg Mar. 2023
http://dx.doi.org/10.17159/2411-9717/1714/2023
PROFESSIONAL TECHNICAL AND SCIENTIFIC PAPERS
Effect of mineralogy on grindability - A case study of copper ores
T. Nghipulile; T.E. Moongo; G. Dzinomwa; K. Maweja; B. Mapani; J. Kurasha; M. Amwaama
Department of Mining and Process Engineering, Namibia University of Science and Technology, Windhoek, Namibia. ORCID - T. Nghipulile: http://orcid.org/0000-0003-4399-2620; T.E. Moongo: http://orcid.org/0000-0002-2465-0409; G. Dzinomwa: http://orcid.org/0000-0001-8763-699X; K. Maweja: http://orcid.org/0000-0003-0989-2132; B. Mapani: http://orcid.org/0000-0002-5354-3397; J. Kurasha: http://orcid.org/0000-0002-7213-7669; M. Amwaama: http://orcid.org/0000-0003-1937-585X
SYNOPSIS
The effect of mineralogy on the grindability was investigated using three copper ores - two sulphides and one oxide. The dominant copper minerals were identified by optical microscopy and mineral chemistry derived from SEM-EDS analysis. The sample designated sulphide 1 was bornite-rich, sulphide 2 ore was mainly chalcopyrite, and the oxide ore was predominantly malachite and minor azurite. The gangue minerals were identified using semi-qualitative XRD analysis. Sulphide 1 contained more than 80% (w/w) of quartz compared to about 70% in the other two ores. The Bond work indices were 13.8, 21.6, and 17.3 kWh/t for sulphide 1, sulphide 2, and oxide ore respectively. This suggested that the chalcopyrite-rich ore is the hardest, while the malachite-rich ore has intermediate hardness, and the bornite-rich ore is the softest. The brittleness indices of the ores were calculated using the chemical composition of the gangue, and a good correlation between brittleness indices and Bond work indices was observed, which highlights the importance of the gangue composition in determining the fracture behaviour of the ores. There is scope for further investigation into the relationship between ore mineralogy and comminution behaviour using other breakage characterization techniques.
Keywords: mineralogy, grindability, work index, relative work index, brittleness index, relative toughness index.
Introduction
Process mineralogy is concerned with the practical application of mineralogical knowledge of ores to guide the development and/or optimization of process flow sheets (Baum, 2014; Bradshaw, 2014; Henley, 1983; Lotter et al., 2018; Whiteman, Lotter, and Amos, 2016). Ores are characterized by inhomogeneities such as flaws, joints, voids', and a variety of minerals dispersed as grains of various sizes with differing interrelationships with one another, i.e. texture (Chen, Xu, and Li, 2018; Estay and Chiang, 2013; Fan et al., 2018; Hamdi, Stread, and Elmo, 2015; King, 2012; Zhao and Zhang, 2020; Zhou et al., 2015). These discontinuities influence the hardness and fracture toughness of rocks and, in turn, their fracture behaviour (Gutierrez and Youn, 2015), serving as stress risers where both crack initiation and propagation begin (Chen, Xu, and Li, 2018; Griffith, 1920; Zhao et al., 2016).

Mineralogical information is obtained from optical microscopy (mineral texture, mineral identification), scanning electron microscopy (SEM) (morphological characteristics), quantitative evaluation of materials by scanning electron microscopy (QEMSCAN) (degree of liberation of valuable minerals), mineral liberation analyser (MLA) (liberation data), and X-ray diffraction (XRD) (phase identification) (Anticoi et al., 2018; Baum, 2014; Masindi, Foteinis, and Chatzisymeon, 2022; Shi and Zuo, 2014; Sipunga, 2015; Ye, Tang, and Xi, 2020; Liu et al., 2017; Mariano, 2016; Palm et al., 2010; Reichert et al., 2015; Solomon et al., 2011; Xiao et al., 2012). In comminution, the mineralogical data can be related to the grindability parameters (e.g., Bond work index) in order to develop the relationship between the ore mineralogy and grindability. The Bond work index (Wi) is the ore hardness parameter which represents the resistance to crushing or milling (Wills and Finch, 2016) and it is used to design comminution machines such as crushers and mills (Ipek and Goktepe, 2011; Jauregui, 1982; Todorovic et al., 2017). Equation [1] denotes the energy required to reduce the parent particle size to the target progeny size. Additionally, Wi can serve as an input parameter for a geometallurgical model which predicts the grinding efficiency in the milling circuits (Mine, 2017; Mwanga, 2016).
where Wi is the Bond work index in kWh/t, and F80 and P80 are the 80% passing sizes (in µm) for the feed and product respectively.
The influence of ore texture has long been recognized as a critical factor in mineral processing (Bradshaw, 2014; Ghanei, 2020; Mine, 2017; Mwanga et al., 2014; Schouwstra and Smit, 2011). For example, Mine (2017) developed the relationship between grindability and mineralogical data for the Aitik copper mine in Sweden. Ghanei (2020) investigated the relationship between ore texture and grindability in a variety of iron ores. Their work ignited the interest of the authors of this study to advance the understanding of the relationship between ore mineralogy and grindability using a copper deposit that contains multiple mineralized zones as a case study.
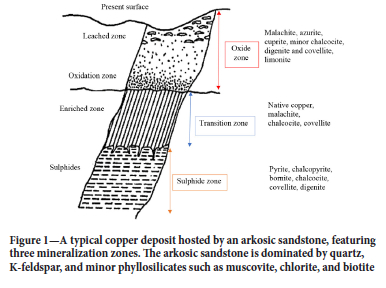
The deposit studied is located in the Pan African Damara Orogen, on the Northern Carbonate Platform section within the Mulden Group in the Otavi Mountainland, northern Namibia. The mineralization is hosted by arkosic sandstone with minor calcite (CaCO3) and dolomite (CaMg(CO3)2). The deposit contains three mineralized zones (Kamona and Günzel, 2007). The uppermost zone consists of copper oxides, hydroxides, and carbonates. This is followed by a transition (mixed) zone and then the lowermost sulphide zone as shown in Figure 1. Copper mineralization in the oxide zone, from near the surface to about 70 m depth, is mainly composed of malachite (Cu2CO3(OH)2), azurite (Cu3(CO3)2(OH)2), and cuprite (Cu2O), with minor chalcocite (Cu2S), digenite (Cu1-sS), and covellite (CuS). The transition zone contains a combination of oxides (predominantly malachite) and sulphides (predominantly chalcocite, and bornite, with covellite (CuS) in minor quantities). The sulphide zone contains very fine intergranular disseminated grains of primary copper sulphide minerals (chalcopyrite (CuFeS2) and bornite (Cu5FeS4)) and secondary copper sulphides such as chalcocite (Cu2S), covellite (CuS), and digenite (Cu1-sS).
Experimental
Three copper ore samples, designated sulphide 1, sulphide 2, and oxide, were obtained from the mine. About 200 kg of each ore type was homogenized using the coning and quartering method to obtain a representative sample weighing approximately 50 kg. The 50 kg samples were stage crushed to 100% passing 3350 µm (a suitable feed size for the laboratory ball mill) using a laboratory jaw crusher. The crushed 50 kg samples were rotary split to prepare 1 kg aliquots for the grindability experiments.
Elemental compositions of representative samples of the crushed feeds were determined using a bench-top X-ray fluorescence (XRF) instrument, model NEX CG supplied by Applied Rigaku Technologies from Austin, Texas, USA. This instrument uses a built-in calibration procedure referred to as the multi-channel analyser (MCA) calibration software. A representative sample was dry screened over 2360, 1700, 1180, 850, 600, 425, 300, 212, 150, 106,- and 75 µm aperture sieves to obtain the size distribution. After sieving, the size-by-size samples (-75, -300+75 and +300 µm) were prepared for chemical analysis by XRF, as well as for mineralogical examination with optical microscopy, X-ray diffractometry (XRD), and scanning electron microscopy (SEM). The samples for optical microscopy and SEM analysis were mounted in hot resin and then polished on Kemet waterproof silicon carbide grit papers using a 1 µm Kemet diamond slurry to obtain a reflecting surface. In preparation for SEM analysis, the samples were lightly carbon-coated using the Quorum Q150T sputter coater (Advancedlab, Switzerland). SEM analysis was conducted using a JEOL JSM-IT300 scanning electron microscope coupled with the Thermo Scientific NS7 EDS software (Advancedlab, Switzerland). Analyses were done in high vacuum in the backscattered mode at an acceleration voltage of 15 kV, a probe current of 50 nA, and a working distance of 15 mm. The size-by-size samples were observed in both reflection and transmission modes for phase identification using an Olympus BX51 optical microscope. Sub-samples of the size-by-size samples were pulverized for semi-quantitative analysis of the gangue phases using a Bruker D8 Advance XRD instrument. The instrument uses the Diffracplus package with XRD Wizard version 2.9.0.22 for sample information entry, XDR Commander version 2.6.1.0 to run the samples, and EVA version 16.0.0.0 for data evaluation. The samples were run with a step size of 0.02 degrees 20 with a counting time of 1 second per step.
The Bond work indices (Wi) were experimentally determined following the Bond ball mill standard procedures outlined in Gupta and Yan (2006, pp. 73-75). For each sample type, size analysis was performed on the mill feed (100% passing 3.35 mm material) to determine the 80% passing size and percent passing the test sieve (106 µm). Following the iterative process of screening the mill discharge over the test sieve until three consecutive consistent readings for the undersize weight per revolution are obtained, the work index (in kWh/t) was then calculated using Equation [2]).
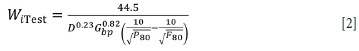
where D is the test sieve aperture 106 µm), and Gbp is the constant representing the net mass (in grams) of undersize product per revolution.
Milling experiments were conducted with 1 kg samples which were milled for 5, 10, 15, and 20 minutes using a laboratory ball mill with both the internal diameter and length equal to 305 mm. The milling conditions are listed in Table I. The slurry density was kept constant at 65% solids in all tests. The mill products were wet-screened using a root two series of sieves between 300 and 75 µm, dried at 105°C for 4 hours, and the size distributions generated for all three copper ores.
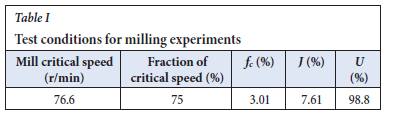
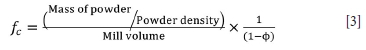
The powder filling (fc), ball filling (J), and fraction of space (voids) between the balls, denoted as U, were calculated, and kept constant during the experiments as indicated in Table I. The powder filling (fc) is the volume of the charged material expressed as a fraction of the mill volume and is calculated using Equation [3]. The porosity of the bed (Φ) is theoretically equal to 40% with a bulk density of 4.65 g/cm3 for steel balls (Austin, Klimpel, and Luckie, 1984).
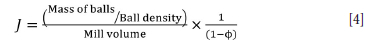
The ball filling (J), which defines the volume of balls at rest expressed as a fraction of the mill volume, is calculated using Equation [4].
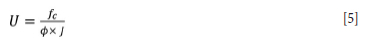
The fraction of voids between the balls at rest is calculated using Equation [5], which relates fc and J. An interstitial void volume (U) closer or equal to 100% is desired in the mill as it ensures efficient ball loading (Kiangi, 2011; Mulenga and Moys, 2014).
Results and discussion
Chemical analysis of the copper ores
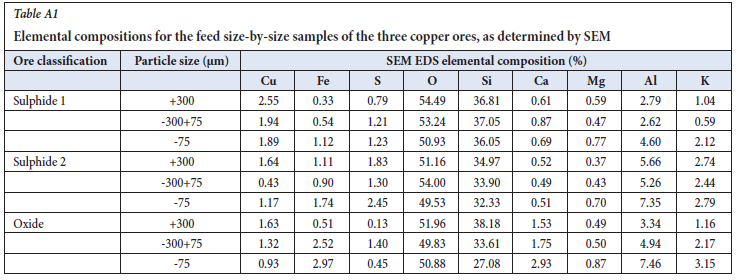
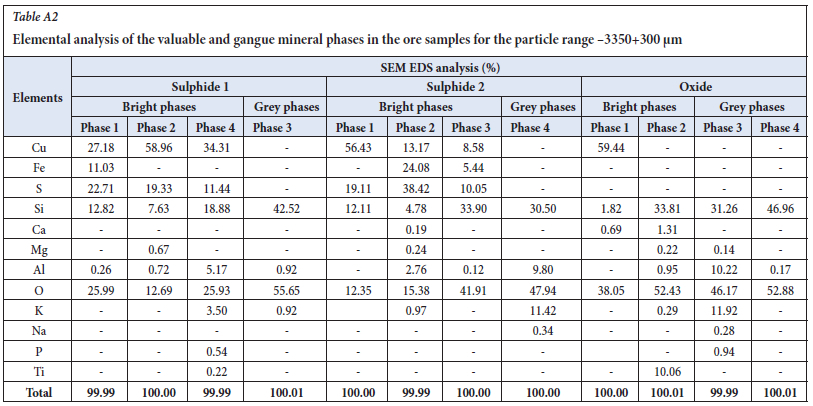
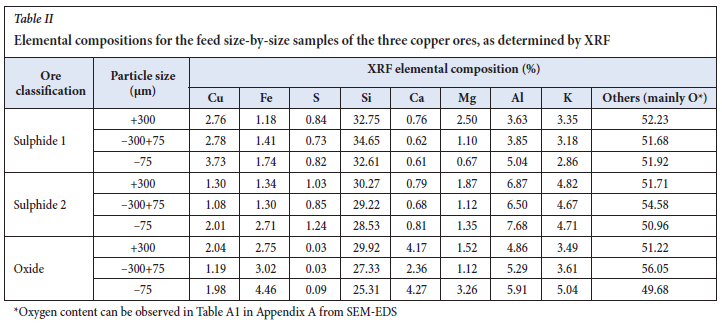
The XRF elemental compositions for the bulk homogenized samples of the three copper ores are shown in Table II. As a way of validating the XRF assays, SEM-EDS was used to confirm the mineral phases and results are listed in Table A1 in Appendix A. The major difference for the metal values contained in the ores arises from the S and Ca contents. In general, the elemental compositions show that the two sulphide ores have a lower Ca grade and a higher S grade compared to the oxide ore. As already mentioned, the Ca and Mg are contained in the calcite (CaCO3) and dolomite (CaMg(CO3)2) which are minor gangue minerals. Si, K, and Al are contained in the abundant gangue minerals, i.e. quartz (SiO2), K-feldspar (KAlSi3O8), and muscovite (KAl2Alsi3O11), which were identified using XRD (see Table III).
Mineralogical characterization
Semi-qualitative analysis of the main gangue minerals
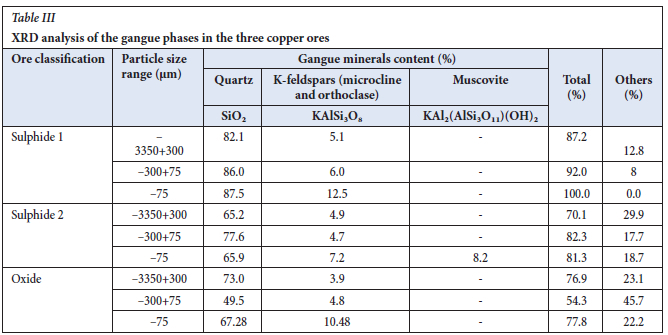
Table III shows the semi-quantitative XRD results for the gangue minerals. The contents of copper minerals as well as iron sulphide minerals such as pyrite were below the detection limit for XRD, although they were detected by optical microscopy (see the following section). Considering the average composition, sulphide 1 contains 85% (w/w) quartz and 8% K-feldspars. Sulphide 2 constitutes 70% quartz, 8% K-feldspars, and 8% muscovite. The oxide ore contains 70% quartz (disregarding the -300+75µm fraction) and 7% K-feldspar minerals. Analysis of gangue minerals is essential because, as discussed later, the grindability of the ore is mainly dependent on gangue composition, gangue being the main constituent of the ore.
Optical mineralogy
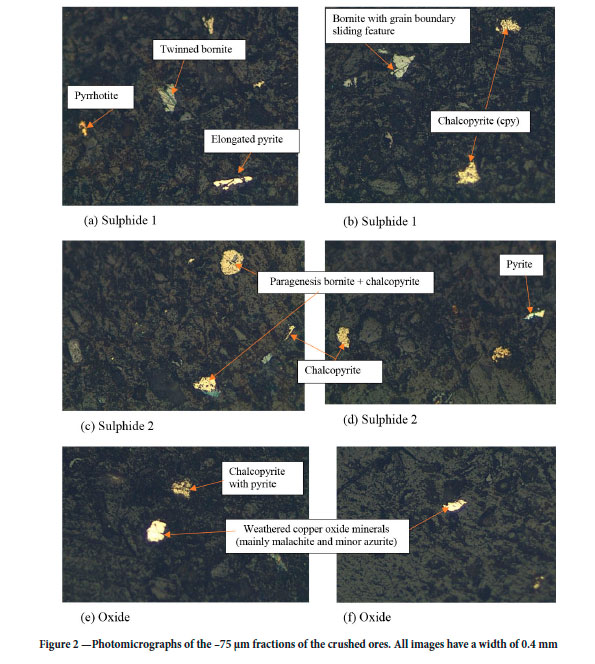
The ore samples were not collected in situ but were received after having been pre-crushed. As such, their original textures were not easy to reconstruct. This section details the mineralogical assemblages in the crushed ores. Bornite particles (Figure 2a) exhibit deformational twinning; pyrite is elongated and fractured.
These features are associated with the comminution process. Pyrrhotite, a rare phase in these ores, occurs as small 0.05 mm grains (Figure 2a). Bornite, unlike chalcopyrite, exhibits the additional feature of grain-boundary sliding (Figure 2b). The association bornite+chalcopyrite+pyrite is the most common assemblage. Individual grains of chalcopyrite (cpy) and bornite are also present. In Figures 2d, 2e, and 2f a close association of chalcopyrite and pyrite with oxide phases, mainly malachite and minor azurite, can be observed. Based on the optical microscopy results, sulphide 1 has bornite as the dominant copper mineral, sulphide 2 is predominately chalcopyrite, and the oxide ore is mainly made up of malachite.
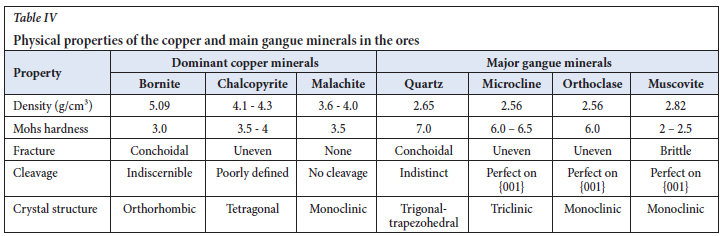
The physical properties of the main copper and gangue minerals in the ores are listed in Table IV. As regards the copper minerals, bornite is softer than chalcopyrite and malachite. Among the gangue minerals, quartz (the dominant phase, see Table III) is harder than the K-feldspar minerals (microcline and orthoclase). The phyllosilicate mineral muscovite is the softest of the main gangue minerals in the ores. The grindability of the ore is mainly affected by their main constituent (gangue minerals), as shown by the relationship between the gangue mineral composition and Bond work indices, which is discussed later.
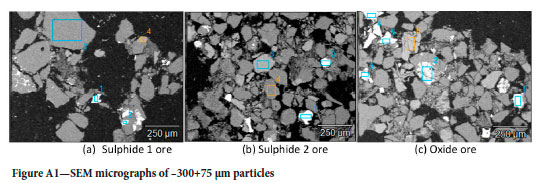
Scanning electron microscopy
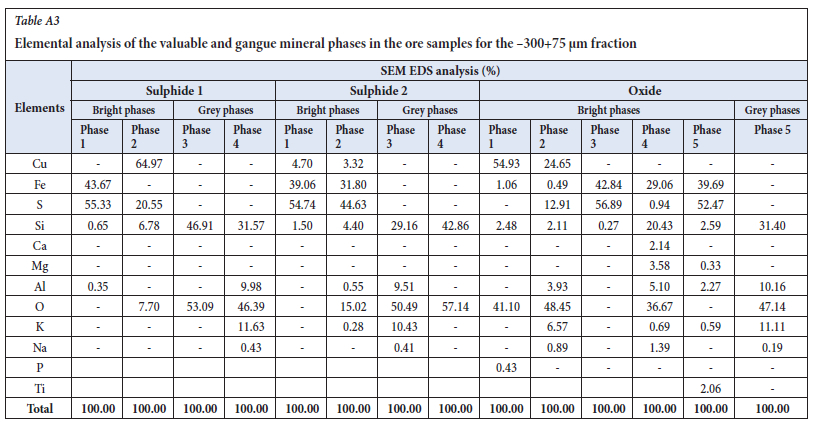
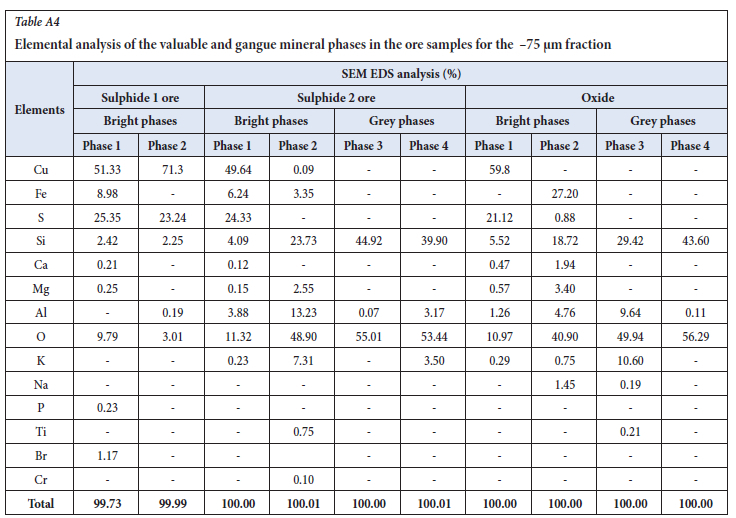
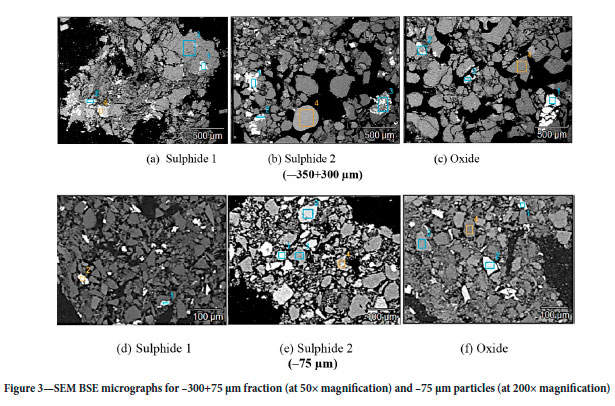
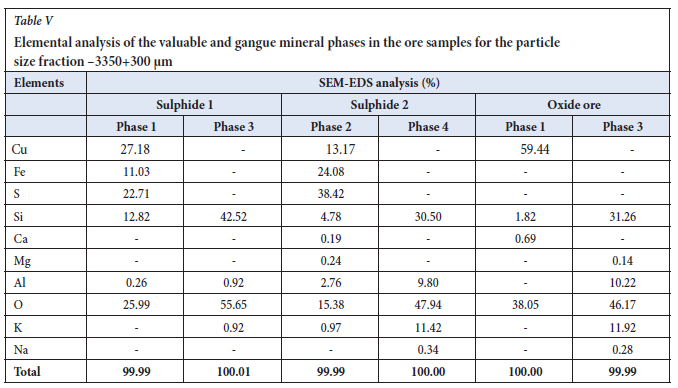
SEM-EDS analysis was done on the three size fractions (-3350+300, -300+75, and -75 µm) to confirm the mineral phases in the ores. Due to similar observations for the three size fractions, only the backscattered electron (BSE) micrographs of the coarser (-3350+300 µm) and fine (-75 µm) size fractions are shown in Figure 3. Micrographs of the mid-size fraction are included in Appendix A, which also lists the SEM-EDS analyses of all the selected phases. In Figure 3, various phases can be seen. The heavy minerals appear as bright grains and the light (gangue) minerals dark. Table V lists the SEM-EDS analyses of some of the phases. The dominant elements in the heavy mineral phases are Cu, Fe, and S, which suggests sulphide minerals such as bornite, chalcopyrite, and pyrite. Cu and O are the dominant elements for the heavy mineral phase in the oxide ore, which indicates minerals such as malachite and azurite. The grey (abundant) phase is mainly composed of Si, Al, and K, which confirms the XRD results which indicated that quartz and feldspar are the dominant gangue minerals in the ores.
Grindability as a function of ore mineralogy
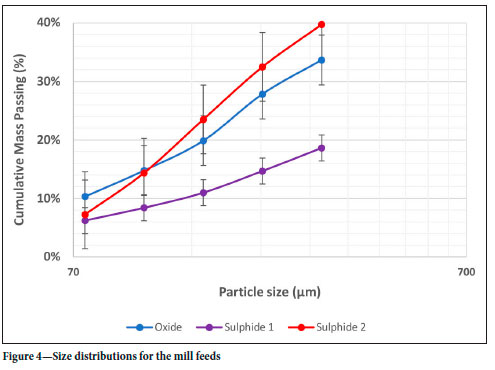
Size distribution of the feed
The size distributions for the jaw crusher products are shown in Figure 4. These samples were the feeds for the Bond ball mill work index tests which require the feed to be -3.35 mm. While the oxide (malachite) and sulphide 2 (chalcopyrite) ores had comparable size distributions, the sulphide 1 ore (bornite) was coarser. The effect of the discrepancies in the size distributions of the three ores on the analysis of results was eliminated through normalization of the experimental results (see Figures 5 and 6). The size analysis was done in duplicate for each ore.
Bond work index, brittleness, and toughness
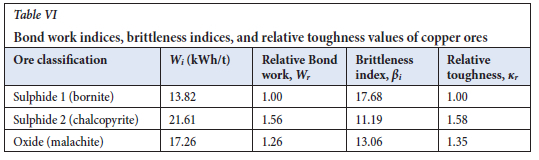
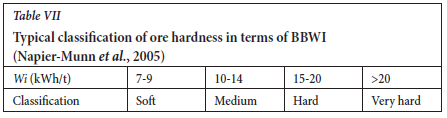
The Bond work indices (Wi) for the three ores are listed in Table VI. Based on the standard classification of ore hardness in Table VII, sulphide 1 is of 'medium' hardness, the oxide ore is 'hard', and sulphide 2 is 'very hard'. The relative work indices (Wr) were also calculated with respect to to the ore with the lowest work index (i.e., work index of the ore divided by the work index of sulphide 1). The distribution of the copper mineral grains (bornite, chalcopyrite, malachite, and azurite) within the host rocks introduces structural defects which serve as sites for crack initiation and propagation upon the application of an external load on the particles during comminution (Charikinya, Bradshaw, and Becker, 2015; Chen, Xu, and Li, 2018; Fan et al., 2018; Germanovich et al., 1994; Ghorbani et al., 2013; Griffith, 1920; Shi, Zuo, and Manlapig, 2013; Viljoen et al., 2015; Zhao et al., 2016). The difference in the Wi values for the three copper ores can thus be attributed to mineral texture. However, the elemental compositions (Table II) indicate that the contents of copper minerals such as bornite, chalcopyrite and malachite in the three ores are below 7% (w/w) and their volume fractions are lower than 4% (v/v). Therefore, the Bond work indices of the ores are mainly dependent on the fracturing behaviour of the gangue (abundant) minerals (Buntoro et al., 2018). The lowest W', for sulphide 1, could be attributed to the conchoidal fracturing of quartz (see Table IV), since this ore has the highest quartz content Table III). Based on Mohs scale of hardness, quartz is the hardest of all the minerals identified in the ores. Kim et al. (2022) reported that hardness and brittleness are positively correlated with quartz content. The XRD results in Table III, considering the -75 and -3350+300 µm size fractions (the results for the -300+75 µm fraction were disregarded because of the anomaly observed in the quartz content for the oxide ore) showed that sulphide 1, sulphide 2, and oxide contained 85%, 66%, and 70% (w/w) quartz respectively. It can be inferred that the brittleness is highest in sulphide 1, intermediate in the oxide ore, and lowest in sulphide 2. The trend agrees with the Wi values, suggesting that sulphide 2 requires more energy to grind (highest W', lowest brittleness), followed by the oxide ore (intermediate and intermediate brittleness), and finally sulphide 1 requires less comminution energy (lowest Wi and highest brittleness).
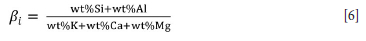
In the effort to establish the relationship between the chemical composition and Wi, the brittleness indices for the ores were determined. The brittleness index (βi), which is used in fracture mechanics, is dependent on various factors such as composition, texture, porosity, and the applied external load to effect fragmentation (Ye, Tang, and Xi, 2020). Various methods (Fatah et al., 2016; Ye, Tang, and Xi, 2020) are currently applied to calculate the brittleness index, and these can be grouped into two categories: (i) brittleness indices based on rock mechanical properties using parameters such as stress, strain, Poissons ratio, and Young's modulus (Guo, Chapman, and Li, 2012; Jiang et al., 2020; Li et al., 2020; Meng, Wong, and Zhou, 2021; Mews, Alhubail, and Barati, 2019; Ozkahraman, 2010; Swain and Rao, 2009), and (ii) brittleness indices derived from mineral content (Buntoro et al., 2018; Fatah et al., 2016; Ye, Tang, and Xi, 2020). Based on the mechanical properties, βi is obtained by dividing the compressive strength by tensile strength (Meng, Wong, and Zhou, 2021). In the later method the brittleness index is the weight ratio of the brittle minerals, such as quartz and feldspar, to the total mineral content (Fatah et al., 2016; Kang et al., 2020; Ye, Tang, and Xi, 2020). While the values from the two methods are not numerically equal, they give a relative indication of the brittleness of rocks.
The later method of calculating the brittleness index, but based on the chemical (elemental) composition rather than the mineral composition, was considered in this study.βi was defined using Equation [6] as the ratio of the acidic elements Si and Al, which contribute to the brittleness of the ore (Buntoro et al., 2018) to the basic elements (K, Ca, and Mg). This is a reciprocal of the basicity modulus in chemistry (Humad, Habermehl-Cwirzen, and Cwirzen, 2019). Pyrite is reported to contribute to the brittleness (Kang et al., 2020), but since it is a minor gangue mineral relative to the silicates, it was not considered for brittleness indexation. The calculated brittleness indices for the three copper ores are listed in Table VI. In agreement with the Wi values in reverse proportionality, it is observed that sulphide 1 (with the smallest W) has the highest βi, sulphide 2 (with the highest W) the smallest βi, and the oxide ore (intermediate W) the intermediate βi. The trend of the calculated βi agrees with the results reported by Kim et al. (2022).
The relative toughness (Kr) of the ores were then calculated relative to the most brittle (sulphide 1 with bornite as a dominant copper mineral) as follows:
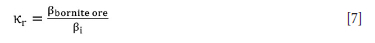
The similarity of the relative toughness values(Kr) and the corresponding relative Bond work indices( Wr) in Table VI shows the importance of the chemical composition of the gangue minerals in characterization of the fracture behaviour of ores during comminution.
The three copper ores were mined from different mineralization zones within the same ore deposit and thus the experimental Wi values of the distinct ores could be useful for the development of the geometallurgical model for that deposit (Mine, 2017; Mwanga et al., 2014). However, to account for the inherent variations in the orebody, many samples are needed to develop a reliable geometallurgical model. The procedure used here to determine Wi is time-consuming and thus alternative comminution tests that provide information on the hardness of the ores are used to generate data for geometallurgical modelling. These tests include, among many others, the uniaxial compressive strength (UCS) test, which gives the strength of the rock under compressive stress (Akinbinu, 2017; Ozkahraman, 2010), and the drop weight tests using single particles of narrow size fractions to determine the 10% passing sizes (commonly referred to as parameter t10,which allows the determination of the parameters (denoted as A and b, in the model shown in Equation [8]), the product of which (A x b) indicates the ore's resistance to impact breakage (Ballantyne, Bonfils, and Powell, 2017; Genç, Ergün, and Benzer, 2004; Nghipulile et al., 2021; Nghipulile, 2019; Tavares, 2007).
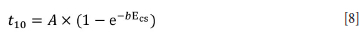
where A and b are material-specific impact breakage parameters.
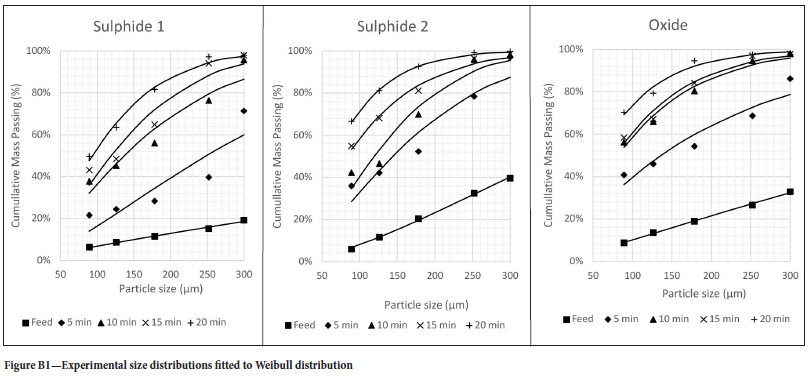
Fitting feed and product size distributions to the Weibull function
The particle size distributions for the feed and mill products after grinding the 1 kg samples for 5, 10, 15, and 20 minutes were fitted to the Weibull distribution, which is described by the following equation:
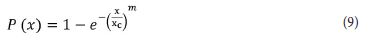
where P(x) is the cumulative percentage passing (%) corresponding to the fragment size ( ); the term xc, called the modular particle size, is the particle size corresponding to cumulative percentage passing (
 ), and m is a fitting parameter, which indicates the width of the distribution.
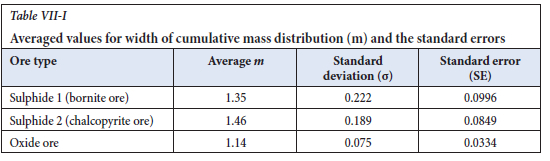
The cumulative mass distributions, both for the experimental data (shown as points) and the modelled Weibull distributions are presented in Appendix B. The fitting parameters in Equation [8] were determined through iteration by finding the minimum root mean square error (RMSE) between the experimental and modelled data. The Weibull distribution fits well to the experimental data, as shown in the plots in Appendix B. The widths of the distributions (parameter m) for the three ores are shown in Table VIII. It can be seen that the widths of distribution for the sulphide ores are greater (averaging 1.4) that for the oxide ore (1.1). The relationship between the m values and mineral composition has not yet been investigated. A meaningful relationship will only be established as more data become available.
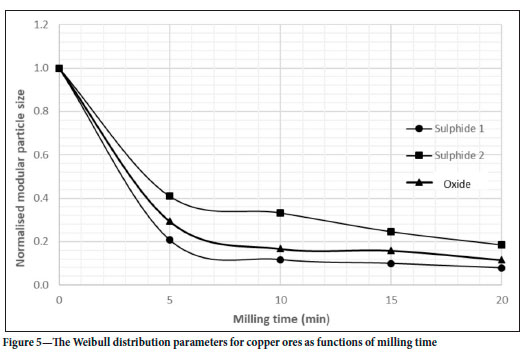
As shown in Figure 5, the xc values were normalized to the feed modular particle sizes to allow better comparison of the three ores through elimination of the variation in the feed size distributions. The normalized modular particle size is a dimensionless quantity which is denoted xc. To understand the modular size, say after 5 minutes of grinding, the normalized xc values are 0.41, 0.30. and 0.21 for sulphide 2, oxide, and sulphide 1 respectively. The modular particle size (xc) represents the particle size corresponding to 63% (w/w) passing. It is observed that the sulphide 2 ore (chalcopyrite) has the highest 63% passing sizes for any milling time ranging between 0 and 20 minutes. This suggests a low size reduction ratio (lowest βi for this ore, i.e. more energy is required to effect the required size reduction, as already indicated by the highest Wi. In line with the trend for the relative work indices ( Wr) and relative toughness index (Kr), the oxide ore has intermediate modular particle size, and sulphide 1 the smallest, suggesting a high size reduction ratio is achievable among the three ores assuming the same input energy.
Conclusions
The Bond ball mill work indices suggest that the chalcopyrite ore ( Wi of 22 kWh/t) is the hardest and bornite ore ( Wi of 14 kWh/t) the softest, while the malachite ore ( Wi of 17 kWh/t) has an intermediate resistance to breakage. The Wi values were inversely proportional to the quartz content (which increases with the brittleness) in the -3350+300 µm and -75 µm size fractions. Sulphide 1 had an average quartz content of 85% (w/w), sulphide 2 had 66%, and the oxide ore had 70%.
Brittleness and relative toughness indices, based on the chemical composition of the gangue minerals in the ores, were calculated. A good correlation between the relative toughness and the corresponding relative Bond work indices highlighted the importance of the chemical composition of the gangue, the dominant component of the ore, when characterizing the comminution behaviour.
The information from this study, especially the work indices, can be useful when designing a milling circuit to process the ores, as the specific comminution energy required to reduce the parent feed size to the target product size can be estimated using Wi. It is recommended that the relationship between the mineralogy and comminution behaviour should also be investigated using other breakage characterization methods, such as the uniaxial compressive strength test, Brazilian tensile strength test, and drop weight test.
References
Akinbinü, VA. 2017. Relationship of brittleness and fragmentation in brittle compression. Engineering Geology, vol. 221. pp. 82-90. https://doi.org/10.1016/j.enggeo.2017.02.029 [ Links ]
Anticoi, H., Güasch, E., Hamid, S., Oliva, J., Alfonso, P., Garcia-Valles, M., Bascompta, M., Sanmiqüel, L., Escobet, T., Argelagüet, R., Escobet, A., de Felipe, J. J., Parcerisa, D., and Pena-Pitarch, E. 2018. Breakage function for HPGR: Mineral and mechanical characterization of tantalum and tungsten ores. Minerals, vol. 8, no. 4. p. 170. https://doi.org/10.3390/min8040170 [ Links ]
Austin, L.G., Klimpel, R.R., and Lückie, P.T. 1984. Process Engineering of Size Reduction: Ball Milling. Society of Mining Engineers of AIME, Englewood, CO. [ Links ]
Ballantyne, G.R., Bonfils, B., and Powell, M.S. 2017. Evolution of impact breakage characterisation: Re-defining t-family relationship. International Journal of Mineral Processing, vol. 168. pp. 126-135. https://doi.org/10.1016/j.minpro.2017.10.001 [ Links ]
Baüm, W. 2014. Ore characterization, process mineralogy and lab automation a roadmap for future mining. Minerals Engineering, vol. 60. pp. 69-73. https://doi.org/10.1016/j.mineng.2013.11.008 [ Links ]
Bradshaw, D. 2014. The role of "process mineralogy" in improving the process performance of complex sulphide ores. IMPC 2014 - Proceedings of the XVII International Mineral Processing Congress, Santiago, Chile, 20-24 October, 2014. [ Links ]
Büntoro, A., Prasetyadi, C., Wibowo, R.A., Süranto, and Lükmana, A.H. 2018. Validation of shale brittleness index calculation from wireline log of well BETRO-001 by using XRD test results and uniaxial test as parameters for determining potential of shale hydrocarbon - Brown shale of Pematang Group Formation, Central Sumatra Basin. IOP Conference Series: Earth and Environmental Science, vol. 212, no. 1. https://doi.org/10.1088/1755-1315/212/1/012069 [ Links ]
Charikinya, E., Bradshaw, S., and Becker, M. 2015. Characterising and quantifying microwave induced damage in coarse sphalerite ore particles. Minerals Engineering, vol. 82. pp. 14-24. https://doi.org/10.1016/j.mineng.2015.07.020 [ Links ]
Chen, C.-F., Xu, T., and Li, S.-H. 2018. Microcrack evolution and associated deformation and strength properties of sandstone samples subjected to various strain rates. Minerals, vol. 8, no. 6. p. 231. https://doi.org/10.3390/min8060231 [ Links ]
Estay, D.A. and Chiang, L.E. 2013. Discrete crack model for simulating rock comminution processes with the Discrete Element Method. International Journal of Rock Mechanics and Mining Sciences, vol, 60. pp. 125-133. https://doi.org/10.1016/j.ijrmms.2012.12.041 [ Links ]
Fan, X., Chen, R., Lin, H., Lai, H., Zhang, C., and Zhao, Q. 2018. Cracking and failure in rock specimen containing combined flaw and hole under uniaxial compression. Advances in Civil Engineering, vol. 2018. https://doi.org/10.1155/2018/9818250 [ Links ]
Fatah, T., Rabe, C., Salazar, J.P., and Filho, R.C.R. 2016. Estimating brittleness index using mineralogy and TOC in the Whangai Formation, New Zealand. Proceedings of the Rio Oil and Gas Expo and Conference 2016, Rio de Janeiro, 26-29 September 2016. [ Links ]
Genç, Ö., Ergün, L., and Benzer, H. 2004. Single particle impact breakage characterization of materials by drop weight testing. Physicochemical Problems of Minereral Processsing, vol. 38. pp. 241-255. http://www.minproc.pwr.wroc.pl/journal/pdf/2004/241-255.pdf [ Links ]
Germanovich, L.N., Salganik, R.L., Dyskin, A.V., and Lee, K.K. 1994. Mechanisms of brittle fracture of rock with pre-existing cracks in compression. Pure and Applied Geophysics, vol. 143, no. 1. pp. 117-149. [ Links ]
Ghanei, J. 2020. Evaluation of the relation between ore texture and grindability. Master's thesis, Luleâ University of Technology. [ Links ]
Ghorbani, Y., Becker, M., Petersen, J., Morar, S.H., Mainza, A., and Franzidis, J.P. (2011). Use of X-ray computed tomography to investigate crack distribution and mineral dissemination in sphalerite ore particles. Minerals Engineering, vol 24, no. 12. pp. 1249-1257. https://doi.org/10.1016/j.mineng.2011.04.008 [ Links ]
Ghorbani, Y., Mainza, A.N., Petersen, J., Becker, M., Franzidis, J.P., and Kalala, J.T. 2013. Investigation of particles with high crack density produced by HPGR and its effect on the redistribution of the particle size fraction in heaps. Minerals Engineering, vol. 43-44. pp. 44-51. https://doi.org/10.1016/j.mineng.2012.08.010 [ Links ]
Griffith, A.A. 1920. The Phenomena of Rupture and Flow in Solids. https://royalsocietypublishing.org/doi/pdf/10.1098/rsta.1921.0006 [ Links ]
Güo, Z., Chapman, M., and Li, X. 2012. A shale rock physics model and its application in the prediction of brittleness index, mineralogy, and porosity of the Barnett Shale. Proceedings of the Society of Exploration Geophysicists International Exposition and 82nd Annual Meeting 2012. SEG 2012, 2406-2410. https://doi.org/10.1190/segam2012-0777.1 [ Links ]
Gutierrez, M. and Yoün, D.J. 2015. Effects of fracture distribution and length scale on the equivalent continuum elastic compliance of fractured rock masses. Journal of Rock Mechanics and Geotechnical Engineering, vol. 7, no. 6. pp. 626-637. https://doi.org/10.1016/j.jrmge.2015.07.006 [ Links ]
Hamdi, P., Stead, D., and Elmo, D. 2015. Characterizing the influence of stress-induced microcracks on the laboratory strength and fracture development in brittle rocks using a finite-discrete element method-micro discrete fracture network FDEM-DFN approach. Journal of Rock Mechanics and Geotechnical Engineering, vol. 7, no. 6. pp. 609-625. https://doi.org/10.1016/j.jrmge.2015.07.005 [ Links ]
Henley, K.J. 1983. Ore dressing mineralogy - A review of techniques, applications and recent developments. Proceedings of the First International Congress on Applied Mineralogy. The Geological Society, London. pp. 175-200. [ Links ]
Hümad, A.M., Habermehl-Cwirzen, K., and Cwirzen, A. 2019. Effects of fineness and chemical composition of blast furnace slag on properties of alkali-activated binder. Materials, vol. 12, no. 20. pp. 1-16. https://doi.org/10.3390/ma12203447 [ Links ]
Ipek, H. and Goktepe, F. 2011. Determination of grindability characteristics of zeolite. Physicochemical Problems of Mineral Processing, vol. 47. pp. 183-192. [ Links ]
Jaüregüi, R. 1982. Simplified Bond Work Index determination. Encontro Nacional de Tratamento de Minérios, vol 2. pp. 358-367. [ Links ]
Jiang, J., Wang, D., Han, X., and Di, S. 2020. Relationship between brittleness index and crack initiation stress ratio for different rock types. Advances in Civil Engineering, vol. 2020. https://doi.org/10.1155/2020/8091895 [ Links ]
Kamona, A.F. and Günzel, A. 2007. Stratigraphy and base metal mineralization in the Otavi Mountain Land, Northern Namibia - A review and regional interpretation. Gondwana Research, vol. 11, no, 3. pp. 396-413. https://doi.org/10.1016/j.gr.2006.04.014 [ Links ]
Kang, Y., Shang, C., Zhoü, H., Huang, Y., Zhao, Q., Deng, Z., Wang, H., and Ma, Y.Z. 2020. Mineralogical brittleness index as a function of weighting brittle minerals-From laboratory tests to case study. Journal of Natural Gas Science and Engineering, vol. 77, no. 18. 103278. https://doi.org/10.1016/j.jngse.2020.103278 [ Links ]
Kiangi, K.K. 2011. Effect of particle filling and size on the behaviour of the ball load and power in a dry mill. PhD thesis, University of the Witwatersrand. 241 pp. https://core.ac.uk/download/pdf/39670024.pdf [ Links ]
Kim, Y., Lee, H.S., Choi, J., Kim, K.H., and Ozyer, C. 2022. Comparison among brittleness, hardness and mineral composition of the Besa River Formation in the Liard Basin, Canada. Journal of Natural Gas Science and Engineering, vol. 103, May. 104632. https://doi.org/10.1016/j.jngse.2022.104632 [ Links ]
King, R.P. 2012. Modeling and Simulation of Mineral Processing Systems (1st edn). Butterworth-Heinemann. https://books.google.com/books?hl=es&lr=&id=ztiwywayyH4C&pgis=1 [ Links ]
Li, Y., Li, Y., Zhoü, L., Li, D., Zhang, S., Tian, F., Xie, Z., and Liü, B. 2020. Shale brittleness index based on the energy evolution theory and evaluation with logging data: A case study of the Guandong Block. ACS Omega, vol. 5, no. 22. pp. 13164-13175. https://doi.org/10.1021/acsomega.0c01140 [ Links ]
Liü, L., Tan, Q., Liü, L., Li, W., and Lv, L. 2017. Comparison of grinding characteristics in high-pressure grinding roller (HPGR) and cone crusher (CC). Physicochemical Problems of Mineral Processing, vol. 53, no. 2. pp. 1009-1022. https://doi.org/10.5277/ppmp170226 [ Links ]
Lotter, N.O., Baüm, W., Reeves, S., Arrüé, C., and Bradshaw, D.J. 2018. The business value of best practice process mineralogy. Minerals Engineering, vol. 116, May. pp. 226-238. https://doi.org/10.1016/j.mineng.2017.05.008 [ Links ]
Mariano, R. 2016. Measurement and modelling of the liberation and distribution of minerals in comminuted ores. PhD thesis, University of Queensland. https://doi.org/10.14264/uql.2016.1081 [ Links ]
Masindi, V., Foteinis, S., and Chatzisymeon, E. 2022. Co-treatment of acid mine drainage and municipal wastewater effluents: Emphasis on the fate and partitioning of chemical contaminants. Journal of Hazardous Materials, vol. 421, January 2022. 126677. https://doi.org/10.1016/j.jhazmat.2021.126677 [ Links ]
Meng, F., Wong, L.N.Y., and Zhou, H. 2021. Rock brittleness indices and their applications to different fields of rock engineering: A review. Journal of Rock Mechanics and Geotechnical Engineering, vol. 13, no. 1. pp. 221-247. https://doi.org/10.1016/j.jrmge.2020.06.008 [ Links ]
Mews, K.S., Alhubail, M.M., and Barati, R.G. 2019. A review of brittleness index correlations for unconventional tight and ultra-tight reservoirs. Geosciences, Switzerland, vol. 9, no, 7. https://doi.org/10.3390/geosciences9070319 [ Links ]
Mine, A. 2017. Geometallurgical estimation of comminution indices for porphyry copper deposit applying mineralogical approach. Master's thesis, Luleâ University of Technology [ Links ]
Mulenga, F.K. and Moys, M.H. 2014. Effects of slurry filling and mill speed on the net power draw of a tumbling ball mill. Minerals Engineering, vol. 56. pp. 45-56. https://doi.org/10.1016/j.mineng.2013.10.028 [ Links ]
Mwanga, A. 2016. Development of a geometallurgical testing framework for ore grinding and liberation properties. Doctoral thesis, Luleâ University of Technology. [ Links ]
Mwanga, A. 2014. Test methods for characterising ore comminution behavior in geometallurgy. Licentiate thesis, Luleâ University of Technology. https://doi.org/10.3390/min5020276 [ Links ]
Napier-Munn, T.J., Morrell, S., Morrison, R.D., and Kojovic, T. 2005. Mineral Comminution Circuits: Their Operation and Optimisation (3rd edn). Julius Kruttschnitt Mineral Reseach Centre, University of Queensland. [ Links ]
Nghipulile, T. 2019. Modelling studies of a rotary offfset crusher. University of the Witwatersrand. [ Links ]
Nghipulile, T., Bwalya, M., Moys, M., and Simonsen, H. 2021. Exploratory development of a rotary offset crusher. Journal of the Southern African Institute ofMining and Metallurgy, vol. 121, no. 1. pp. 29-38. https://doi.org/10.17159/2411-9717/1325/2021 [ Links ]
Ozkahraman, H.T. 2010. Breakage mechanisms and an encouraging correlation between the Bond parameters and the friability value. Journal of the Southern African Institute ofMining and Metallurgy, vol. 110, no. 3. pp. 153-159. [ Links ]
Palm, N.A., Shackleton, N.J., Malysiak, V, and O'Connor, C.T. 2010. The effect of using different comminution procedures on the flotation of sphalerite. Minerals Engineering, vol. 23, no. 11-13. pp. 1053-1057. https://doi.org/10.1016/j.mineng.2010.08.001 [ Links ]
Reichert, M., Gerold, C., Fredriksson, A., Adolfsson, G., and Lieberwirth, H. 2015. Research of iron ore grinding in a vertical-roller-mill. Minerals Engineering, vol. 73. pp. 109-115. https://doi.org/10.1016/j.mineng.2014.07.021 [ Links ]
Schouwstra, R.P. and Smit, A.J. 2011. Developments in mineralogical techniques -What about mineralogists? Minerals Engineering, vol. 24, no. 12. pp. 1224-1228. https://doi.org/10.1016/j.mineng.2011.02.002 [ Links ]
Shi, F. and Zuo, W. 2014. Coal breakage characterisation - Part 1: Breakage testing with the JKFBC. Fuel, vol. 117 (part B). pp. 1148-1155. https://doi.org/10.1016/j.fuel.2013.07.042 [ Links ]
Shi, F., Zuo, W., and Manlapig, E. 2013. Characterisation of pre-weakening effect on ores by high voltage electrical pulses based on single-particle tests. Minerals Engineering, vol. 50-51, no. 69-76. https://doi.org/10.1016/j.mineng.2013.06.017 [ Links ]
Sipunga, E. 2015. Optimization of the flotation of copper smelter slags from Namibia Custom Smelters' slag mill plant. MSc thesis, University of the Witwatersrand. [ Links ]
Solomon, N., Becker, M., Mainza, A., Petersen, J., and Franzidis, J.P. 2011. Understanding the influence of HPGR on PGM flotation behavior using mineralogy. Minerals Engineering, vol. 24. pp. 12. pp. 1370-1377. https://doi.org/10.1016/j.mineng.2011.07.015 [ Links ]
Swain, R. and Rao, R.B. 2009. Alternative approaches for determination of bond work index on soft and friable partially laterised khondalite rocks of bauxite mine waste materials. Journal of Minerals and Materials Characterization and Engineering, vol. 08, no. 09. pp. 729-743. https://doi.org/10.4236/jmmce.2009.89063 [ Links ]
Tavares, L.M. 2007. Breakage of single particles: Quasi-static. Handbook of Powder Technology, vol. 12. Elsevier. pp. 3-68. https://doi.org/10.1016/S0167-3785(07)12004-2 [ Links ]
Todorovic, D., Trumic, M., Andric, L., Milosevic, V., and Trumic, M. 2017. A quick method for Bond work index approximate value determination. Physicochemical Problems of Mineral Processing, vol. 53, no. 1. pp. 321-332. https://doi.org/10.5277/ppmp170126 [ Links ]
Viljoen, J., Campbell, Q.P., le Roux, M., and Hoffman, J. 2015. The qualification of coal degradation with the aid of micro-focus computed tomography. South African Journal of Science, vol. 111, no. 9-10. pp. 1-10. https://doi.org/10.17159/sajs.2015/20140025 [ Links ]
Whiteman, E., Lotter, N.O., and Amos, S.R. 2016. Process mineralogy as a predictive tool for flowsheet design to advance the Kamoa project. Minerals Engineering, vol. 96-97. pp. 185-193. https://doi.org/10.1016/j.mineng.2016.05.004 [ Links ]
Wills, B.A. and Finch, J. 2016. Wills' Mineral Processing Technology: An Introudtcion to Practical Aspects of Ore Treatment and Mineral Recovery (8th edn). Elsverier Butterworth-Heinemann. [ Links ]
Xiao, X., Zhang, G., Feng, Q., Xiao, S., Huang, L., Zhao, X., and Li, Z. 2012. The liberation effect of magnetite fine ground by vertical stirred mill and ball mill. Minerals Engineering, vol. 34. pp. 63-69. https://doi.org/10.1016/j.mineng.2012.04.004 [ Links ]
Ye, Y., Tang, S., and Xi, Z. 2020. Brittleness evaluation in shale gas reservoirs and its influence on fracability. Energies, vol. 13, no. 2. https://doi.org/10.3390/en13020388 [ Links ]
Zhao, J. and Zhang, D. 2020. Dynamic microscale crack propagation in shale. Engineering Fracture Mechanics, vol. 228, February. 106906. https://doi.org/10.1016/j.engfracmech.2020.106906 [ Links ]
Zhao, Y., Zhang, L., Wang, W., Pu, C., Wan, W., and Tang, J. 2016. Cracking and stress-strain behavior of rock-like material containing two flaws under uniaxial compression. Rock Mechanics and Rock Engineering, vol. 49, no. 7. pp. 2665-2687. https://doi.org/10.1007/s00603-016-0932-1 [ Links ]
Zhou, X., Gu, X., and Wang, Y. 2015. Numerical simulations of propagation , bifurcation and coalescence of cracks in rocks. International Journal of Rock Mechanics and Mining Sciences, vol. 80. pp. 241-254. https://doi.org/10.1016/j.ijrmms.2015.09.006 [ Links ]
 Correspondence:
T.E. Moongo
Email: tmoongo@gmail.com
Received: 24 Aug. 2021
Revised: 12 Sep. 2022
Accepted: 7 Mar. 2023
Published: March 2023
Appendix A
Appendix B: Cumulative mass distributions fitted to Weibull distribution

