


Services on Demand
Article
 English (pdf)
 Article in xml format
 Article references
Indicators

Related links
-
 Cited by Google
 -
 Similars in Google
Share

 Permalink
Journal of the Southern African Institute of Mining and Metallurgy
On-line version ISSN 2411-9717
Print version ISSN 2225-6253
J. S. Afr. Inst. Min. Metall. vol.123 n.3 Johannesburg Mar. 2023
http://dx.doi.org/10.17159/2411-9717/936/2023
PROFESSIONAL TECHNICAL AND SCIENTIFIC PAPERS
Prediction of ground vibrations induced by bench blasting using the random forest algorithm
N. DzimunyaI; B. BesaII; R. NyirendaI
IUniversity of Zimbabwe, Harare, Zimbabwe. ORCID - N. Dzimunya: http://orcid.org/0000-0002-4616-5818
IIUniversity of Zambia, Lusaka, Zambia
SYNOPSIS
The accurate estimation of peak particle velocity (PPV) is crucial during the design of bench blasting operations in open pit mines, since the vibrations caused by blasting can significantly affect the integrity of nearby buildings and other structures. Conventional models used to predict blast-induced vibrations are not capable of capturing nonlinear relationships between the different blasting-related parameters. Soft computing techniques, i.e., techniques that are founded on the principles of artificial intelligence, effectively model these complexities. In this paper, we use the random forest (RF) algorithm to develop a model to predict blast-induced ground vibrations from bench blasting using 48 data records. The model was trained and tested using WEKA data-mining software. To build this model, a feature selection process using several combinations of Attribute Evaluators and Search Methods under the WEKA Select Attributes tab was performed. The correlation coefficient of the actual data and RF model-predicted data was 0.95, and the weighted average of the relative absolute error (RAE) was 10.9%. The RF model performance was also compared to the equivalent-path-based (EPB) equation on the testing data-set, and it was seen that the RF model can effectively be used to predict PPV. The study also demonstrates that the EPB equation is a suitable empirical method for predicting PPV.
Keywords: Blast-induced ground vibrations, peak particle velocity, random forest algorithm, EPB equation.
Introduction
Blasting is the most common means of fragmenting rock in mining and construction projects. In some cases, blasting is performed in close proximity to buildings and other structures, where the vibrations caused can significantly affect the integrity of these structures. The peak particle velocity (PPV) is the most important parameter generally used to evaluate ground vibrations in blasting sites (Jiang et al., 2019). Accurately evaluating and predicting the PPV, and then optimizing the blast design, helps to minimize the damage caused by blasting vibrations (Longjun et al., 2011).
The intensity of blast-induced ground vibrations is commonly evaluated by regression analysis using the Sadaovsk (Li, Ling, and Zhang, 2009), US Bureau of Mines (Duval and Fogelson, 1962), Langefors-Kihlstrom (Langefors and Kihlstrom, 1963), and the Indian Standard (Bureau of Indian Standards, 1973) formulae. The general form of all these conventional methods is presented in Equation [1]:

where
PPV is peak particle velocity (cm/s)
Q is maximum explosive charge (kg)
R is the distance between the explosion source and the measuring point (m)
K, β, and a are site-specific constants that are related to the blasting conditions and rock characteristics.
There are many factors that influence blast vibrations, and mathematical techniques do not accurately model all these factors. As a result, several other techniques have been developed to find a more efficient method for predicting blast-induced ground vibrations. Many researchers have employed soft computing for this purpose. Soft computing refers to a group of computational techniques that are founded on the principles of artificial intelligence. These methods can effectively handle the complexities that arise from the nonlinear relationships between the variables that influence blasting. Methods that have been explored to improve the study of PPV include:
> Artificial neural networks (ANNs) (Amnieh, Mozdianfard, and Siamaki, 2010; Amnieh, Siamaki, and Soltani, 2012; Azimi, Khoshrou, and Osanloo, 2019; Das, Sinha, and Ganguly, 2019; Jiang et al., 2019; Kamali and Ataei, 2010; Kosti et al., 2013; Ragam and Nimaje, 2019; Sayadi et al., 2013)
> Other machine-learning studies (Lawal, Olajuyi, and Kwon, 2021; Longjun et al., 2011)
> Numerical methods (Ducarne et al., 2018; Kumar et al., 2020; Nguyen and Gatmiri, 2007)
> Multivariate analysis (Hudaverdi, 2012)
> Empirical analysis (Hu and Qu, 2018)
> Bayesian approach (Aladejare, Lawal, and Onifade, 2022).
Diverse parameters are used differently in building soft computing methods. Das, Sinha, and Ganguly (2019) developed an ANN model utilizing the following parameters: rock density, number of holes, hole diameter, hole depth, burden, spacing, charge length, stemming length, maximum explosive charge per delay, charge, distance of monitoring point from face, Young's modulus, Poissons ratio, P-wave velocity, and density of explosive. Longjun et al. (2011) compared the performance of support vector machines and the random forest (RF) algorithm utilizing the following: maximum amount of charge at one time, total amount of charge, horizontal distance, elevation difference, front row resistance line, presplit penetration ratio, integrity coefficient, angle of minimum resistance line to measured point, and detonation velocity.
Mostly ANNs have been utilized in blast-induced vibration predictions, and it is critical to explore the performance of other machine-learning algorithms. This should be extended by investigating the performance of these algorithms using different blasting and rock mass parameters to effectively model blast-induced ground vibrations. In this paper, the parameters modified by Hu and Qu (2018) in developing their equivalent-path-based (EPB) equation have been used to build a PPV prediction model using the RF algorithm. This method was chosen because Hu and Qu implemented a unique way of interpreting the distance between the blasting and vibration measurement points, along with the inclusion of pertinent properties such as those concerning explosive energy release and rock mass properties. To optimize the performance of the model, a feature selection procedure is also utilized to develop the best feature subset. The RF model performance is then compared to the results from the EPB equation.
Literature review
A brief description of the EPB equation and RF is presented in this section. The underlying rationale of choosing to compare these two methods for predicting PPV was that unique parameters were introduced in deriving the EPB equation and thus it is fundamental to use these parameters in developing machine-learning models. This may improve the accuracy of PPV prediction. RF was chosen because it is a widely used algorithm, and the same data-set that was used to test the EPB equation was used to develop the RF model, as will be described later.
EPB equation
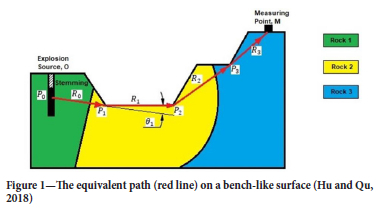
The general form of the blast-induced ground vibration formula is illustrated in Equation [1]. To modify and improve the predictive power of this equation, Hu and Qu (2018) developed the EPB equation. Blast-induced ground vibrations arise from the energy released by the detonating explosives. Since the energy is related to the type of explosive, Hu and Qu concluded that the energy release properties of the explosive should be included in the final formula. The explosion heat of the explosive (Qv) was the parameter suggested to represent this relationship. Hu and Qu also proposed the use of an equivalent propagation path (i.e. a series of straight-line segments P0P1, P1P2, P2P3, ..,PxPx+1 as indicated in Figure 1) of the seismic wave, as opposed to the horizontal distance previously used.
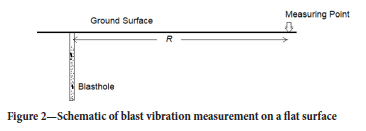
The concept of equivalent path seems reasonable as opposed to taking the distance travelled by the seismic wave as a straight line (as assumed in previous studies). If the measurements are taken on a flat surface, the idea of representing the path travelled by the seismic wave as a straight line is valid (Figure 2).
However, the topography on an open pit mine (Figure 1) is more complex and it is very unlikely that the vibration waves will travel along a straight line to the geophones positioned on the slopes or anywhere outside the pit. The seismic wave will travel, within the ground, to the measuring points and it will never be propagated through the void above the pit floor and sides. Hu and Qu therefore assumed that the shortest possible path that the seismic wave travels beneath the ground can be utilized as the distance from detonation to measuring point. This shortest distance was then used to represent R in Equation [1]. This was termed the 'equivalent distance', and the procedures for determining this distance are given in Hu and Qu (2018). However, the interactions between blast-holes and their influence on the equivalent path was not considered.
Impedance of the rock mass was also included in formulating the EPB equation. The impedance was defined by Hu and Qu (2018) as

where
z is the impedance
p is the rock density (g/cm3)
Cm is the longitudinal wave propagation velocity of the rock mass (m/s)
n is the integrity factor of the rock mass [n=(cm/Cr)2 and Cr is the longitudinal wave propagation of the rock (m/s)].
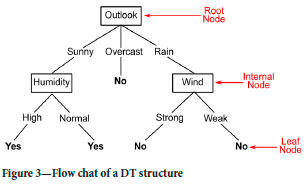
The PPV and impedance were said to be negatively correlated. Since impedance is the effective resistance of the rock mass to propagation of the waves, it follows that the higher the impedance of the rock mass the lower the PPV. Following this parametric analysis, the EPB equation (Equation [3]) was proposed (Hu and Qu, 2018) as:
where
i = 0, 1, 2, 3...
PPV is peak particle velocity (cm/s)
Q is the maximum explosive charge fired per delay (kg)
Qv is the explosion heat of the explosive at constant volume (kJ/kg)
Ri is the equivalent distance (m)
0i is the intersection angle of the wave propagation direction to the ground surface at Pi (degrees)
pi is the density of the rock on the equivalent path (g/cm3)
ni is the integrity coefficient of the rock mass.
The general structure of the EPB equation is very similar to that of Equation [1]. However, the parameters in the EPB equation have been improved and modified to closely represent the phenomena. Of much importance is the representation of R in Equation [1] as the equivalent distance, Ri. The explosion heat of the explosive (Qv) has also been accommodated in the EPB equation. Site-specific rock mass chartacteristics that influence how seismic waves travel in rocks have also been included in the equation. These rock mass characteristics were chosen by Hu and Qu as the impedance and the density of the rock. A detailed analysis of the development of the EPB equation and how 0i can be incorporated into the equation is presented in Hu and Qu (2018).
RF algorithm
To easily comprehend the brief description of the RF algorithm, definitions of a few machine-learning technical terms that will feature in the narrative are presented here.
> Attributes/features/predictors - These are basically the columns of a data-set, and they represent a separate measurable characteristic of the parameter being investigated. In other words, these are a characteristic of an instance (individual rows in the data-set).
> Base learners - Individual models that constitute an ensemble.
> Bootstrap sampling - A statistical technique that involves random subsampling with replacements.
> Class - The parameter that is being predicted (in this case the PPV).
> Classifier - An algorithm that learns from the data and then makes predictions.
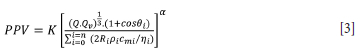
> Decision tree (DT) - A flow chart-like tree that displays the several outcomes from a sequence of decisions. It is used as a decision-making tool from given data. DTs have three main parts: a root node, internal nodes, and leaf nodes. The root node is the starting point of the tree, and it contains all the input data. An internal node can comprise two or more branches (arrows connecting nodes) and is related with a decision function. A leaf node represents the target/output of a given input vector and denotes a class label. Figure 3 is a simple example of a DT showing when it is possible to blast in an open pit (Yes) and when it is not possible to blast (No) given various weather combinations.
> Ensemble - A group of different base models whose individual predictions are combined to produce one optimal predictive model.
> Entropy - A technique used in machine-learning to determine how a DT chooses to split data at nodes.
> Gini impurity - Another technique which performs similar functions as entropy to build DTs.
>Overfitting - This is a challenge in machine-learning where an algorithm can fit the training data very well but fails to generalize to make predictions on new data. In DTs it is caused by developing too deep trees (trees with many internal nodes).
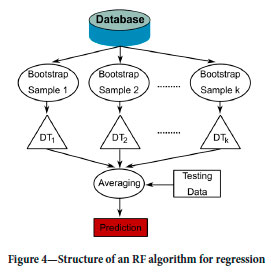
Thus, RF is a machine-learning algorithm that consists of growing an ensemble of DTs for accomplishing classification/ regression on a given data-set. Ensemble learning defines all the techniques that use numerous base learners (DT1, DT2, ... , DTk in Figure 4), then combines their individual outputs to produce a single classifier. The base learners combine their outputs by a majority vote technique in classification or through averaging in regression. The RF algorithm is described as an variation of bagging which creates a forest of de-correlated trees and averages their predictions (Breiman, 2001). DT models commonly suffer from overfitting (high variance) and thus averaging out predictions from multiple DTs leads to a decrease in overall variance. The practise of growing these DTs is centred on bagging (bootstrap aggregation), which is a procedure for decreasing the variance of an estimated prediction function. Here, bagging principally encompasses generating several data subsets from the training data by bootstrap sampling (random subsampling with replacement) and selecting random subsets of predictor variables. Each of these data subsets, of similar distribution, is then utilized to independently train a DT.
Additionally, for each tree, only a random subset of predictors/ features is used for developing the decision model. For each tree thus created, a predictor is selected to accomplish a decision-split at a particular node. This is generally performed based on either the information gain/entropy or the Gini impurity that selects the best predictor for that node. This procedure is iterated at each node in a DT and consequently several trees are trained. Ultimate prediction decisions are reached based on averaging (for regression) or majority voting (for classification) of individual tree predictions.
Since data subsampling and predictor subsampling for each tree is carried out randomly on a forest of trees, this algorithm is termed RF. Figure 4 is an example of the structure of an RF algorithm for regression.
Data-set
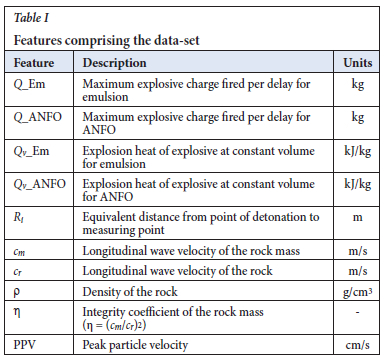
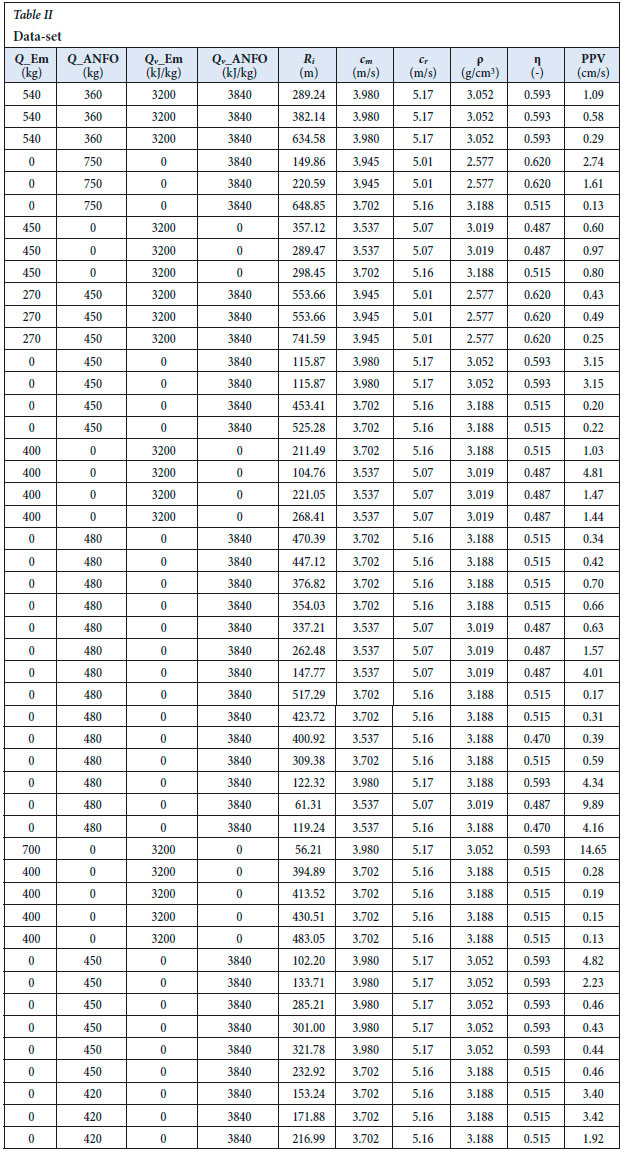
The data-set utilized to evaluate the usefulness of the RF algorithm in predicting blast-induced ground vibrations was developed from the seismic monitoring measurements carried out by Hu and Qu (2018) at Si-Jia-Ying iron ore mine in China. This mine is a large-scale open pit operation which uses multi-hole millisecond delay bench blasting. The features of the data-set and their corresponding notations are listed in Table I. In this case the PPV is the class attribute. This data-set was chosen for the current study because it is the same as that used to develop and test the EPB equation. This consistency will ensure that the comparisons undertaken between the EPB equation and the RF model will be reasonable and reliable.
A total of 48 instances/data-points forms the data-set, as indicated in Table II.
RF model formulation
The PPV prediction model was developed using Waikato Environment for Knowledge Analysis (WEKA) software (Hall ef al., 2009). WEKA is a handy and powerful machine-learning and data-mining software application that can assist users to understand acquired data better. The software incorporates powerful data analysis tools that can be used to extract useful information from large sums of data and develop machine-learning models.
Feature selection
Raw machine-learning data-sets consist of a mixture of features/ attributes, some of which are irrelevant to making accurate predictions. Thus, one of the most important exercises in building machine-learning models is to identify the most influential attributes to include in the model. The process of selecting relevant features from the data is called feature selection. In the WEKA software platform this procedure is performed under the Selecf Attribute tab in WEKA Explorer. Figure 5 is a screenshot of the WEKA home screen with the Explorer tab marked in red.

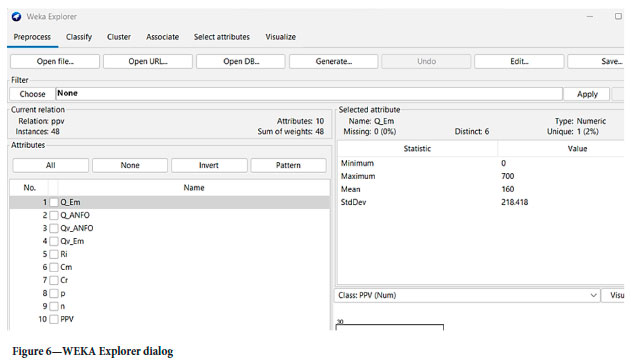
When the Explorer tab is selected the dialog indicated in Figure 6 is displayed. The Preprocess tab is used to load the data-set into the software, the Classify tab is available to the user to enable the construction of different machine-learning models for prediction and classification tasks and the Select Attributes tab is used for feature selection. The Select Attributes tab hosts all the techniques necessary to accomplish feature selection. Figure 7 shows the dialog that's displayed to the user when the Select Attributes tab is selected. The Choose tabs (circled in red) enable the user to select different combinations of Attribute Evaluators and Search Methods and with the data-set preloaded into the software, the best feature subset is displayed in the Attribute Selection Output window.
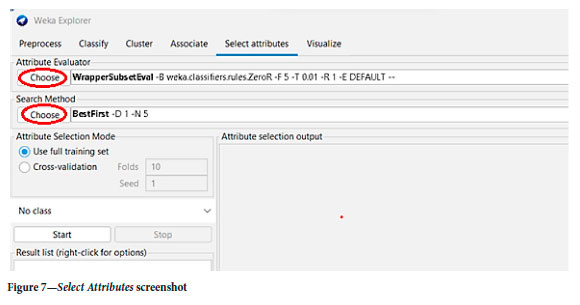
In WEKA, feature selection is basically divided into two parts (Attribute Evaluator and Search Method). Each of these two sections presents several techniques for accomplishing the feature selection process. Attribute Evaluator is the technique by which each attribute (also called a column or feature) in a data-set is weighed in the context of the output variable (also known as the class). Search Method, on the other hand, navigates several combinations of features in the data-set to arrive at a short list of selected features. Each Attribute Evaluator technique should be used together with a Search Method, and some Attribute Evaluator techniques require the use of specific Search Methods.
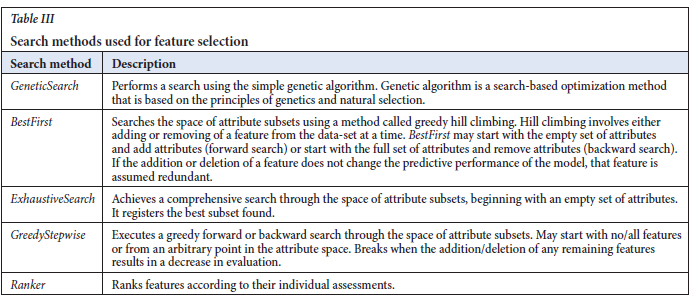
The techniques used to perform feature selection in this study are described in Tables III and IV.
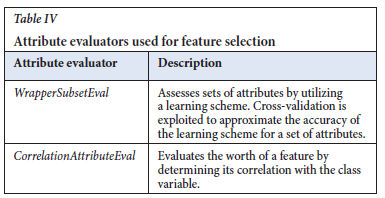
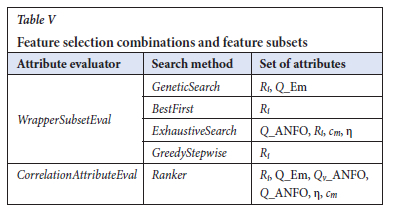
Table V indicates the combination of techniques used to select the best features for the RF model.
Based on the outcomes in Table V and from analysis of variables as they are used in empirical formulae, the RF model was trained and tested using the following features: Ri, Q_Em, Q_ANFO, Qv_ ANFO, Qv_Em and cm. Explosives properties, distance to measuring point, and rock mass characteristics influence PPV. From Table V, p, Qv_Em and cr have been rendered redundant. Therefore, the feature to represent rock mass characteristics was concluded to be cm. This is because tj, though present in Table V, was not included because it is dependent on cm (already included) and cr (redundant feature). Thus, the inclusion of n into the feature set will not add any value to the model performance. Qv_Em was included mainly because Qv_ANFO is present in Table V and thus a balanced representation of all the explosive types used was assumed reasonable.
RF model
In supervised learning, the performance of a classifier needs to be measured on a given data-set before using it to predict the class of a new project (Zhou, Xibing, and Hani, 2015). To satisfy this criterion, the original data-set is randomly split into two subsets: a training set and a testing set. The training set is used to construct the model and to set the model parameters, while the testing set is used as an independent validation set for assessing the performance and predictive power of the model. In this study, the data-set was split into 70% training set and the remaining 30% was used as the testing set.
In WEKA, hyperparameter tuning is very important when building a model. Hyperparameters, in machine-learning, are a set of parameters that control the behaviour of a model, and these parameters are set/tuned before the training of a model starts. The tuning of these parameters is important because it determines how well a model is going to learn from the training data, thus enabling best performances to be achieved. The key hyperparameter for RF is the number of attributes to consider at each split point. In WEKA this parameter is controlled by the numFeatures attribute. In the previous feature selection exercise, six features were selected and thus the best model involved using all these parameters. Therefore, numFeatures hyperparameter was set to 6 as it yielded the highest correlation coefficient. The other hyperparameters were left on default settings.
The RF model performance was then compared to the EPB equation to evaluate its predictive power and possibility of future use when employing the parameters from the EPB equation as dataset features.
Results and discussion
The aim of this investigation was to utilize the parameters that constitute the EPB equation and develop and evaluate the performance of the RF algorithm from a data-set formulated from these parameters. These parameters are equivalent distance (R;), maximum explosive charge per delay (Q), explosion heat of the explosive (Qv), and longitudinal wave velocity of the rock mass (cm).
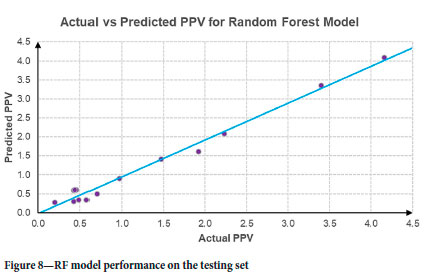
The correlation coefficient of the RF model was 0.95, indicating that this model is suitable for predicting blast-induced ground vibrations using equivalent distance (R;), maximum explosive charge per delay (Q), explosion heat of the explosive (Qv), and longitudinal wave velocity of the rock mass (cm) as model parameters. The model-predicted PPVs are plotted against the actual values in Figure 8. The agreement is excellent, demonstrating that the RF model is fitted well on the training data-set. As previously highlighted, the model was built by splitting the data into 70% training set and the remaining 30% as the testing set. Thus, 14 data-points were available to test the model.
WEKA also gives a summary of the predictive errors of the model, including mean absolute error (MAE), root mean squared error (RMSE), and relative absolute error (RAE). If the RMSE and MAE are zero, then the model will be perfect, i.e., both values should be minimized. The RF model and the EPB equation results were compared on the test set as indicated in Table VI. Instead of the arithmetic mean, the overall RAE for each set of predictions was computed using the weighted average (Equation [4]) because this approach is reasonably appropriate for regression problems where statistical dispersion is expected between data-points.
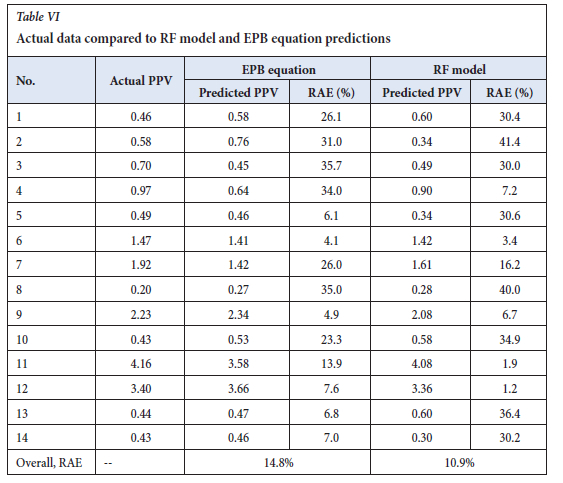

It can be seen from Table VI that the predicted values and actual values obtained from RF model are of relatively low comparative error. The overall RAE for the RF model was 10.9%, indicating that the model is sufficiently capable of predicting blast-induced vibrations within a reasonable range of errors.
The RF model has better prediction capabilities than the EPB equation. This is indicated by an overall RAE of 10.9% for the RF model against 14.8% for the EPB equation. The RF model performs better because it is a soft computing technique and can capture nonlinear relationships between the various blasting-related parameters. The slightly lower prediction performance of the EPB equation can be attributed to the inability of mathematical methods to capture the nonlinear relationships between multiple influencing parameters.
The EPB equation has demonstrated that it can produce results that are not far out of range. Good corelation, in general, is indicated by errors of 10% or lower. The 10.9% RAE achieved by the RF model is reasonably close to 10% and the slightly higher margin could be attributed to the relatively small data-set used to train and test the model. It would be of great value to combine the data-set used here with similar data from Zimbabwe and neighbouring regions in order to undertake further studies. This would have the potential to improve the prediction of PPV using the RF algorithm.
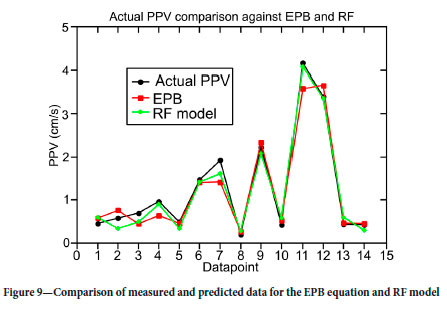
To visualize the comparison more clearly, values of PPV for both models were plotted as shown in Figure 9. The result proves that the established RF model is reasonable and reliable in predicting PPV for bench blasting using equivalent distance (R;), maximum explosive charge per delay (Q), explosion heat of the explosive (Qv), and longitudinal wave velocity of the rock mass (cm) as predictor variables. Figure 9 shows that the RF model gives a better prediction of the PPV on the test data-set.
The relationships of the four parameters selected for the model with PPV are briefly described as follows.
>The prime factor is the equivalent distance (R;). There is a direct relationship between equivalent distance and the PPV as it appeared in all the methods used for feature selection. However, this parameter had an individual correlation coefficient of -0.66 with PPV. Logically, this is because the magnitude of the vibration naturally decreases away from the detonation point.
> The second factor is maximum explosive charge per delay (Q). The magnitude of PPV is directly proportional to Q. An increase in the quantity of explosives used during blasting results in stronger ground vibrations being caused.
> The vibrations also depend on the energy properties of the individual explosives used, expressed as the explosion heat of the explosive (Qv). The greater the energy contained in an explosive, the more likely it is to cause stronger ground vibrations.
> Finally, the site-specific characteristics of the rock mass play a key role. This is represented by the longitudinal wave velocity of the rock mass (cm). This parameter, plus the density of the rock (p), influences the impedance of the rock mass and the PPV is inversely proportional to ground impedance.
A complex relationship among predictor variables can complicate the prediction of PPV in blasting activities. Therefore, selecting a robust method to develop a PPV prediction model that can cover all the inherent complexity of the problem is very important. RF for regression, in most cases, shows lower average errors and superior predictive performance compared to the other advanced regression algorithms. In this study, RF has proved to be an accurate predictor of PPV in bench blasting scenarios, based on the features chosen for evaluation. However, this should be further verified by integrating other local data-sets with the one used in this study.
Conclusions
Very accurate estimation of PPV is crucial for the design of appropriate bench blasting practices in open pit mining projects, since the vibrations caused by blasting can significantly affect the integrity of nearby buildings and other structures. Conventional methods have been used to predict these blast-induced vibrations. Artificial neural networks (ANNs) have also been developed, resulting in more accurate predictions. To fully understand this phenomenon, it is critical to explore different machine-learning algorithms and evaluate their performances using different sets of predictors (model input parameters). A random forest (RF) model was developed using equivalent distance (R), maximum explosive charge per delay (Q), explosion heat of the explosive (Qv), and longitudinal wave velocity of the rock mass (cm) as predictor variables. The RF model was found to consistently predict PPV to within a reliable range of accuracies. The model displayed a correlation coefficient, between actual and predicted PPV values, on the test set of 0.95 and an overall relative absolute error (RAE) of 10.9%. The performance of the RF model was compared to that of the equivalent-path-based (EPB) equation. The EPB equation yielded an overall RAE of 14.8%, and thus RF model displayed better prediction capabilities. This study also confirms the usefulness of the EPB equation, as well as the effectiveness of the parameters used in the EPB equation, in formulating more comprehensive data-sets for future use with various algorithms.
The outcomes of this study can be applicable to open pit mines in Zimbabwe and the neighbouring regions. This can be done by integrating local databases into the data-set and using a similar approach as described in this study. This may improve the performance of the RF model. Further studies are necessary to confirm this proposition.
Acknowledgements
The authors would like to acknowledge the thoughtful and valuable comments of the anonymous reviewers, which have improved the quality of this paper.
Author contributions
DN: conceptualization, methodology, software, writing - original draft preparation; BB: writing - reviewing and editing; NR: software, writing - reviewing and editing.
References
Aladejare, A., Lawal, A., and Onifade, M. 2022. Predicting the peak particle velocity from rock blasting using Bayesian approach. Acta Geophysica, vol. 70. pp. 581-591. https://doi.org/10.1007/s11600-022-00727-5 [ Links ]
Amnieh, H.B., Mozdianfard, M.R., and Siamaki, A. 2010. Predicting of blasting vibrations in Sarcheshmeh copper mine by neural network. Safety Science, vol. 48. pp. 319-325. [ Links ]
Amnieh, H.B., Siamaki, A., and Soltani, S. 2012. Design of blasting pattern in proportion to the peak particle velocity (PPV): artificial neural networks approach. Safety Science, vol. 50. pp. 1913-1916. [ Links ]
AziMi, Y., KHOSHROU, S.H., and OsANLOO, M. 2019. Prediction of blast induced ground vibration (BIGV) of quarry mining using hybrid genetic algorithm optimised artificial neural network. Measurement, vol. 147. https://doi.org/10.1016/j.measurement.2019.106874 [ Links ]
Breiman, I. 2001. Random forest. Machine Learning, vol. 45, no. 1. pp. 5-32. [ Links ]
Bureau OF Indian Standards. 1973. IS-6922. Criteria for safety and design of structures subjected to underground blast.: ISI Bulletin. https://civilplanets.com/wp-content/uploads/2020/04/6922.pdf [ Links ]
Das, A., Sinha, S., and Ganguly, S. 2019. Development of a blast-induced vibration prediction model using an artificial neural network. Journal of the Southern African Institute of Mining and Metallurgy, vol. 119, no. 2. pp. 187-200. [ Links ]
Ducarne, L., Ainalis, D., Kaufmann, O., Tshibangu, J-P., Verlinden, O., and Kouroussis, G. 2018. Numerical modelling of blast-induced ground vibrations. Proceedings of the 25th International Congress on Sound and Vibration, Hiroshima, Japan 8-12 July 2018. International Institute of Acoustics & Vibration. https://www.researchgate.net/profile/Georges-Kouroussis/publication/326601233_Numerical_modelling_of_blast-induced_ground_vibrations/links/5b586eb8458515c4b243ecd5/Numerical-modelling-of-blast-induced-ground-vibrations.pdf [ Links ]
Duval, W.I. and Fogelson, D.E. 1962. Review of criteria for estimating damage to residences from blasting vibrations. Report of Investigations 5868: US Bureau of Mines. [ Links ]
Hall, M., Frank, E., Holmes, G., Pfahringer, B., Reutemann, P., and Witten, I.H. 2009. The WEKA data mining software: An update. ACM SIGKDD Explorations Newsletter, vol. 11, no. 1. pp. 10-18. [ Links ]
Hudaverdi, T. 2012. Application of multivariate analysis for prediction of blast-induced ground vibrations. Soil Dynamics and Earthquake Engineering, vol. 43. pp. 300-308. [ Links ]
Hu, X. and Qu, S. 2018. A new approach for predicting bench blasting-induced ground vibrations: A case study. Journal of the Southern African Institute of Mining and Metallurgy, vol. 118, no. 5. pp. 531-538. [ Links ]
Jiang, W., Arslan, C.A., Tehrani, M.S., Khorami., and Hasanipanah, M. 2019. Simulating the peak particle velocity in rock blasting projects using a neuro-fuzzy inference system. Engineering with Computers, vol. 35. pp. 1203-1211. https://doi.org/10.1007/s00366-018-0659-6 [ Links ]
Kamali, M. and Ataei, M. 2010. Prediction of blast induced ground vibrations in Karoun III power plant and dam: A neural network. Journal of the Southern African Institute of Mining and Metallurgy, vol. 110, no. 8. pp. 481-490. [ Links ]
Kosti, S., Perc, M., Vasovi, N., and Trajkovi, S. 2013. Predictions of experimentally observed stochastic ground vibrations induced by blasting. PLoS ONE, vol. 8. https://doi.org/10.1371/journal.pone.0082056 [ Links ]
Kumar, S., Mishra, A.K., Choudhary, B.S., Sinha, R.K., Deepak, D., and Agrawal, H. 2020. Prediction of ground vibration induced due to single hole blast using explicit dynamics. Mining, Metallurgy and Exploration, vol. 37. pp. 733-741. [ Links ]
Langefors, U. and Kihlstrom, B. 1963. The Modern Techniques of Rock Blasting, Wiley, New York. [ Links ]
Lawal, A., Olajuyi, S., and Kwon, S. 2021. Prediction of blast-induced ground vibration using GPR and blast-design parameter optimisation based on novel grey-wolf optimisation. Acta Geophysica, vol. 69. pp. 1313-1324. https://doi.org/10.1007/s11600-021-00607-4 [ Links ]
Li, X.B., Ling, T.H., and Zhang, Y.P. 2009. Analysis of Blast Vibration Signals -Theories and Methods. Science Press, Beijing. [ Links ]
Longjun, D., Xibing, L., Ming, X., and Qiyue, L. 2011. Comparisons of random forest and support vector machine for predicting blasting vibration characteristic parameters. Procedia Engineering, vol. 26. pp. 1772-1781. [ Links ]
Nguyen, K.V. and Gatmiri, B. 2007. Evaluation of seismic ground motion induced by topographic irregularity. Soil Dynamics and Earthquake Engineering, vol. 27. pp. 183-188. [ Links ]
Ragam, P. and Nimaje, D.S. 2019. Evaluation and prediction of blast induced peak particle velocity using artificial neural network: Case study. Noise & Vibration Worldwide, vol. 49, no. 3. pp. 111-119. [ Links ]
Sayadi, A., Monjezi, M., Talebi, N., and Khandelwall, M. 2013. A comparative study on the application of various artificial neural networks to simultaneous prediction of rock fragmentation and back break. Journal of Rock Mechanics and Geotechnical Engineering, vol. 5. pp. 318-324. [ Links ]
Zhou, J., Xibing, L, and Hani, S.M. 2015. Comparative performance of six supervised learning methods for the development of models of hard rock pillar stability prediction. Natural Hazards, vol. 79, no. 1. pp. 291-316. [ Links ]
 Correspondence:
N. Dzimunya
Email: nevaiddzimunya@gmail.com
Received: 19 Sep. 2019
Revised: 24 Oct. 2022
Accepted: 2 Mar. 2023
Published: March 2023

