


Services on Demand
Article
 English (pdf)
 Article in xml format
 Article references
Indicators

Related links
-
 Cited by Google
 -
 Similars in Google
Share

 Permalink
Journal of the Southern African Institute of Mining and Metallurgy
On-line version ISSN 2411-9717
Print version ISSN 2225-6253
J. S. Afr. Inst. Min. Metall. vol.123 n.2 Johannesburg Feb. 2023
http://dx.doi.org/10.17159/2411-9717/2029/2023
PROFESSIONAL TECHINICAL AND SCIENTIFIC PAPERS
Determination of the erosion level of a porphyry copper deposit using soil geochemistry
F. MoradpouriI; S.M.H. AhmadiII; R. GhaedrahmatiI; K. BaraniI
IDepartment of Mining Engineering, Faculty of Engineering, Lorestan University, Khoramabad, Iran. ORCID: F. Moradpouri: http://orcid.org/0000-0002-1654-100X
IIStatistics and Data Science Researcher, Massachusetts Institute of Technology, Massachusetts, USA
SYNOPSIS
As exploration is time-consuming, costly, and risky, determination of the erosion surface of a metalliferous deposit before geophysical surveying and exploration drilling might be very helpful. Geochemical haloes can be used to determine whether the erosion surface is supra-ore or sub-ore and thus reduce the risk of exploration operations. The aim of this investigation is to determine the erosion surface of the North ROK porphyry deposit (NRPD) in northwestern British Columbia in Canada using linear productivity (LP), which is the content of an element defining the halo multiplied by the width of the halo. A total of 2045 soil samples from the B horizon were analysed using ICP-MS for 36 elements, including Cu, Mo, Pb, Zn, Au, As, Ag, Ni, Co, Fe, and Mn. The data-set was snalysed to obtain the statistical parameters and the elements Cu, Mo, Pb, and Zn were chosen to calculate the linear productivity and the total linear productivity. These four elements were modelled using probability plots to identify and separate subpopulations in terms of anomalous haloes and background, including the threshold values of each subpopulation. The results of the probability plot modelling and thresholds values were then used to map the distribution of each element in a GIS to calculate the linear productivity. The total linear productivity indicated that the erosion surface is supra-ore. Finally, a 3D orebody model of the Cu, Mo, Pb, and Zn distributions was constructed using borehole data and used to validate the results.
Keywords: porphyry deposit, surface erosion, probability plot modelling, linear productivity, 3D orebody modelling.
Introduction
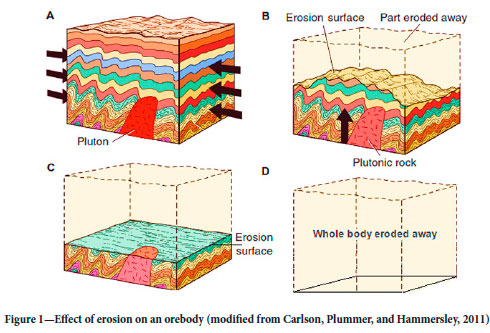
Porphyry deposits are among the world's major repositories of Cu, Au, and Mo, and thus are one of the main targets for the global mineral exploration industry (Holliday and Cooke, 2007; Chen, Huang, and Zhen, 2008; Cooke et al., 2014; Sillitoe, 2010). These deposits are usually eroded. In some cases the level of erosion is close to the Earths surface, but with deeper erosion it is possible for a part or even the whole deposit to become removed (Figure 1) (Carlson, Plummer, and Hammersley, 2011).
Information about the status and depth of deposits considering the current level of the erosion surface is the most crucial factor in decreasing the exploration risk related to costs of drilling and the probability of detecting a deposit (Grigoryan, 1974). Geochemical methods can be used to estimate the depth of the probable reserve. Multivariate geochemical analysis and determination of axial zonality and linear productivity are among the useful methods. Through calculating the axial zonality or specific ratios of linear productivity, geoscientists might be able to determine the position of the deposits (Beus and Gregorian, 1977; Grigorian, 1992; Chen and Zhao, 1998). In the first steps of a prospecting project this can help to determine the probable existing anomaly rather than using alteration studies. Soil surveys along with alteration studies complete the analysis for future decision-making. Many researchers have used the concepts of axial zonality and linear productivity for different purposes through various statistical techniques such as multivariate analysis, machine learning, and prospectivity mapping (Chen and Liu, 2000; Chen, Huang, and Zhen, 2008; Wang et al., 2013; Li et al., 2016; An et al., 2020). The aim of this investigation is to determine the erosion surface using zonality and linear productivity.
Geochemical haloes and linear productivity
The primary geochemical halo of a mineral deposit was defined originally by Safronov (1936) as an environment enriched in ore-forming and associated elements which is formed by hydrothermal processes. Thus, research on primary haloes may form part of a mineral deposit model and various methods and scales of geochemical exploration have been developed based on the theory (Beus and Gregorian, 1977; Gundobin, 1984; Xie and Yin, 1993; Hannington et al., 2003; Distler et al., 2004).
In recent years, analysis of primary geochemical haloes has become increasingly important as a reliable exploration tool for revealing the presence of hidden or non-outcropping deposits (Eilu and Groves, 2001; Goldberg, Abranmson, and Los, 2003; Li et al., 2006; Schmid and Taylor, 2009). Primary geochemical characteristics of mineral deposits provide important information for predicting deep mineral resources, as they reflect the geochemical processes of metal precipitation and mineral formation. Many methods have been used to identify primary halo characteristics of mineral deposits, including vertical element zonation, element ratios vectoring towardsS ore zones, Pearce element ratios, and alteration indices. A major aspect of these methods is the determination of the spatial distributions of single elements and/or element associations (Distler et al., 2004; Gundobin, 1984; Ziaii, Carranza, and Ziaei, 2011; Goodell and Petersen, 1984; Jones, 1992; Pirajno and Smithies, 1992; Caranza and Sadeghi, 2012; Prendegast, 2007; Wang et al., 2021).
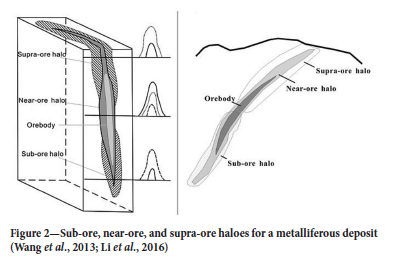
In subvolcanic deposits including porphyry, massive sulphide, and vein-hosted deposits which the intrusive igneous rocks emplaced at medium to shallow depths within the crust, the primary geochemical haloes are symmetrical and are distributed vertically above the ore for up to 1 km. The zonation series of element-indicators for porphyry copper deposits from the surface to depth is in the order Ba, As, Sb, (Ag, Pb, Zn), Au, Bi (Cu, Mo) (Sn, Co, W, Be) (Ovchinnikov and Grigoryan, 1971). The elements in parentheses may replace each other, and for a specific case the variability gradient determines the right order of these elements. The primary geochemical haloes above the main ore deposit are called supra- (or above) ore haloes, whereas the (later) haloes below the main ore deposit are called sub- (or below) ore haloes (Levinson, 1974; Cameron et al., 2004; Carranza, 2008, 2011b; Carranza, Owusu, and Hale, 2009; Wang et al., 2013). A simple schematic image of haloes and their variety is shown in Figure 2.
Linear productivity is one of the methods that use the concept of geochemical haloes. In a plane (e.g. a cross-section), the linear productivity of an element in an geochemical halo is the product of the average content of that element multiplied by the width of the halo in metres (Ovchinnikov and Grigorian, 1971). Thus, the linear productivity (LP) can be used as an indicator to recognize the current erosion surface. The linear productivity can be estimated using Equation [1]

where ca is the average of anomalies (i.e. values greater than a threshold), cb is average of the background (i.e. values less than or equal to a threshold), and d is the width of the anomalous halo (metres) in a cross-section. Levinson (1974) presented a diagram that is derived by comparing the results of linear productivity ratio for a known porphyry deposit, which can clarify the current surface (Figure 3). The total linear productivity is calculated using Equation [2], in which Pb and Zn are supra-ore elements and Cu and Mo are sub-ore elements.

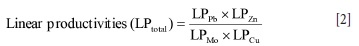
where LPPb, LPZn, LPMo, LPCu represent the linear productivities for Pb, Zn, Mo, and Cu respectively, derived using Equation [1].
The current research is aimed at determining the erosion surface at the North ROK porphyry deposit (NRPD) in Canada by means of linear productivity, using 2045 soil samples, probability plot modelling, GIS mapping, and 3D orebody modelling for validation.
Location and geological setting of the study area
The North ROK property deposits (NRPD) is located in the Stikine River area of northwestern British Columbia, or the northeast part of the Stikine Arch, within Stikine Terrane ('Stikinia') of the Canadian Cordillera. The Stikine Arch is a structural domain known for hosting late Triassic-early Jurassic, quartz-deficient alkaline and sub-alkalic intrusive rocks with associated porphyry copper-gold mineralization and peripheral gold-silver-bearing quartz veins. The centre of the property is at about UTM coordinates 447000 East and 6409330 North (NAD 83, Zone 9) or 57°49'20" north latitude and 129°53'30" west longitude. The NRPD is considered to represent an alkalic porphyry deposit lacking free quartz (quartz-deficient), with a copper-gold metal signature (no significant molybdenum) and development of strong magnetite-rich potassic and potentially calc-potassic alteration assemblages associated with copper-gold mineralization (Ash et al., 1977; Ash, MacDonald, and Friedman, 1997; Dawson and Norris; 2014).
The study area is located in the west part of the NRPD, in the northeast part of the Eddontenajon Lake (Figure 4). The main mineral occurrences in this region are as follows.

The Edon copper-gold occurrence is located in the southern portion of the area, where a 1 km χ 1.5 km gossan consisting of strong pyrite and quartz alteration occurs within a well-developed zone of propylitic alteration marked by chlorite, epidote, and pyrite. Chalcopyrite and molybdenite have been reported in the area (Ash, MacDonald, and Friedman, 1997; Mehner and Dunlop, 2010). In the north part of the area, the historical Mabon copper-gold occurrence was discovered by Chris Ash in 1997 on the northern flank of Ehahcezetle Mountain, south of Mabon Creek, where a sample of quartz-sericite-pyrite altered rock assayed 0.33% Cu and 0.42 g/t Au (Ash, MacDonald, and Friedman, 1997). It was demonstrated that the Mabon mineralized alteration zone (Mabon Zone) contains two principal types of porphyry copper-gold mineralization.
Methodology
Lithogeochemical techniques are valuable exploration tools for many porphyry and massive sulphide deposits, particularly for deeply buried systems. The standard lithogeochemical techniques identify primary alteration zones directly associated with the formation of deposits, although they do not generally distinguish whether a dispersion halo anomaly is primary, secondary, or tertiary. However, like surficial methods, various extraction methods or differential thermal analysis can potentially discriminate between primary, secondary, and tertiary dispersion haloes. Regardless of the anomaly, the dispersion haloes are useful for deep exploration because they can extend well beyond any noticeable primary alteration system.
An important point that should be considered in the interpretation of residual secondary geochemical haloes is the erosion level of a mineral deposit, since this affects the size and extent of anomalies in soil. This point has been conceptualized by different examples, variously known as the blind economic mineralization, outcropping economic mineralization, and dispersed mineralization zone models (Beus and Grigorian, 1977; Ovchinnikov and Grigorian, 1978; Solovov, 1987). Soil anomalies associated with outcropping economic mineralization would normally be stronger than those associated with blind mineralization, and they may be erroneously assumed to be more promising than others, unless the erosion levels are taken into account. Soil anomalies based on the dispersed mineralization zone model may well be similar in intensity to those associated with blind mineralization.
Soil samples
The geochemical indices for evaluation of the newly discovered anomalies are derived through studies of the primary geochemical haloes of typical ore deposits. Residual secondary soil haloes in most cases are well correlated in composition and structure with the orebodies and primary haloes that have generated them. Their successful use is related to the landscape-geochemical conditions in the ore regions.
In the NRPD study area, geochemical sampling of residual secondary haloes (as the most correlated composition with primary haloes) was carried out using a mattock, shovel, or auger to reach an appropriate depth to obtain adequate soil samples from the 'B' horizon. Line spacing varied from 200 m to 100 m and 50 m from north to the south. The location map of the soil samples is shown in Figure 5.

Statistical analysis and probability plot modelling
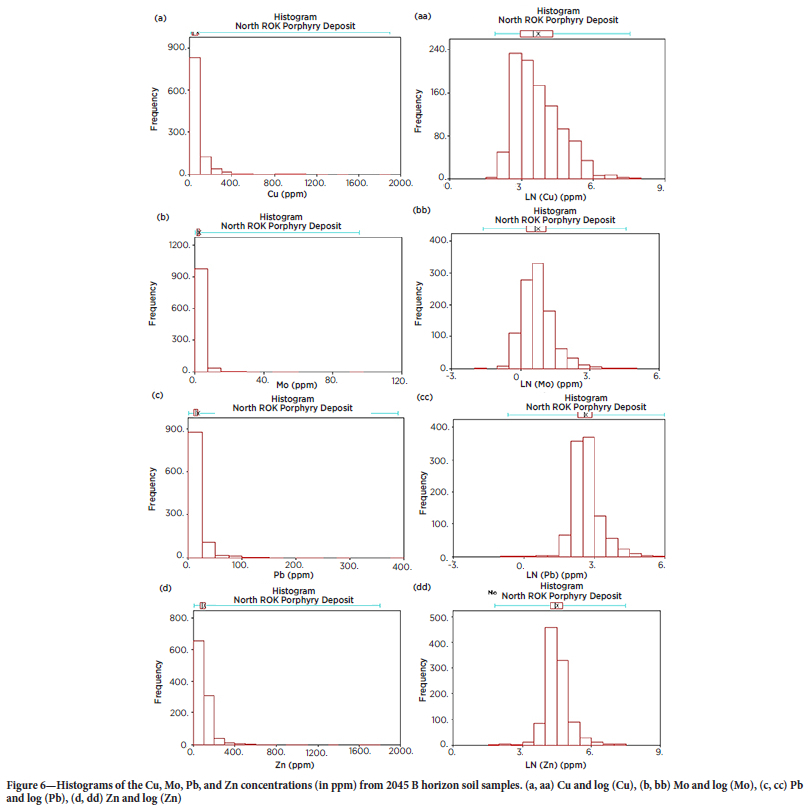
In geochemical prospecting, it is not always possible to solve a problem by studying only one element. It is common for a set of variables to interact and associate. In this case, it is necessary to study several elements together, or even other variables representative of geological or environmental phenomena. The soil samples in the current study were analysed for 36 elements by inductively coupled plasma mass spectrometry (ICP-MS). Some major elements that are indicative of the general geochemical character of the deposits and which were incorporated into the statistical analysis included Cu, Pb, Mo, Zn, Au, Ag, As, Sb, Bi, Fe, Mn, Ni, Co, Sr, Cr, Ba, and V. These elements might have a relationship with the probable Cu-Mo (Au) porphyry mineralization. Cu, Mo, Pb, and Zn were used for calculating linear productivity. The statistical parameters for soil data are listed in Table I. The frequency distributions of the data for elements that were used to calculate linear productivity are presented in Figure 6. As can be seen, the histograms show lognormal distributions and positive skewness for all four elements.
In addition to the histogram, the cumulative frequency curve (probability plot) shows the number of data-points (or, much more commonly, the percentage of the total) falling below a certain value, plotted against that value. Reimann, Filzmoser, and Garrett (2005) reported that one of the best graphical methods of displaying geochemical distribution is the cumulative probability plot, originally introduced to geochemists by Tennant and White (1959), Sinclair (1974), and , Hawkes, and Webb (1979). It is used for background and halo separation and to calculate thresholds in the geochemical data (Moradpouri and Ghavami-Riabi, 2019; Moradpouri and Hayati, 2021). Also, for the calculation of the erosion surface this could be done as halo and background separation. For this purpose, the NRPD soil data in Figure 5 was used to identify the probable anomalous halo, mixture of anomalous halo and background, and background subpopulations using probability plot modelling software by Sinclair 1974) and Sinclair and Blackwell (2004). The probability plot models for Cu, Mo, Pb, and Zn are shown in Figure 7. It is obvious that the distribution is polymodal and the separation characteristics need to be applied to each subpopulation for further details on anomaly haloes and backgrounds. The observed distribution may be described as a mixture of four subpopulations for Cu and Mo and three subpopulations for Pb and Zn. The descriptive statistics of the anomalous subpopulations thus identified are listed in Table II. For example, for Cu the four sub-populations include 3.5, 11.5, 55, and 30% of the data with maximum thresholds of 1.3825, 2.0606, 2.4425, and 3.1097 for each subpopulation respectively. Therefore, the first probability plot model is the point-based arrangement. The probability plots represented by straight lines are generated for each subpopulation and the recombination of these modelled populations yields the curve that approximates the line joining the original points (see Table II for more details on each subpopulation). The final step is revision of the first estimation by optimization steps to maximize the correspondence between points and curve with the threshold values in the lower parts of Table II. This was implemented through least-squares optimization.
Evaluation of the erosion surface and 3D orebody modelling
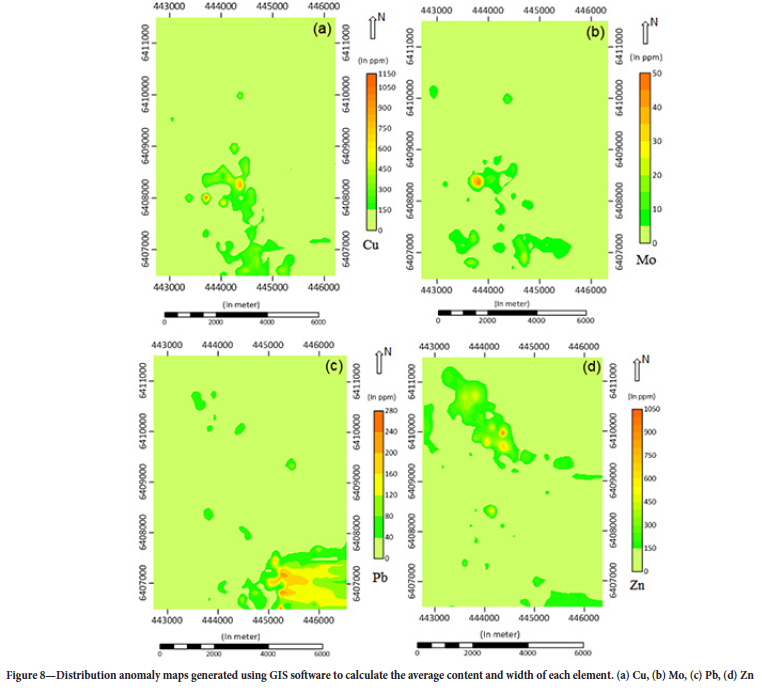
Information from probability plot modelling on anomalous haloes, backgrounds, and their related threshold values for each element is used to generate the anomaly map, which is a crucial step in calculating the linear productivity. The anomaly maps for Cu, Mo, Pb, and Zn are shown in Figure 8. These were compiled using the Esri ArcGIS 10.5 GIS software, which was also used to determine the width and element content of each anomaly for linear productivity calculation by Equation [2]. The 'widths' were calculated using an add-on tool in ArcGIS 10.5. that can calculate the width of the halo based on the content values in the direction that show the compatible transversal zonality pattern. Here, the criterion for calculating width was the results of probability plot modelling in Table II. The details on the width, average content of each elements, and the linear productivity of them are presented in Table III. Finally, the linear productivity ratio (Equation [2]) was calculated, which has the value of 9.27 (see Table III). It presents the current erosion surface that matches the upper side of the orebody as a supra-ore halo.

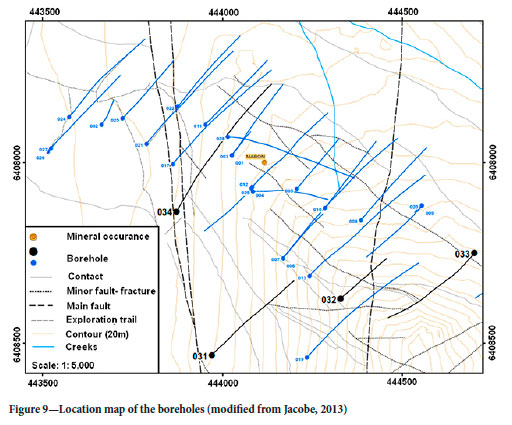
Finally, the classification of the deposit as a supra-orebody was validated using borehole information; the locations of the holes are shown in Figure 9. Based on the borehole data a 3D orebody model was constructed for the variables Cu, Mo, Pb, and Zn, which can be seen in Figure 10. These models show the different anomalies of the NRPD based on 4715 samples taken from 34 boreholes from 300 m to 600 m depth. As can be seen, the 3D models indicate good compatibility that validates the results of probability plot modelling and erosion surface calculation.

Summary and conclusions
The current research was conducted to delineate the erosion surface for the North ROK porphyry copper deposit (NRPD) in British Columbia, Canada. This was achieved using linear productivity as an indicator to identify the current erosion surface:
> Analysis of different subsets of the lithogeochemical data reveals several multi-element associations describing the mineralization and geochemical haloes present in the NRPD.
> Coexisting superimposed supra- and sub-ore elements in soil haloes indicate good potential for orebodies at greater depths. Calculated and interpolated values of linear productivity based on soil halo zoning indicate the existence of Cu porphyry resources at depth and that erosion did not remove the deposits, which was confirmed by drilling.
> Compared with the fresh porphyry rocks in this district, the mineralized rocks are enriched in Cu, Au, Ag, Mo, Pb, Zn, W, As, and Sb. Certain elements show clear anomalies, such as Zn, Ag, Cu, Au, W, and Mo. These can be regarded as pathfinders for prospecting new orebodies at depth.
> The main porphyry mineralization is generally described by a Cu-Mo-Au association. Supra- and/or near-ore haloes in mineralized altered rocks are generally characterized by an As-Sb-Ag-Pb-Zn association, whereas sub-ore haloes in altered rocks around Cu -mineralization are generally characterized by Au-Cu-Mo-W-Co.
> The ratios of indexes such as (Pb-Zn) / (Cu-Mo) decrease with depth. The values are greater in the upper levels toward the middle portion, while in the lower levels of the orebody the value is small.
The analysis of soil geochemical haloes linked with mineralization indicates its effectiveness as an exploration tool for revealing the presence (or absence) of the deposit type of interest at depth.
We recommend the use of fractal methods, along with probability plot modelling, for similar exercises in background and anomaly separation. This may lead to more accurate results.
Declarations
The authors have no conflicts of interest to declare that are relevant to the content of this article.
References
An, W., Chen, J., Chen, X., Wei, J., and Wei, Z. 2020. Ideal element distribution pattern and characteristics of primary halo in the fault-controlled ore zone of the Yidinan gold deposit, Gansu Province, China. Natural Resources Research. doi.org/10.1007/s11053-020-09646-y [ Links ]
Ash, C., MacDonald, R.W.J., Stinson, P.K., Fraser, T.M., Nelson, K.J., Arden, K.M., and Lefebüre, D.V. 1997. Geology and mineral occurrences of the Todagain Lake map area. Open File 1997-3. British Columbia Ministry of Employment and Investment, Geological Survey Branch. [ Links ]
Ash, C.H., MacDonald, R.WJ., and Friedman, R.M. 1997. Stratigraphy of the Tatogga Lake area, northwestern British Columbia. Geological Fieldwork 1996. Paper 1997-1. British Columbia Ministry of Employment and Investment, Geological Survey Branch pp. 283-290. [ Links ]
Beüs, A.A. and Grigorian, S.V. 1977. Geochemical Exploration Methods for Mineral Deposits. Applied Publishing Ltd., Wilmette, IL. 287 pp. [ Links ]
Cameron, E.M., Hamilton, S.M., Leyboürne, M.I., Hall, G.E.M., and McClenaghan, M.B. 2004. Finding deeply buried deposits using geochemistry. Geochemistry: Exploration, Environment, Analysis, vol. 4. pp. 7-32. [ Links ]
Carlson, D.H., Plümmer, Ce, and Hammersley, L. 2011. Physical Geology: Earth Revealed. 9th edn. McGraw-Hill. 645 pp. [ Links ]
Carranza, E.J. M. and Sadeghi, M. 2012. Primary geochemical characteristics of mineral deposits - Implications for exploration. Ore Geology Reviews, vol. 45. pp. 1-4. [ Links ]
Carranza, E.J.M. 2011. Analysis and mapping of geochemical anomalies using logratio-transformed stream sediment data with censored values. Journal of Geochemical Exploration, vol. 110. pp. 167-185. [ Links ]
Carranza, E.J.M. 2008. Geochemical Anomaly and Mineral Prospectivity Mapping in GIS. Elsevier, Amsterdam. 368 pp. [ Links ]
Carranza, E.J.M., Owusu, E.A., and Hale, M. 2009. Mapping of prospectivity and estimation of number of undiscovered prospects for lode gold, southwestern Ashanti Belt, Ghana. Mineralium Deposita, vol. 44. pp. 915-938. [ Links ]
Chen Y., Huang. J., and Zhen L. 2008. Geochemical characteristics and zonation of primary halos of Pulang porphyry copper deposit, northwestern Yunnan Province, southwestern China. Journal of China University of Geosciences, vol. 19, no. 4. pp. 371-377. [ Links ]
Chen, Y. and Zhao, P. 1998. Zonation in primary halos and geochemical prospecting pattern for the Guilaizhuang gold deposit, eastern China. Nonrenewable Resources, vol. 7, no. 1. pp. 37-44. [ Links ]
Chen, Y.Q. and Liu, H.G. 2000. Delineation of potential mineral resources region based on geo-anomaly unit. Journal of China University of Geosciences, vol. 11. pp. 158-163. [ Links ]
Cooke, D.R., Hollings, P., Wilkinson, J.J., and Tosdal, R.M. 2014. Geochemistry of porphyry deposits. Treatise on Geochemistry. 2nd edn. Holland, H.D. and Turekian, K.K. (eds). Elsevier. pp. 357-381. [ Links ]
Dawson, J.G and Norris, J. 2014. Geological, geochemical, geophysical and diamond drilling report on the North ROK property. Colorado Resources Ltd., Vancouver, BC. [ Links ]
Distler, VM., Yüdovskaya, M.A., Mitrofanov, G.L., Prokof'ev, V.Y., and Lishnevskii, E.N. 2004. Geology, composition, and genesis of the Sukhoi Log noble metals deposit, Russia. Ore Geology Reviews, vol. 24. pp. 7-44. [ Links ]
Eilu, P. and Groves, D.I. 2001. Primary alteration and geochemical dispersion haloes of Archaean orogenic gold deposits in the Yilgarn Craton: The pre-weathering scenario. Geochemistry: Exploration, Environment, Analysis, vol. 1. pp. 183-200. [ Links ]
Goldberg, I.S., Abranmson, G.Y.A., and Los, V.L. 2003. Depletion and enrichment of primary haloes: their importance in the genesis of and exploration for mineral deposits. Geochemistry: Exploration, Environment, Analysis, vol. 3. pp. 281-293. [ Links ]
Goodell, P.C. and Petersen, U. 1984. Julcani mining district, Peru: A study of metal ratios. Economic Geology, vol. 69, no. 3. pp. 347-361. [ Links ]
Grigoryan, S.V 1974. Prospecting and exploration of hydrothermal deposits. International Geology Review, vol. 16, no. 1. pp. 12-25. doi:10.1080/00206817409471901 [ Links ]
Gundobin, G.M. 1984. Peculiarities in the zoning of primary halos. Journal of Geochemical Exploration, vol. 21, no. 1-3. pp. 193-200. [ Links ]
Hannington, M.D., Santaguida, F., Ktarsgaard, I.M., and Cathles, L.M. 2003. Regional-scale hydrothermal alteration in the central Blake River group, western Abitibi subprovince, Canada: Implications for VMS prospectivity. Mineralium Deposita, vol. 38. pp. 393-422. [ Links ]
Holliday, J.R. and Cooke, D.R. 2007. Advances in geological models and exploration methods for copper ± gold porphyry deposits. Ore Deposits and Exploration Technology, vol. 53. pp. 791-809. [ Links ]
Jones, B.K. 1992. Application of metal zoning to gold exploration in porphyry copper systems. Journal of Geochemical Exploration, vol. 43, no. 2. pp. 127-155. [ Links ]
Li, H., Zhang, G.Y., and Yu, B. 2006. Tectonic primary halo model and the prospecting effect during deep buried ore prospecting in gold deposits. Geological Publishing House, Beijing. 146 pp. [in Chinese]. [ Links ]
Li, Y., Zhang, D., Dai, L., Wan, G., and Hou, B. 2016. Characteristics of structurally superimposed geochemical haloes at the polymetallic Xiasai silver-lead-zinc ore deposit in Sichuan Province, SW China. Journal of Geochemical Exploration, vol. 169. pp. 100-122. [ Links ]
Mehner, D. and Dunlop, D. 2010. Prospecting, silt, and rock sampling on the North ROK property, 2010. British Columbia Ministry of Energy, Mines and Petroleum Resources, Assessment. [ Links ]
Moradpouri, F. and Ghavami-Riabi, R. 2020. A multivariate geochemical investigation of borehole samples for gold deposits exploration. Geochemistry International, vol. 58, no. 1. pp. 40-48. [ Links ]
Moradpouri, F. and Hayati, M. 2021. A copper porphyry promising zones mapping based on the exploratory data, multivariate geochemical analysis and GIS integration. Applied Geochemistry, no. 132, 105051. https://doi.org/10.1016/j.apgeochem.2021.105051 [ Links ]
Ovchinnikov, L.N. and Grigoryan, S.V. 1978. Geochemical prospecting for ore deposits. International Geology Review, vol. 20, no. 12. pp. 1413-1425. [ Links ]
Ovchinnikov, L.N. 1971. Prognostic evaluation of world reserves of metals in land deposits. Doklady RAS, no. 3. pp. 683-686. [ Links ]
Ovchinnikov, L.N. and Grigorian, S.V. 1971. Primary halos in prospecting for sulphide deposits. Geochemical Exploration, vol. 11. pp. 375-380. [ Links ]
Piratno, F. and Smithies, R. H. 1992. The FeO/(FeO+MgO) ratio of tourmaline: A useful indicator of spatial variations in granite related hydrothermal mineral deposits. Journal of Geochemical Exploration, vol. 42, no. 2-3. pp. 371-381. [ Links ]
Prendergast, K. 2007. Application of lithogeochemistry to gold exploration in the St Ives Goldfield, Western Australia. Geochemistry: Exploration, Environment, Analysis, vol. 7. pp. 99-108. [ Links ]
Reimann, C, Filzmoser, P., and Garrett, R. 2005. Background and threshold: critical comparison of methods of determination. Science of the Total Environment, no. 346. pp. 1-16. [ Links ]
Rose, A.W, Hawkes, H.E., and Webb, J.S. 1979. Geochemistry in Mineral Exploration. 2nd edn. Academic Press, London. 658 pp. [ Links ]
Safronov, N.I. 1936. Dispersion haloes of ore deposits and their use in exploration. Problemy Sovetskoy geologii, vol. 4. pp. 41-53. [ Links ]
Schmid, S. and Taylor, W.R. 2009. Significance of carbonaceous shales and vanadium geochemical haloes in the exploration for rock phosphate deposits in the southern Georgina Basin, central Australia. Journal of Geochemical Exploration, vol. 101. pp. 91-92. [ Links ]
Sillitoe, R.H. 2010. Porphyry copper systems. Economic Geology, vol. 105, no. 1. pp. 3-41. [ Links ]
Sinclair, A.J. and Blackwell, G.H. 2004. Applied Mineral Inventory Estimation. Cambridge University Press. doi:10.1007/s13398-014-0173-7.2 [ Links ]
Sinclair, A.J. 1974. Selection of threshold values in geochemical data using probability graphs. Journal of Geochemical Exploration, vol. 3, no. 2. pp. 129-149. [ Links ]
Solovov, A.P. 1987. Geochemical Prospecting for Mineral Deposits. Mir, Moscow. 288 pp. [trans. Kuznetsov, V.V. [ Links ]].
Tennant, C.B. and White, M.L. 1959. Study of the distribution of some geochemical data. Economic Geology, vol. 54. pp. 1281-1290. [ Links ]
Wang, C., Carranza, E.J.M., Zhang, S., Zhang, J., Liu, X., Zhang, D., Sun, X., and Duan, C. 2013. Characterization of primary geochemical haloes for gold exploration at the Huanxiangwa gold deposit, China. Journal of Geochemical Exploration, vol. 124. pp. 40-58. doi: 10.1016/j.gexplo.2012.07.011 [ Links ]
Wang, L., Percival, J., Hedenquist, J.W., Hattori, K., and Qin, K.Z. 2021. Alteration mineralogy of the Zhengguang Au-Zn deposit, Northeast China: Interpretation of shortwave infrared analyses during mineral exploration and assessment. Economic Geology, vol. 116, no. 2. pp. 389-406. [ Links ]
Xie, X.J. and Yin, B. 1993. Geochemical pattern from local to global. Journal of Geochemical Exploration, vol. 47. pp. 109-129. [ Links ]
Ziaii, M., Carranza, E.J.M., and Ziaei, M. 2011. Application of geochemical zonality coefficients in mineral prospectivity mapping. Computational Geosciences, vol. 37, no. 12, pp. 1935-1945. [ Links ]
 Correspondence:
F. Moradpouri
Email: moradpouri.fa@lu.ac.ir
Received: 17 Feb. 2022
Revised: 12 Nov. 2022
Accepted: 24 Nov. 2022
Published: February 2023

