


Serviços Personalizados
Artigo
 Inglês (pdf)
 Artigo em XML
 Referências do artigo
Indicadores

Links relacionados
-
 Citado por Google
 -
 Similares em Google
Compartilhar

 Permalink
Journal of the Southern African Institute of Mining and Metallurgy
versão On-line ISSN 2411-9717
versão impressa ISSN 2225-6253
J. S. Afr. Inst. Min. Metall. vol.123 no.2 Johannesburg Fev. 2023
http://dx.doi.org/10.17159/2411-9717/1508/2023
PROFESSIONAL TECHINICAL AND SCIENTIFIC PAPERS
Material characteristics of Ti-6AL-4V samples additively manufactured using laser-based direct energy deposition
M.G. WillemseI; C.W. SiyasiyaI; D. MaraisIII; A.M. VenterIII; N.K.K. ArthurI, II
IDepartment of Materials Science and Metallurgical Engineering, University of Pretoria, Pretoria, South Africa. ORCID: M.G. Willemse: http://orcid.org/0000-0003-1137-2267; C.W. Siyasiya: http://orcid.org/0000-0002-1426-3149; N.K.K. Arthur: http://orcid.org/0000-0001-8400-329X
IICSIR, NLC, Laser Enabled Manufacturing Group, Pretoria Campus, 0001, South Africa
IIIResearch and Technology Development Division, The South African Nuclear Energy Corporation (Necsa) SOC Limited, South Africa. ORCID: D. Marais: http://orcid.org/0000-0001-8952-6217; A.M. Venter: http://orcid.org/0000-0003-3677-4713
SYNOPSIS
Although additive manufacturing is fast gaining traction in the industrial world as a reputable manufacturing technique to complement traditional mechanical machining, it still has problems such as porosity and residual stresses in components that give rise to cracking, distortion, and delamination, which are important issues to resolve in structural load-bearing applications. This research project focused on the characterization of the evolution of residual stresses in Ti-6Al-4V extra-low interstitial (ELI) additive-manufactured test samples. Four square thin-walled tubular samples were deposited on the same baseplate, using the direct energy deposition laser printing process, to different build heights. The residual stresses were analysed in the as-printed condition by the neutron diffraction technique and correlated to qualitative predictions obtained using the ANSYS software suite. Good qualitative agreement between the stress measurements and predictions were observed. Both approaches revealed the existence of large tensile stresses along the laser track direction at the sections that were built last, i.e., centre of the top layers of the samples. This in addition leads to large tensile stresses at the outer edges (corners) which would have the effect of separating the samples from the baseplate should the stresses exceed the yield strength of the material. Such extreme conditions did not occur in this study, but the stresses did lead to significant distortion of the baseplate. In general, the microstructures and spatial elemental mapping revealed a strong correlation between the macro-segregation of elemental V and the distribution of the β-phase in the printed parts.
Keywords: residual stresses, additive manufacturing, Ti-6Al-4V, neutron diffraction, ANSYS Additive Suite, direct energy deposition.
Introduction
Since the development of additive manufacturing (AM) in the late 1970s, rapid prototyping has been increasingly pursued as an alternative to traditional manufacturing due to its ability to produce complex geometrical shapes with lower material losses.
AM processes may lead to adverse effects such as porosity, cracking, distortion, and delamination in the solid components produced. Residual stress buildup is a major contributor to, and consequence of, these adverse effects because of the severe and rapidly varying thermal cycles the part is subjected to during the deposition and subsequent reheating stages. If not immediately alleviated, this can cause premature failure in use. During the AM process, the occurrence of delamination and distortion not only leads to untimely production delays but requires costly intervention to alter and optimize the deposition parameters. It is thus important to be able to predict such occurrences with modelling, although modelling predictions need to be adequately validated to ensure applicability and reliability.
In this project we investigated the effect of part geometry on residual stresses associated with direct energy deposition (DED)-manufactured Ti-6Al-4V components, as well as studying microstructure, composition, and hardness. The main objective was to determine the effects the material build height and subsequently the number of deposited layers had on these physical characteristics of the components. The validity of the residual stress simulations with commercial software was determined by comparing qualitative predicated results against measured values obtained by means of the neutron diffraction technique.
Literature survey
Residual stresses
Residual stresses are balancing static forces (per unit volume) that exist within a solid material due to inhomogeneous regions of mechanical deformation, thermal treatment, or volume expansion in the absence of external forces (such as gravity, applied mechanical forces or forces associated with thermal gradients). For an object at rest, these internal forces are in equilibrium, i.e., the tensile (positive) and compressive (negative) internal strain fields balance to zero. The resultant residual stresses are elastic and can be as large as the yield strength of the material (Masubuchi, 2013). When the strain fields exceed the material yield, the material deforms plastically to alleviate this, which leads to balancing elastic residual stresses.
Complicated thermal cycles are associated with the Laser Engineered Net Shaping (LENS™) additive manufacture process, which comprises heating of powders, their cooling and solidification, as well as reheating with the addition of subsequent build layers. As the material cools and solidifies inhomogeneously, localized shrinkage occurs between the melt pool and the surrounding cooler solidified material, which leads to residual stresses. These stresses may be as large as the yield strength of the material. Generally, during this inhomogeneous melting and cooling, the material deposited last leads to the development of tensile (positive) residual stress as contraction of the material is inhibited by the previously deposited solidified material. Dependent on the magnitudes of the thermal gradients and material melting temperature, Yang, Yang, and Wang (2016) showed that the thermal gradients create forces that are highly directional, leading to anisotropic stresses which correlate with the temperature gradient in the part being produced. Therefore, printing parameters need to be optimized to minimize temperature gradients during the printing process (Ngoveni, Arthur, and Pityana, 2019).
Fatigue behaviour
Residual stresses can impact the fatigue life of a part by retarding or accelerating the onset of fatigue. This becomes especially prevalent in the near-surface regions where tensile stresses adversely affect fatigue lifetime through crack initiation and propagation. When a part is in service, the total force acting on it is a combination of the external forces and forces associated with the existing internal residual stress field. Therefore, when a part that has a compressive residual stress in the near-surface region experiences an external tensile load in the same region, the total load will be the vector sum of these forces and thus is effectively reduced. If both force fields, either positive (tensile) or negative (compressive), are aligned, this will increase the total load on the part and rapidly decrease its
fatigue life (Masubuchi, 2013).
Direct energy deposition additive manufacturing technique
Direct energy deposition (DED) is a laser-based (AM) process which enables the rapid production of metal prototypes from computer-aided design (CAD) files. The LENSTM DED manufacturing process, developed by Optomec, was used in this project. Three-dimensional CAD files are input into the DED system software, which 'slices' the object model into thin two-dimensional layers. The software controls the laser that creates a heat spot at the build position, as well as the metal powder injection to form the deposition as individual layers of molten material on the baseplate (substrate that supports the build), or over an existing build top layer (substrate) to geometrically correspond to the CAD model slice. The three-dimensional object is incrementally created by sequential stacking of molten layers. The main hardware components in this process include the high-power laser (which provides the heat source) and the material powder which is deposited directly into the heat spot to form the melt pool that solidifies to produce the new layer. The thickness of these layers is normally in the order of hundreds of micrometres and is defined by the user taking into account the deposition rate and laser focus requirements.
Ti-6Al-4V
Ti-6Al-4V ELI ('extra-low interstitial, which refers to the low oxygen and iron content to improve the ductility and fracture toughness) (Roy et al., 2018) is a high-purity commercial grade titanium alloy used for medical applications such as orthopaedic pins and screws, surgical staples, etc. It has a superior strength-to-weight ratio and is corrosion resistant, which makes it suitable for high-pressure cryogenic vessels and aerospace components (Arthur and Pityana, 2018).
Titanium alloys are heat treatable and consist of two main phases: α- phase at ambient temperature and pressure, which has a hexagonal close-packed (hcp) crystal structure; Above 890 °C, an allotropic transformation occurs to the β-phase which has a body centred cubic (bcc) crystal structure (Callister and Rethwisch, 2015). The β-phase is stabilised by elements such as molybdenum, niobium, chromium, iron and vanadium and is known to have a softer crystal structure than that of the α-phase, which is attributed to the presence of a higher amount of slip planes (Liu and Shin, 2019). This suggests that an increased volume fraction of β-phase in the alloy leads to an increase in its ductility (Liu and Shin, 2019). The α-phase, on the other hand, is stabilised by elements such as aluminium, tin, carbon, oxygen, and nitrogen. The phase proportions are dependent on the thermal processing. In addition, by adding alloying elements, the phase proportions can be altered to give rise to specific phases (Peters et al., 2001), which in turn determines the mechanical properties of the material (Yumak and Aslantas, 2020).
Experimental procedure
Simulations
Qualitative residual stress simulations associated with the DED process were performed with the ANSYS Additive Manufacturing Simulation Suite (ANSYS 2019 R3). This software is an engineering simulation and 3D design package that enables visualization of the effect of real-world physical phenomena on a given part or body prior to manufacture. This can assist in optimizing the manufacturing process by detecting and mitigating adverse consequences in the design constraints before the part is produced. The software can simulate effects applicable to fluids, materials optics, materials, structures, and complete systems. For additive manufacture, it enables optimization of build planning related to the topology of the additively manufactured part and automatically inserts support structures where needed. In addition, it enables predictive validation of the microstructure, part distortion, residual stress formation, and porosity formation as a function of a given printing parameter. Spatial resolution is defined by the mesh sizes in the simulations.
Additive manufactured samples
The AM work was performed at the National Laser Centre (NLC), Council for Scientific and Industrial Research (CSIR), Pretoria using an Optomec LENS™ 850-R system fitted with a 1 kW IPG fibre laser (Kumar and Pityana, 2011). Four samples were sequentially built on the same baseplate as shown in Figure 1. Two sets of square tube samples with edges 25 mm long and the tested wall thickness of 6.5 mm were made to different build heights: 10 mm and 25 mm. In addition, each set comprised geometries with sharp corners, as well as with 2 mm filleted outside corners. Depositions were performed as 650 μm wide (x and y directions) and 300 μm high (z direction) layers. The sample wall thicknesses (y-direction) were therefore achieved with 10 side-by-side depositions.
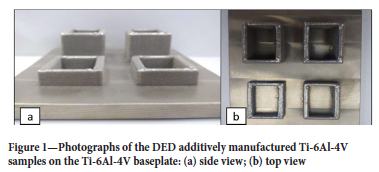
All samples were printed on a sandblasted and cleaned Ti-6Al-4V substrate plate with dimensions of 150 χ 150 χ 10 mm3. The laser power was 360 W, and the laser translated at a speed of 10.58 mm/s. The powder feed rate used was 2.51 g/min. All printing parameters used were from Arthur et al. (2016). All subsequent investigations were performed on the as-built samples retained to the baseplate.
Neutron diffraction
Residual stress investigations were performed with the neutron diffraction technique using the MPISI instrument at the SAFARI-1 research reactor operated by the South African Nuclear Energy Corporation (Necsa) SOC Limited (Venter et al., 2018). The technique uses the penetrating and diffraction capabilities of thermal neutrons to perform nondestructive investigations of the as-built samples without surface preparation. The instrument was configured to diffract a 1.647 Å wavelength neutron beam from its Si(331) monochromator at a take-off angle of 83.5° through the chamber exit port. All investigations were performed with a neutron gauge volume of 3 χ 3 χ 5 mm3. The diffracted intensities from the neutron gauge volume at the different measurement positions and sample orientations were measured with a 2D position-sensitive detector set at a centre angle of 76.10° that enabled detection of the Ti(103) α-phase reflection. The interplanar (d) spacing was calculated from the peak centre angle fits, using the Bragg equation.
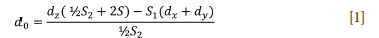
Lattice strain values were calculated by referencing respective d-spacings at each measurement position to a stress-free (do) value determined from Equation [1].
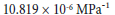
Stress values were calculated from the strain values by incorporating the relevant diffraction elastic constants for the reflection. Values used were 
Results are reported as the spatial distributions of the residual stress along the sample lengths and heights in each of the three orthogonal directions of the walls of the printed components. This allows direct comparison to the predictions of the ANSYS simulations.
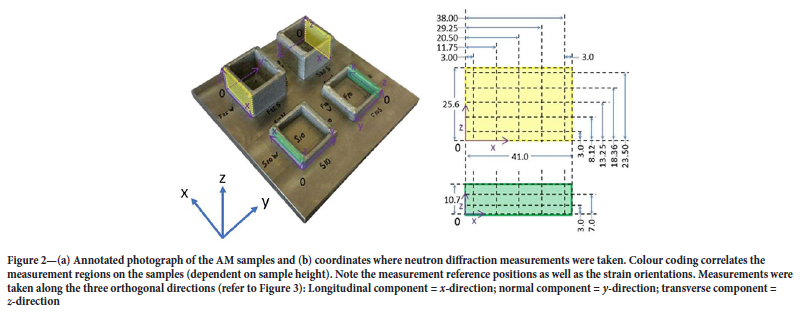
Figure 2 illustrates the sample sections that were investigated with neutron diffraction together with the corresponding measurement grids. Due to the weak diffracted intensities from the material (titanium has a negative scattering length; net intensity is thus from the aluminium content in the material) (Hu et al., 2020), a relatively large neutron gauge volume (3 χ 3 χ 5 mm3) had to be employed to ensure data acquisition in a reasonable time of 1 hour per measurement position. The instrumental gauge volume was determined by scanning a 2 mm Fe pin across the beam and was confirmed to be within 10%-gauge of the nominal volume definition criterion. Taking cognisance of the sample geometries and thus symmetries, one wall per sample was investigated to further reduce the overall measurement time. All measurements were taken with fully submerged gauge volumes and centralized on the wall thicknesses (y-directions). Stress values were thus averaged over the gauge volume used in analyses and had an experimental uncertainty of ±50 MPa, determined by the fit accuracies of the diffraction peaks.
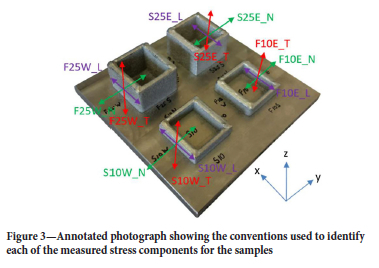
A naming convention was adopted to identify the measurement areas of the samples. The first letter of the name identifies the corner shape, the number represents the sample height, while the last letter represents the cardinal direction (as indicated in Figures 2 and 3). Thus, the samples labelled S10W and F10E represent the sharp cornered samples of 10 mm height, measured along the west direction and the fillet cornered samples of 10 mm height, measured along the east direction, respectively.
Hardness
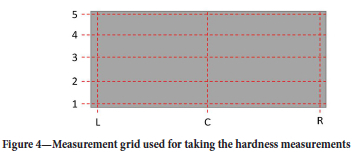
One surface of each sample was polished using standard metallographic techniques with colloidal silica to provide surfaces that were flat and smooth to within 3 μm. Vickers microhardness tests were performed on these polished surfaces of the sample outside walls to determine the influence of the build height (and thus sequential reheating) on the sample hardness. Measurement positions were along the left (L), right (R), and centre line (C) sections of each sample and separated along the build height into four equidistant regions (Figure 4). Each region was measured three times along the intersecting lines of the grid with average values visualized as spatial maps. All hardness tests were conducted using a load of 500 g.
Scanning electron microscopy (SEM)
The outer polished sample surfaces were recorded with high-magnification SEM images and the material composition was determined with energy dispersive X-ray spectroscopy (EDS) analyses at regions that corresponded with the hardness measurements. Investigations were performed with a Jeol JSM IT300 instrument with an Oxford X-max 50 EDS detector. All SEM-EDS data was processed using the Oxford AZtec software. Measurement positions corresponded with the hardness maps. Only one sample of each build height could be investigated due to time constraints.
Results
Neutron diffraction
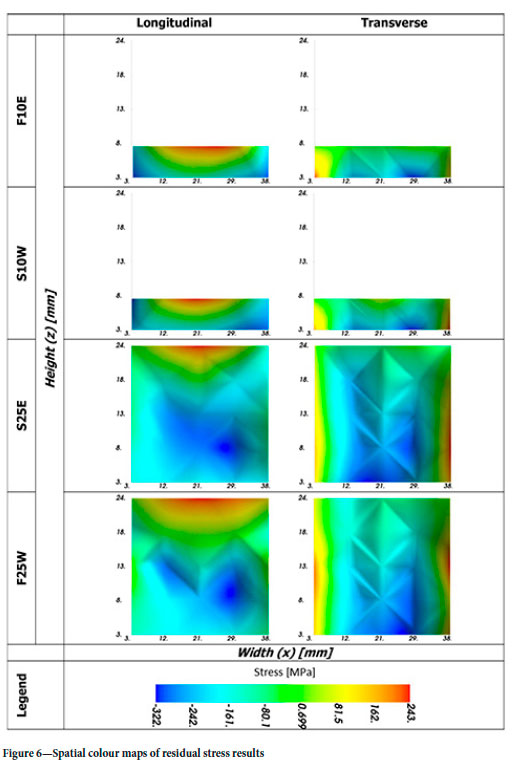
Figure 5 and Figure 6 show the results from the neutron diffraction experiments, whereby the residual stress results are given in Figure 5 and Figure 6 displays the results as spatial colour maps. The figures show contour plots of the measured longitudinal and transverse residual stress components on the outer wall faces indicated in Figure 2(a). The following observations were made:
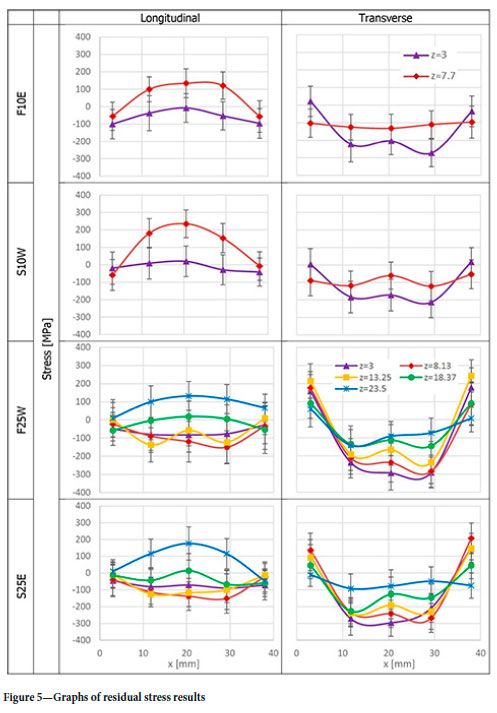
> A maximum compressive stress of ~320 MPa and maximum tensile stress of ~240 MPa was observed.
> In all samples the stress variations along the x-direction (along the wall lengths) were qualitatively the same, having symmetrical trends about the wall mid-lengths and build heights.
- There was no difference in the stress magnitudes in the sample with respect to build height. This may be a result of all four samples being printed on the same baseplate and that the high energy input of the multiple prints induced a type of heat treatment and allowed the stresses to relax.
- In the case of the longitudinal stress components (x-direction), the stresses were close to zero at the corners and tensile at the wall mid-lengths. The maximum tensile stresses were located in the top 5 mm of the sample heights. In the 25 mm high samples, the stresses were predominantly compressive from the baseplate to a height of approximately 18 mm.
- The transverse stresses were more complex, being tensile at the corners and generally compressive at the wall mid-lengths.
- Along the z-direction (build direction), the stresses for the longitudinal component became more tensile with height, while the transverse stress values decreased (became less compressive) with height, as expected (Masubuchi, 2013).
> These two stress components thus had opposing trends with height above the baseplate.
- The transverse stress components (z-direction) showed the development of significant tensile stresses at the corners. These stresses were approximately 200 MPa until about 50% of the wall height, thereafter the values decreased with increasing height.
- The transverse components had significant compressive stresses at the mid-wall lengths that were largest closest to the baseplate and decreased with build height.
> Thus, significant tensile stresses existed along the longitudinal direction (x-direction) in the central sections of the top layers. This led to the development of tensile stresses along the transverse directions in the corners where the samples were attached to the baseplate. This would lead to delamination of the built structure from the baseplate if the yield stress of the material were exceeded. This maximum in the tensile transverse stress extended to most of the sample height. The baseplate was significantly bent towards the build planes. This indicated that the baseplate was being deformed plastically by the stresses associated with the additive manufactured parts.
> No significant differences were observed in the stress values and trends for the two corner shapes, sharp (S25E and S10W) and filleted (F25W and F10E). Since the closest measurement positions to the corners in the neutron investigations were 3 mm, it can be concluded that the influence of the corner shape did not extend further than 3 mm from the corners.
Figure 6 indicates similar stress results along the walls of the samples with sharp (S25E and S10W) and filleted (F25W and F10E) corners, i.e., the corner geometries had no long-range effect on the residual stresses in the walls. Measurements at each position were done with the gauge volume centred on the wall thicknesses, and for the longitudinal and transverse orientations to correspond with Figure 3.
Simulations
To ensure correlation between the simulated and measured stress results, a mesh size of 6.5 χ 6.5 χ 6.5 mm3 was set in the ANSYS Additive Suite simulations. The baseplate was assumed to be a rigid structure, i.e., without any deflection. The model was also set up for the case where each sample was built individually at the centre of its own baseplate. Stress values are given in the figures to provide a correlation between samples with different build heights. Taking account of the assumptions, only the qualitative trends are valid for the comparison with the stresses measured with neutron diffraction. For this mesh size, the simulations of the sharp corner and filleted corners did not lead to any stress differences.
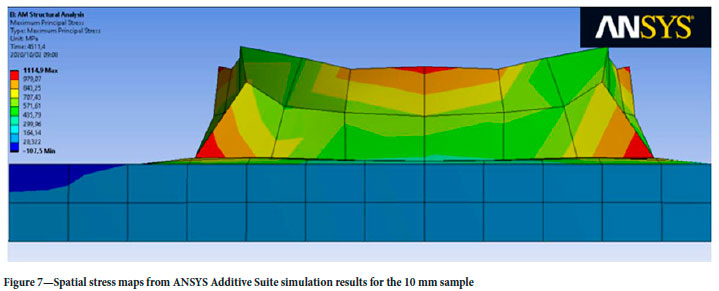
Figure 7 and Figure 8 respectively shows the spatial stress maps for the transverse component generated in the ANSYS simulations for the 10 mm and 25 mm samples. However, the influence of the corner geometries could not be resolved when using a 6.5 χ 6.5 χ 6.5 grid size. Furthermore, it was observed in the simulations that the 10 mm samples showed tensile stresses towards the lower wall corner edges and top midsection. Although compressive stresses were identified, this was more prevalent from the bottom midsection to about half the sample height and the top corner edges (as shown in Figure 7).
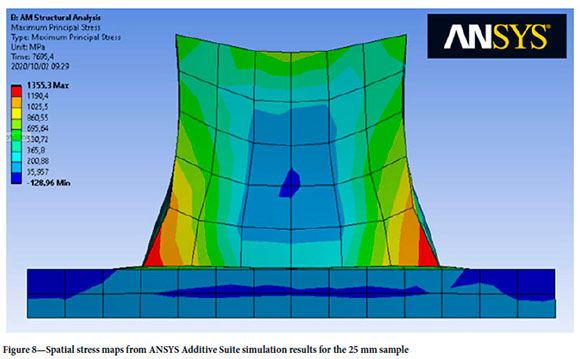
The 25 mm samples were generally compressive, in contrast to the 10 mm samples, with the lower wall edges showing some tensile stress, similar to the 10 mm samples. The top midsection of the 25 mm sample showed minimal tensile stress magnitude, however, the central region of the sample showed a significant compressive stress magnitude of approximately 300 MPa. Similar observations were made with the neutron diffraction experiments. Thus, it can be concluded that the experimental and simulation results compare well.
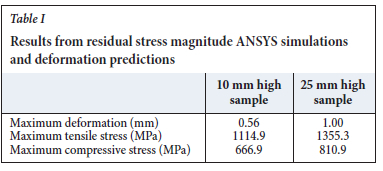
Table I shows the difference in the stress magnitudes (purely for comparison to enable correlation between the different sample heights) for the 10 mm and the 25 mm high samples. In the simulations, the stress magnitudes increased along the print height. The maximum distortion shows longitudinal shrinkage along the laser track (x-direction) which increased as the build height increased.
Qualitative comparison between simulation and neutron diffraction stress results
Stress components
It should be realized that the ANSYS simulation results are spatial maps of the hydrostatic stresses that consists of all three stress components and the neutron diffraction results are resolved for each tri-axial component individually. Therefore, the ANSYS simulations are a combination of all three stress components, which is represented individually in the neutron diffraction and each component will contribute to a region's residual stresses formation. Using the ANSYS software, the principal stress vectors within the samples were determined and are shown qualitatively using red arrows (larger arrows have been added to ensure legibility). This is indicated for the 25 mm high sample with sharp corners at the bottom corner (attachment to the baseplate) in Figure 9, and at the top central surface in Figure 10. Figure 9 and Figure 10 show the longitudinal stress component acts in the x-direction and the transverse stress component in the z-direction.
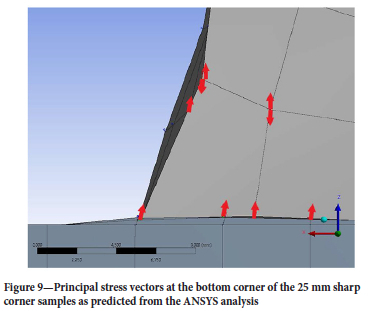
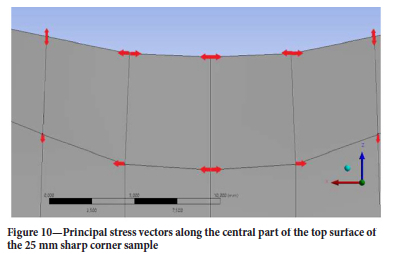
In Figure 9, the principal stresses at the bottom corners are represented by the red arrows and were in the z-direction, directly correlating with the transverse stress component results of neutron diffraction. Results at the central part of the top section, Figure 10, revealed that the principal stress shown by the red arrows were in the x-direction, directly correlating with the longitudinal stress component results of neutron diffraction. Qualitatively similar results were predicted for the 10 mm samples.
Microstructures
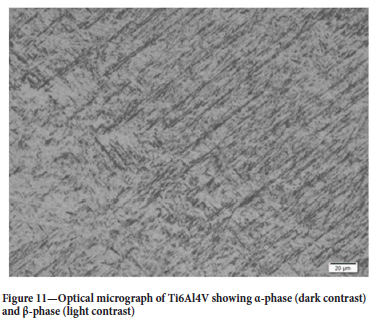
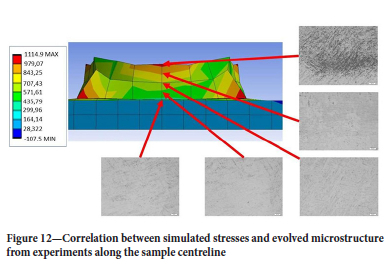
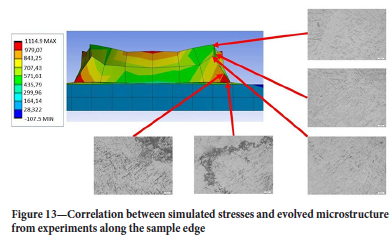
Figure 11 shows an optical micrograph of the typical microstructure of the Ti6Al4V samples in the as-built condition. Figure 12 and Figure 13 illustrate the ANSYS simulation of the 10 mm high sample with the corresponding microstructures identified from experimental results. Figure 12 illustrates how the microstructure varies along the centre line of the sample based on the change in stress magnitude, while Figure 13 illustrates a similar change identified along the sample edge. By examining Figure 12 and Figure 13 it was evident that the amount of α-phase (darker phase) increased as the stress became more tensile. This was evident for all four samples. This suggests that the high stress regions (bright red regions) influenced the microstructural evolution since the regions identified from simulations and confirmed to be tensile stress regions showed an increased presence of α-phase (darker phase), while the regions from simulations that showed compressive stresses revealed less of the darker α-phase. This was analysed in the centreline and along the edge of the four samples and found to be consistent. Thus, the simulation and experimental results compare well.
Hardness
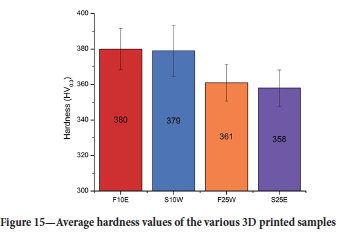
The grid where hardness measurements were taken is the same as used in the microstructure study shown in Figure 4. Figure 14 shows the hardness profile measured along the midsection of the build height of the 3D printed samples, while Figure 15 shows the average hardness values measured for each sample. It can be observed that the hardness was proportional to the residual stress magnitudes, particularly for the transverse component. The 10 mm samples reported higher average hardness values of 380 (F10E) and 379 HV0.3 (S10W) compared to the 25 mm samples, which reported 361(F25W) and 358 HV0.3 (S25E). This was attributed to the effects of cooling rates due to size of samples (larger samples cool slower) and the material hardness of samples under slower cooling effects (slower cooling results in lower hardness) (Kalpakjian and Schmid, 2014). Also, it was postulated that the average hardness values were a result of the nature of the stresses, since the larger samples were generally compressive (25 mm reported lower hardness) and the smaller samples were more tensile (10 mm reported higher hardness), however this was inconclusive.
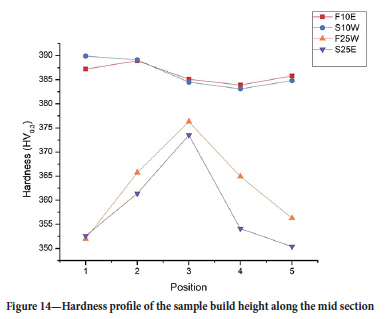
The hardness profiles seen in Figure 14 appeared to be proportional to the stress magnitudes, as the stress curve behaviour for the 10 mm samples of the transverse component showed similar behaviour to its corresponding hardness profile, while the 25 mm hardness profile also resembled its corresponding stress curve behaviour (see Figure 5). This was further confirmed through a similar peak in hardness observed at position three (sample centre) of samples F25W and S25E. This position corresponded to the region observed to display the highest compressive stress magnitude in both experimental and simulation results.
SEM
The elemental distributions are shown in Table II for the samples with 10 mm and 25 mm heights. In general, the elemental compositions reported for the 3D printed parts satisfied ASTM standards (ASTM F136-13). However, no clear correlations to the stress type and magnitude were observed. Aluminium is known to be a very strong alpha-stabilizer, as reported by Callister and Rethwisch (2015), while Poondla et al. (2009) states that the stabilizing and strengthening effect of aluminium and oxygen trace amounts positively affects hardenability and enhances the alloy response towards heat treatment when alloyed with Ti. Vanadium, however, is known to be a very strong beta-stabilizer when alloyed with Ti (Arrazola et al, 2009; Peters et al, 2001), which results in an alloy that exhibits high strength and high toughness and is better suited for high temperature applications (Peters et al., 2001).
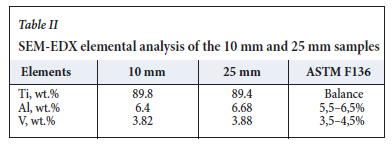
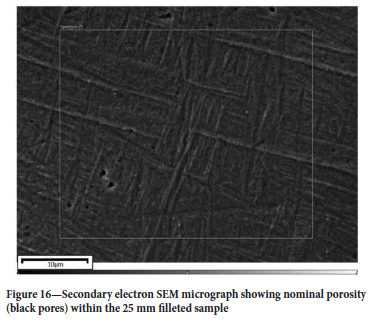
Figure 16 is a SEM micrograph showing small pores within the 25 mm sample. Most of the micrographs showed some degree of porosity.
Discussion
Stress relaxation
The tensile stress gave rise to a reactive tensile stress where the samples were attached to the baseplate. In extreme cases, these stresses can result in 'tearing' of the baseplate. The reactive stresses caused plastic deformation of the baseplate, which in turn caused a certain degree of stress relaxation.
Simulations
When comparing the residual stresses from the two independent stress components measured by the neutron diffraction investigations (Figure 6) to the simulated principle stress vectors (Figure 9 and Figure 10) the simulation spatial stress map is a combination of these two components. The top middle tensile region in the simulation was created by the longitudinal component associated with the longitudinal contraction along the laser path, and the tensile region in the bottom corners were derived from the transverse component which is a reactive stress to the longitudinal stresses at the top surface. The compressive region in the centre bottom was from the transverse component. Thus, very good qualitative agreement existed in the stress trends and origins, indicating that the software gave good qualitative predictions of the major stress concentrations and subsequent problem areas. Decreasing the mesh volume in the simulation software would greatly decrease the discretization error, which would greatly improve the spatial resolution and will greatly increase the accuracy of the simulated corner stresses.
Due to time constraints, the ANSYS model could not be refined. The following parameters need to be accounted with future modelling for the specific geometries of this study:
> Baseplate being shared by the four samples, and thus not independent systems
> Deformation of the baseplate
> Reducing the size of the model mesh to account for the corner geometries
> Quantifying and considering the sample porosity
> Quantifying and considering inhomogeneous material compositions.
Neutron diffraction
The neutron gauge volume should also be decreased to ensure a higher special resolution and would increase the testability of the stresses in the corner sections.
SEM
The vanadium content was indirectly proportional to the fraction of β-phase present in the samples. This might be due to the higher aluminium content measured throughout the samples. The porosity can greatly affect the comparability between the actual stresses (neutron diffraction results) and that of the Ansys results (simulated results). The simulation assumed that the sample material was completely homogeneous and porosity free.
Conclusions
Four Ti-6Al-4V ELI 25 mm square sample tubes with 6 mm wall thicknesses were additively manufactured by the DED process and was printed on a shared Ti-6Al-4V baseplate to 10 mm and 25 mm heights. All samples were investigated whilst attached to the baseplate. Significant deformation of the baseplate was observed, without obvious delamination or distortion of the samples. The residual stress distributions along one wall of each of the four samples were investigated. FEM using a similar grid to the neutron study was performed with ANSYS assuming that each sample was manufactured on its own baseplate, and without distortion of the baseplate. There were good qualitative agreements between the stress measurements and FEM simulations. Large tensile stresses developed along the central length of the topmost layers due to longitudinal contraction. Modelling predicted that this would lead to distortion of the sample that would become more severe with build height. The gauge and grid volumes employed were not able to distinguish any influences of the corner geometries.
By looking at the microstructures as the region's spatial stress map becomes more tensile, the hardness will decrease. The hardness is inversely proportional to that of the stress magnitudes. This corresponds well with literature and the hardness can be predicted with the help of the simulations/neutron diffraction spatial stress maps.
Recommendations for future studies
> Decrease the mesh volume with the ANSYS analyses to search for possible influences by the corner geometries. Also, the complete sample geometry needs to be analysed, i.e., square tube geometry.
> The practical neutron gauge volume that can be used is limited. A synchrotron radiation study should be pursued where micron sized gauge volumes can be employed and thus render better spatial resolution, especially in the corner sections.
> Each sample should be printed on its own baseplate, to ensure that a sample is only subjected to its own heat input and not the subsequent prints heat inputs following it.
> Each sample should be printed on a thicker baseplate to ensure that no warpage of the baseplate can occur.
> Complete a full porosity analysis of the samples and investigate the effect of the porosity on the residual stresses.
Acknowledgements
> CSIR, NLC, Laser Enabled Manufacturing Group for the use of their manufacturing facilities.
> Necsa SOC Ltd is acknowledged for the access and use of their neutron diffraction equipment.
> Mr SS Mahlalela, Lab Manager at the University of Pretoria's Mineral Sciences Department, for all his assistance in the sample preparation.
References
ANSYS. 2020. Additive manufacturing simulation. https://www.ansys.com/products/structures/additive-manufacturing [accessed 24 March 2020]. [ Links ]
Arrazola, P.J., Garay, A., Iriarte, L.M., Armendia, M., Marya, S., and Le Maitre, F. 2009. Machinability of titanium alloys (Ti6Al4V and Ti555.3)., Journal of Materials Processing Technology, vol. 209. pp. 2223-2230. [ Links ]
Arthur, N., Malabi, K., Baloyi, P., Moller, H., and Pityana, S. 2016. Influence of process parameters on layer build-up and microstructure of Ti6Al4V (ELI) alloy on the optomec LENS. Proceedings of the 17th Annual Conference of the Rapid Product Development Association of South Africa (RAPDASA). https://researchspace.csir.co.za/dspace/bitstream/handle/10204/8992/Arthur_2016.pdf?sequence=1 [ Links ]
Arthur, N.K. and Pityana, S. 2018. Microstructure and material properties of LENS fabricated Ti-6Al-4V components. R &D Journal, vol. 34. pp.33-36. [ Links ]
ASTM International F136-13. 2013. Standard Specification for Wrought Titanium-6Aluminum-4Vanadium ELI (Extra Low Interstitial) Alloy for Surgical Implant Applications [ Links ]
Callister Jr, W.D. and Rethwisch, D.G. 2015. Callister's Materials Science and Engineering. 9th edn. Wiley. pp. 451-453. [ Links ]
Hu, Y.N., Wu, S.C., Wu, Z.K., Zhong, X.L., Ahmed, S., Karabal, S., Xiao, X.H., Zhang, H.O., and Withers, P.J. 2020. A new approach to correlate the defect population with the fatigue life of selective laser melted Ti-6Al-4V alloy. International Journal of Fatigue, vol. 136. p.105584. [ Links ]
Kalpakjian, S. and Schmid, S.R. 2014. Manufacturing Engineering and Technology. Jurong, Singapore: Pearson Education South Asia Pte Ltd. [ Links ]
Kumar, S. and Pityana, S. 2011. Laser-based additive manufacturing of metals. Advanced Materials Research, vol. 227. pp. 92-95. [ Links ]
Liu, S. and Shin, Y. C. 2019. Additive Manufacturing of Ti6Al4V Alloy: A Review, Materials and Design, vol. 164. 107552. [ Links ]
Liu, Yang, Yongqiang Yang, and Di WANg. 2016. A study on the residual stress during selective laser melting (SLM) of metallic powder. The International Journal of Advanced Manufacturing Technology, vol. 87, no. 4. p. 647. [ Links ]
Masubuchi, K. 2013. Analysis of Welded Structures: Residual Stresses, Distortion, and their Consequences. 33nd edn. Elsevier/Oxford. [ Links ]
Moletsane, M.G., Krakhmalev, P., Kazantseva, N., du Plessis, A., Yadroitsava, I., and Yadroitsev, I. 2016. Tensile properties and microstructure of direct metal laser-sintered Ti6Al4V (ELI) alloy. South African Journal of Industrial Engineering, vol. 27, no. 3. pp.110-121. [ Links ]
Ngoveni, A.S., Arthur, N.K.K., and Pityana, S.L. 2019. Residual stress modelling and experimental analyses of Ti6Al4V ELI additive manufactured by laser engineered net shaping. Procedia Manufacturing, vol. 35. pp. 1001-1006. [ Links ]
Optomec. 2016. LENS 850-R. https://optomec.com/wp-content/uploads/2014/04/LENS_850-R_Datasheet_WEB_0816.pdf [accessed 19 March 2020]. [ Links ]
Peters, M., Hemptenmacher, J., Kumpfert, J., and Leyens, C. 2001. Structure and properties of titanium and titanium alloys. Titanium and Titanium Alloys. Wiley-VCH, Weinheim, Germany. pp. 1-35. [ Links ]
Poondla, N., Srivatsan, T.S., Patnaik, A., and Petraroli, M. 2009. A study of the microstructure and hardness of two titanium alloys: Commercially pure and Ti-6Al-4V. Journal of Alloys and Compounds, vol. 486, no. 2. pp. 162-167. [ Links ]
Roy, S., Joshi, K.K., Sahoo, A.K., and Das, R.K. 2018 Machining of Ti-6Al-4V ELI alloy: A brief review. IOP Conference Series: Materials Science and Engineering, vol. 390, no. 1. p. 12112. [ Links ]
Sibisi, P.N., Popoola, A.P.I., Arthur, N.K.K., Pityana, S.L., and Popoola, O.M. 2019. Morphological characterization of recycled powder and microstructures of Ti-6Al-4V components synthesized by LENS additive manufacturing. IOP Conference Series: Materials Science and Engineering, vol. 655, no. 1. p. 12019. [ Links ]
Venter, A.M., van Heerden, P.R., Marais, D., and Raaths, J.C. 2018. MPISI: The neutron strain scanner materials probe for internal strain investigations at the SAFARI-1 research reactor. Physica B: Physics of Condensed Matter, vol. 551. pp. 417-421. [ Links ]
Xu, M., David, J.M., and Kim, S.H. 2018. The fourth industrial revolution: Opportunities and challenges. International Journal of Financial Research, vol. 9, no. 2. pp. 90-95. [ Links ]
Yumak, N. and Aslantas, K. 2020. A Review on Heat Treatment Efficiency in Metastable β Titanium Alloys: The Role of Treatment Process and Parameters. Journal of Materials Research and Technology, vol. 9, no. 6. pp. 15360-15380. [ Links ]
Zhai, Y., Galarraga, H., and Lados, D.A. 2016. Microstructure, static properties, and fatigue crack growth mechanisms in Ti-6Al-4V fabricated by additive manufacturing: LENS and EBM. Engineering Failure Analysis, vol. 69. pp. 3-14. [ Links ]
 Correspondence:
M.G. Willemse
Email: mattianw@gmail.com
Received: 8 Feb. 2021
Revised: 15 Jun. 2021
Accepted: 3 Jul. 2021
Published: February 2023

