


Services on Demand
Article
 English (pdf)
 Article in xml format
 Article references
Indicators

Related links
-
 Cited by Google
 -
 Similars in Google
Share

 Permalink
Journal of the Southern African Institute of Mining and Metallurgy
On-line version ISSN 2411-9717
Print version ISSN 2225-6253
J. S. Afr. Inst. Min. Metall. vol.123 n.2 Johannesburg Feb. 2023
http://dx.doi.org/10.17159/2411-9717/1890/2023
PROFESSIONAL TECHINICAL AND SCIENTIFIC PAPERS
Hyperspectral core scanner: An effective mineral mapping tool for apatite in the Upper Zone, northern limb, Bushveld Complex
H. Mandende; C. Ndou; T. Mothupi
Council for Geoscience, Pretoria, South Africa
SYNOPSIS
The technological advances in efficient, rapid, and non-destructive hyperspectral core logging systems for systematic mineral mapping have led to the discovery and exploitation of new mineral deposits Hyperspectral imaging in the long-wave infrared range has been recently used successfully to identify various phosphate-bearing minerals (monazite, xenotime, and britholite), with limited work on apatite associated with mafic-ultramafic layered intrusions. In this study we investigate the effectiveness of a hyperspectral imaging (HSI) system with long-wave infrared (LWIR) bandwidthsto identify apatite in the Upper Zone of the Bushveld Complex. The accuracy of the HSI results was validated by mineralogical and geochemical data. The two apatite-enriched zones detected by HSI suggesting widespread development of apatite throughout the uppermost 600 m of the Upper Zone. The lower apatite-enriched zone is approximately 40 m thick, while the upper apatite-enriched zone is about 23 m thick, consistent with previous thickness determinations by traditional logging and analytical methods. Spectral mixing observed in the response of apatite is ascribed either to the common association of apatite and olivine in these rocks, or to differences between the spatial resolution of the hyperspectral image and the size of apatite grains. The VNIR-SWIR wavelength region did not show prominent spectral features of apatite. Nonetheless, HSI in the LWIR range is effective in mapping apatite and should therefore be considered as an exploration tool. This research advances our knowledge of the reflectance spectroscopy of REE-bearing minerals, which makes it easier to detect, identify, and quantify REE-bearing silicate minerals by HSI.
Keywords: HSI, hyperspectral imaging system, long-wave infrared, apatite, Bushveld Complex.
Introduction
The transition to cleaner energy technologies will see an increase in the demand for critical elements, including the tare earth elements (REEs), due to their importance in low-carbon technologies, particularly solar photovoltaic (PV), wind, and geothermal energy generation. This, combined with the uneven global distribution (China produces approximately 81% of global REE output) has led to a search for potential new sources of REEs. Apatite is in an important mineral in mafic-layered intrusions, often occurring as a cumulus phase in the uppermost highly fractionated Fe-Ti oxide-rich lithological units. Apatite can incorporate a wide spectrum of elements (e.g., F, Cl, S, REEs, Th, U, P, Sr, Pb, Mn, and Nd isotopes), which can be used to constrain magmatic processes, determine magma sources, and trace magma evolutionary paths in mafic layered intrusions. More than 0.35% REEs is typically present in magmatic apatite (Ihlen et al., 2014; Decree et al., 2022), sometimes reaching substantial concentrations - up to ~19 wt% REE2O3 at Pajarito Mountain, New Mexico (Roeder et al., 1987; Hughes, Cameron, and Mariano, 1991). In the Upper Zone of the Bushveld Complex, apatite is an important cumulus mineral high in the sequence (at depths above about 600 m) within the uppermost olivine-bearing ferrodiorites (Ashwal, Webb, and Knoper, 2005) above the topmost magnetite layer 21. In this study, apatite is of particular interest because it is a potential source of REEs and phosphates, with up to 7 000 ppm REE content in apatite reported from the eastern limb of the Complex and an estimated resource potential of several billion tons of ore grading about 20 vol% combined ilmenite and apatite (von Gruenewaldt, 1993).
Traditional methods for determining the mineralogical and ore characteristics of apatite, for example by logging drill core, are usually time-consuming, qualitative, subjective, and require the use of expensive complementary laboratory-based techniques such as chemical assays and detailed mineralogical analyses which include meticulous sample preparation requirements.
Reflectance spectroscopy, a rapid non-destructive analytical technique with minimum sample preparation requirements, has been successfully used to study the reflectance of phosphate minerals in the visible to short-wave infrared regions (Turner, Rivard, and Groat2014, 2016; Turner, 2015; Laakso et al., 2018, 2019). These investigations have mainly focused on monazite, xenotime, and britholite from alkaline, carbonatite , and sedimentary rocks, with fewer studies having applied hyperspectral technology to the detection of magmatic apatite in mafic-ultramafic layered intrusions. In addition, the detection of REE-bearing apatite in the long-wave infrared (LWIR; 8-12 μm) wavelength range is still poorly understood.
Reflectance spectroscopy studies the interaction of electromagnetic radiation with matter by recording the reflected energy in different spectral regions, including visible near-infrared (VNIR) and short-wave infrared (SWIR) to long-wave infrared (LWIR) wavelengths (380-1 000 nm, 1 000-2 500 nm, 7 600-12 000 nm). HSI allows for data collection at higher spatial resolution (1-2 mm per pixel) for spectral sensors compared to 30 m per pixel achieved by multispectral sensors.
In this study we present the results of apatite mineral mapping of the uppermost Upper Zone intersected by the Bellevue borehole, drilled in the northern limb of the Bushveld Complex, using hyperspectral scanning. A detailed mineralogical and textural characterization using optical microscopy and automated scanning electron microscopy (SEM) combined with whole-rock geochemistry data is included for the evaluation of the results from the newly tested HSI technique. Mineral detection and identification achieved by the analysis of the HSI data in different bandwidths and resolutions is evaluated.
Regional geology
The Bushveld Complex (Figure 1), which incorporates the largest mafic-ultramafic layered intrusion in the Earth's crust, the Rustenburg Layered Suite (RLS; Figure 1a), was intruded at 2057.7 ±1.6 Ma (Olsson et al., 2010; Mungall, Kamo, and McQuade, 2016) into the Kaapvaal Craton, subparallel to the sedimentary layering of the Transvaal Supergroup (Sharpe, 1982) as well as Archaean granite- gneiss basement rocks extending northwards from the farm Drenthe on the northern limb of the Complex (Cawthorn, Barton, and Viljoen, 1985; Zeh et al., 2015; Grobler et al., 2019). Based on variations in the cumulus mineral assemblage from the bottom upwards, the RLS is stratigraphically informally subdivided into five major units (South African Committee for Stratigraphy, 1980) - these are the Marginal, Lower, Critical, Main, and Upper zones.
The Marginal Zone, forming the base of the layered sequence, consists of several hundred metres of medium- to fine-grained noritic lithologies. The overlying Lower Zone is dominated by interlayered ultramafic cumulates including orthopyroxenite, dunite, and harzburgites (cf. Cameron, 1978). The Critical Zone, also termed the Grasvally Norite-Pyroxenite-Anorthosite Member (Hulbert, 1983). is famous for its remarkable layering, varied rock sequence, and for chromitites that constitute the world's largest known chromite deposit (Cameron, 1980), making it a vital part of the RLS. The Grasvally Norite-Pyroxenite-Anorthosite member is subdivided into a pyroxenitic lower Critical Zone dominated by a sequence of layers that include feldspathic pyroxenite, norite, chromitites, and chrome-bearing pyroxenite, and a noritic to anorthositic upper Critical Zone characterized by anorthosite at the base and interlayers of pyroxenite, gabbronorite capped by the upper group chromitites, Merensky Reef, Bastard Reef, and a mottled anorthosite. The Main Zone overlying the Critical Zone comprises a succession of relatively homogeneous gabbroic rocks interlayered with anorthosite.The Upper Zone constitutes a complex sequence of layered rocks, including layers of Ti-magnetite and anorthosite dominated by a monotonous and poorly layered ferrogabbro with variable amounts of magnetite (Scoon and Mitchell, 2012). The following sections deal only with aspects pertinent to the uppermost 600 m of the Upper Zone of the northern limb (Figure 1b).
Stratigraphy of the uppermost 600 m of the Upper Zone
The Bellevue (BV-1) borehole, drilled on the farm Bellevue 808 LR to a depth 2949.50 m, on which this study is based, is unique as it intersects two major apatite-rich zones up to 40 m in thickness.
Although apatite appears as a liquidus phase at approximately 1 100 m depth as reported by Ashwal, Webb, and Knoper (2005), of interest to this study is the apatite-enriched sequence above the uppermost massive magnetite layer (approx. 600 m) where apatite constitutes an important cumulus phase (Ashwal, Webb, and Knoper, 2005). The sequence of rocks immediately above the uppermost massive magnetite layer in the Bellevue drill core (Figure 1b) includes magnetite gabbro (Figure 1d), olivine-magnetite-gabbro, plagioclase-olivine-gabbro (Figure 1c) and olivine-magnetite-diorite (ferrodiorite), grading to diorites towards the roof contact. Using visually estimated petrographic modes for 430 samples from the Bellevue drill core as plotted by Ashwal, Webb, and Knoper (2005), the apatite was intersected between depths of approximately 577.4 and 440 m within the olivine-magnetite gabbro and between 100 and 300 m associated with the uppermost fractionated fayalite- and/or hornblende-bearing ferrodiorites. In addition, several dolerite sills/dykes (up to 5 m thick) and granitoids (up to 9 m) intrude into the Bushveld cumulate rocks near the top of the sequence and sporadically throughout the Bellevue drill core.
Methodology
Sampling
Areas mapped as enriched in apatite by the hyperspectral core scanner were sampled for SEM and petrographic mineral analysis. A total of 40 samples were collected from the upper and lower apatite-enriched zones of the Bellevue drill core (BV-1). The location of BV-1 is shown in Figure 1a. The samples were cut into 5 cm pieces of quartered core and mounted in resin to prepare 30 cm polished stubs. The stubs were carbon coated and submitted for automated SEM analysis at the Council for Geoscience mineralogy laboratory.
Analytical techniques Optical microscopy and SEM
Petrographic studies were carried out on the polished drill core samples using a standard petrographic microscope (Nikon Eclipse E600 POL). Microanalysis on the selected polished stubs was performed at the Council for Geoscience mineralogy laboratory on a ZEISS SIGMA 300VP FEG-SEM equipped with a backscatter electron (BSE) detector and a Bruker XFlash 30 mm2 EDX detector, with 129 eV energy resolution and based on the ZEISS Mineralogic automated quantitative mineralogy software platform. The acceleration voltage of the primary electron beam was set to 20 kV to ensure X-ray excitation for all relevant elements such as iron. A 120 μm aperture, providing an 80 μA beam current, was used to obtain a high input count rate for the EDX detector. The scanning parameters were a 20 μm step size and a working distance of 10 mm. The high-resolution BSE images were captured first, the EDS spectra were collected and identified by comparison with known phases in the database. The hyperspectral mineralogy was compared with mineralogical (SEM and petrographic) and whole-rock geochemical data in order to validate the detected apatite using high-resolution HSI.
HSI
The spectral data was acquired using the SisuRock hyperspectral scanner at the National Borehole Core Depository (NBCD) of the Council for Geoscience (Figure 2). The cameras in the system cover the VNIR, SWIR, and LWIR sections of the electromagnetic spectrum. An RGB (visible light) camera was fitted to the system to provide natural-colour images. Figure 2 shows the SisuRock system, with the cameras labelled in red. The system's specifications are listed in Table I.

> Approximate pixel size - The data was processed on the mobile processing unit at the NBCD using TerraCore's Intellicore* processing solution. The five levels of data processing provided by TerraCore are summarized below.
Level 1 - Calibration stage: The spectralon-based white panel (100% reflectance) and an aluminium standard panel (used for correcting the LWIR) as well as the dark reference measurements were used to correct the hyperspectral and RGB data from radiance at sensor to reflectance, and a geometric correction was applied to remove the 'smile' inherent in push-broom cameras. All image dimension changes, such as reducing excess imagery around the target material, were undertaken at level 1.
Level 2 - Masking stage: This level involved an automated routine which was run to develop a mask that retained only the core and removed the core tray and any other external materials such as wood blocks. Where needed, the mask was fine-tuned manually by the CGS's processing team. This mask was then applied to the data-set.
At this stage, a series of processes was also run to generate unmasked products, including a first-pass automated mineral map. These products can be generated within 24 hours of imaging, and so can be used to aid logging in active drill programmes.
Level 2 processing also included registration using depth markers in the core boxes and QA/QC against expected depths from the imagery.
Level 3 - Spectral processing stage: During the spectral processing stage, a variety of processing templates were applied. These included the generation of derived spectral parameters such as absorption depth ratios and the extraction of spectral parameters such as absorption depths, widths, and wavelengths in the VNIR-SWIR range and peak heights and wavelengths in the LWIR range. Mineral mapping was conducted via two processing algorithms. The first algorithm applied an automated spectral library matching technique (automated dominant mineral map) using Pearson correlation. This is a linear correlation method where perfectly identical spectra give a correlation coefficient value of 1 (i.e. similarity = 1), while a value of -1 indicates a complete mismatch (Samuel et al., 2021). The second method involved the use of an SOM, which is an unsupervised clustering technique that 'utilizes competitive learning for training neurons to represent particular subsets of a data-set well' (Wong. Abeysinghe, and Hung, 2019). Two types of SOM classification images were produced: (1) box classification images and (2) borehole classification images. The box SOM classification provides discrimination details at a box level and allows discrimination in a core tray, but does not allow correlation across core trays due to the scene dependency. Borehole classification images are generated using the borehole SOM to provide classification correlation across boxes in the drill-hole (Harris, 2020).
Level 4 - Spectral interpretation stage: During the spectral interpretation stage, automated dominant mineral map and borehole SOM results were reclassified via a QC process using the Intellicore* software (v1.9.3.89) in order to manage any misclassification typically arising from mineral mixtures. Misclassifications include instances where one spectral profile displays absorption features of two or more minerals. The output spectra from the automated results were compared with those from the US Geological Survey's VNIR-SWIR spectral library, the John Hopkins University LWIR spectral library, and the TerraCore LWIR spectral library. Mismatches with the library spectra were reclassified as a new mineral, or an assemblage of minerals in the case of mineral mixtures, with the dominant mineral followed by less dominant minerals, according to their spectral response. Mineral identification of the automated products and the SOM results was carried out by a spectral geologist to produce a dominant mineral map and assemblage SOM mineral map.
Level 5 - Product generation stage: This level involved product generation from all prior phases, and was staged to ensure a steady flow for use by spectral and project geologists. These products are uploaded into the Intellicore* software.
Results
Different mineral assemblages present different responses to these spectral cameras, as illustrated in Table II. The LWIR wavelength region is useful in identifying and mapping anhydrous silicates (including quartz and feldspars) and anhydrous sulphates such as barite and anhydrate, while the VNIR-SWIR range is important in identifying and mapping hydrated silicate minerals, especially phyllosilicates and hydrated sulphates, such as gypsum.
Unlike the VNIR-SWIR wavelength region, the LWIR range has good detection capabilities for identifying apatite, especially in samples where apatite is relatively abundant. According to Laakso et al. (2018) apatite grains are spectrally featureless in the SWIR wavelength region and thus are undetectable. The detection of apatite in the Bellevue drill core was based on a data mining approach that classifies the data using self-organizing maps (SOMs).
Detection of apatite using spectral data
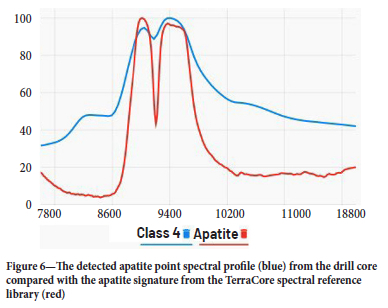
Figure 3 depicts a LWIR spectrum (spectral profile/signature) for apatite from the TerraCore spectral reference library. The signature is characterized by three main features: the peak at 8 980-9 030 nm, the trough at 9 200-9 215 nm, and the peak at 9 338-9 578 nm. In both the upper and lower apatite zones, the LWIR spectrum appears to indicate a mixture of apatite and olivine, as illustrated in Figure 4. Spectral mixing is described by Kruse (1994) as a consequence of the mixing of materials having different spectral properties within the ground field-of-view (GFOV) of a single image pixel. The response shows a class -6 spectral profile which represents the apatite response overlain by an olivine spectral profile from a spectral reference library compiled by TerraCore.
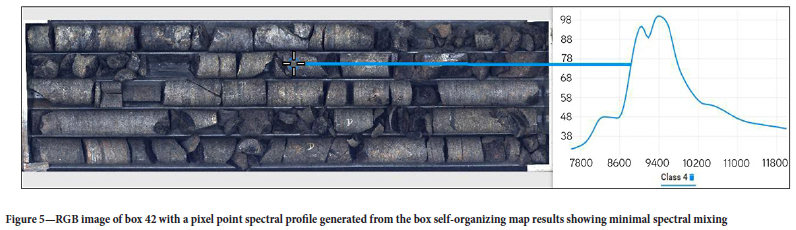
Figure 5 shows an RGB (true colour) image of box 42 with a box SOM pixel spectral profile of apatite detected at the depth interval of 304.8-305.12 m. The point/pixel spectral signature at this depth shows minimal spectral mixing. Barnes, Maier, and Ashwal (2004) noted an oxide-rich unit with a lower part consisting of massive magnetite and ilmenite and an upper part of nelsonite (an apatite-rich rock) at a depth of 305 m.
The apatite response from the point spectral signature in box 42 was validated by comparing it with the apatite spectral signature from the TerraCore LWIR spectral reference library. Figure 6 shows the results of the comparison.
Using class 66 of the 100 class borehole SOM results (mixed spectra of apatite and olivine) from the LWIR (OWL) bandwidths, two apatite-enriched zones were mapped (Figure 7). These are the lower and upper apatite-enriched zones. In the upper apatite-enriched zone, apatite is encountered from 236-259 m. The apatite zone itself is <23 m thick, as the borehole intersected several non-responsive intervals associated with metasedimentary xenoliths (236.3-236.6 m), pegmatitic patches (239 and 240 m), olivine-free rocks (241.64-241.82 m, 244.15-244.65 m, 244.95-244.50 m), and pegmatite (253.3-256.7 m). Thus, the apatite zone between 248.9 and 259 m is considered a zone of apatite enrichment with minor non-responsive intervals. The lower apatite zone, close to 50 m thick, occurs immediately above the topmost magnetite layer. A non- responsive zone within this zone, between 547 and 558 m (approx. 10 m) was observed, bringing the thickness of the lower apatite zone to about 40 m. The non-responsive interval is characterized by a fine-grained gabbroic rock (548-549 m) and an olivine-magnetite gabbro (549-558 m) as mapped by Knoper and von Gruenewaldt (1996). Interestingly, this apatite-poor zone coincides with the presence of conspicuous olivine at the depth interval of the latter zone (Figure 7). In contrast, the presence of apatite in some intervals coincides with the presence of olivine, as is the case, for instance, at 531-537 m (Figure 7).

Mineralogical data
The mineralogical analysis results show that Fe-Ti oxides (magnetite and ilmenite), feldspar, apatite, olivine, and pyroxene are the most abundant phases in the lower apatite zone (Figure 8). In this zone apatite is mostly concentrated along grain boundaries of olivine, while also occurring as inclusions in Fe-Ti oxides (Figures 9a-b and 11). The common occurrence of apatite along grain boundaries of olivine (Figure 9d) in this zone may explain the mixed apatite-olivine spectral response as illustrated in Figures 4 and 6. The mineralogical analysis results of the upper apatite zone indicate the increased presence of hydrous silicate minerals (hornblende, chlorite, and biotite) with minor quartz and sulphides in addition to Fe-Ti oxides (magnetite and ilmenite), feldspar, apatite, olivine, and pyroxene. Similarly, an apatite-olivine association is commonly observed (Figure 9f) in addition to the frequent occurrence of apatite as inclusions in Fe-Ti oxides (Figures 9g and 9h), and rarely in hydrous silicates (Figure 9c). Sulphides are also observed, occurring mainly as small (>50 μm) rounded inclusions that are usually present as separate grains in ilmenite, magnetite, and silicate minerals, occasionally associated with apatite (Figures 9b, 9g, 9h). The general distribution of apatite shown in the LWIR mineral map (Figure 7) coincides with mineralogical observations of the samples, and its spatial distribution as detected by HIS was thus validated (Figures 8, 9, and 11). Generally, the apatite-rich rocks contain up to 17 vol% apatite (Figure 8).

Geochemical data
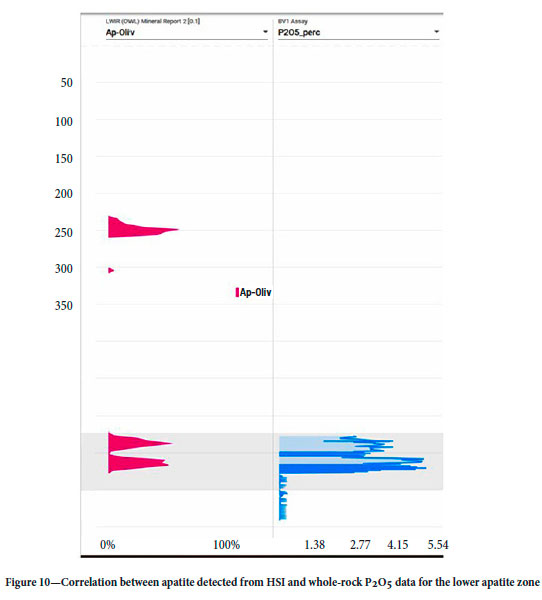
Whole-rock phosphorus (P2O5 wt.%) was also used as a proxy to validate the apatite detected using high-resolution HSI. The P2O5 content was plotted as a function of drill-hole depth. There is a significant correspondence between the apatite mineral phase in the lower apatite zone detected using the hyperspectral scanner and the whole-rock geochemistry (Figure 11). The P2O5 content in the non-responsive interval from 548-558 m ranges between 2.2 to 2.9 wt.% P2O5, which suggests the presence of apatite (Figure 7). While it is unclear why there is no apatite response in this interval, it is possible that this is related to the grade of P2O5. Alternatively, differences in the measured surface area can also create situations in which apatite grains occur within the area measured with XRF, but not within the area measured with HSI. The highest grades of P2O5 (2.61-5.04%) were found towards the base of the lower apatite zone in the interval between 560 and 572 m, which is consistent with the high apatite response detected by HSI (Figure 11).
Discussion
The presence of apatite in the uppermost Upper Zone of the Bushveld Complex has been observed and described in several studies (e.g., Nienaber-Roberts, 1986; Von Gruenewaldt, 1993; Ashwal, Webb, and Knoper, 2005). Apatite was generally determined in these studies by sampling of drill core, followed by mineralogical and geochemical investigations. This. however, is time-consuming and does not provide a detailed spatial distribution of minerals of interest as only small areas are covered. To accurately identify apatite in the uppermost Upper Zone, we imaged the BV-1 drill core in the LWIR region and used mineralogical and geochemical analysis as validation. This methodology is not intended to replace traditional laboratory techniques (optical microscopy, XRF) but rather to reduce reliance on them. In this study, HSI has demonstrated its efficacy in identifying the presence and the spatial distribution of apatite in the uppermost differentiates of the Upper Zone. From this, two apatite enriched layers have been identified, from 236to -259 m and from 527 to 576 m. The context of our findings calls for a discussion of three key observations: (1) spectral mixing of apatite and olivine in the apatite-enriched layers; (2) the near-pure pixel point spectral signature of apatite; and (3) the detection of REEs hosted in apatite using HSI.
Firstly, one of the challenges with mapping apatite in mafic layered intrusions such as the Bushveld Complex is that it is commonly associated with silicates (plagioclase, pyroxene. and olivine; Figures 9d-f), hydrous silicates (Figure 9c), Fe-Ti- oxides (Figures 9a-b; g-h), and sulphides (Figures 9b and 9h). These mineral associations can cause spectral mixing. According to Laakso et al. (2018) spectral mixing can cause the appearance and disappearance of spectral features, particularly where the contents of the pixels are shared by two or more minerals. Another possibility for spectral mixing is related to the spatial resolution of the hyperspectral imagery in relation to the grain sizes of individual minerals. In this regard, if the pixel size of an image is larger than the size of single mineral grains, then spectral mixing can occur (Keshava and Mustard, 2002). Figure 4 shows the spectral response of apatite which appears to be in a mixed phase with olivine. The common association of olivine with apatite is interpreted as the reason for the spectral mixture, whereby the spectral response of fluorapatite is overlapped by that of the much larger olivine crystals. As the spatial resolution (1.4 mm) of our hyperspectral image is lower than the average size (Dx(50)) of even the smallest apatite grain in the rock samples analysed by SEM (270-605 μm; Table III), significant spectral mixing is likely to occur. Despite challenges such as spectral mixing, we are confident that the apatite is correctly mapped by HSI as recorded by the positive correlation seen between the abundance of apatite mapped and the mineralogical and whole-rock P2O5 results.

Secondly, the pixel point spectral signature of apatite detected at the depth interval of 304.8-305.12 m shows minor spectral mixing comparable to the apatite pixel spectral profile in the TerraCore LWIR spectral reference library. The rock has been defined by Barnes, Maier, and Ashwal (2004) as an oxide-rich unit with a lower part consisting of massive magnetite and ilmenite and an upper part of nelsonite (an apatite-rich rock). The nelsonite was reported to consist of 60% oxides (predominantly granular ilmenite with some magnetite) and 30% apatite (Barnes, Maier, and Ashwal, 2004). The lack of spectral mixing at this level is difficult to explain but is probably due to the high modal percentage of apatite (approx. 30%) with no silicate mineral association. In addition, apatite in this rock is associated with Fe-Ti oxides, which are non-diagnostic in the LWIR spectral range as indicated in Table II. From this, it seems reasonable to assume that the spectral response of apatite is influenced by mineralogy, in particular mineral associations.
Lastly, the VNIR range of the infrared is effective in detecting REE phosphate minerals, including fluorapatite where the absorption features in this range are due to Nd as shown by Turner, Rivard, and Groat (2016). However, in our study the VNIR-SWIR range had limited detection capabilities in mafic-ultramafic rocks dominated by silica, some silicates (nesosilicates such as olivine), and oxides, as these minerals did not show prominent spectral features. Image C in Figure 12 compares the fluorapatite spectral profile (yellow) from the USGS library with the apatite-rich region of interest (ROI) spectral profile (red). The results show the absence of fluorapatite-diagnostic prominent VNIR features related to the LREE (Nd) on the ROI spectral profile (circled in black) and the inconspicuous spectral features in the SWIR range.
The apatite LWIR spectral profile in this study can be attributed to the PO4 fundamental vibrations (Christensen et al., 2000). As concluded by Laakso et al (2019), the LWIR range did not show any distinctive spectral features that can be attributed to REEs. Therefore, the detection of REE spectral features was not achieved in this study.
Although the automated hyperspectral logging system is fast, reliable, and effective, it does not yield quantitative mineralogical information from the mineral maps and images obtained using the SisuRock system, as the data is limited to the pixel-size resolution and the classification of the pixel arises from the main spectral feature. This is because HSI data processing tools only focus on the spatially distributed mineralogy and mineralogical composition and not the texture, grade, or geometry of the minerals in the drill core. In addition, it is important to mention that HSI is a surface technique and the mineral abundance is based on pixel response. For this reason, absolute mineral abundance cannot be quantified as the pixel size is determined by the camera spatial resolution. In this regard, HIS should be used in conjunction with laboratory analytical methods like SEM, optical microscopy, and XRF. Nonetheless, owing to its non-destructive nature, minimal sample preparation requirements, and rapid acquisition time, HIS provides a suitable solution for mineral mapping for bulk samples or diamond drill core. Although substantial amounts of drill core still need to be sent for in-depth mineralogical and geochemical analyses like SEM, petrography, and whole-rock XRF to determine the mineralogy quantitatively, the cost of chemical assaying is decreased. Instead of sampling the entire core to identify apatite-enriched zones, the SiSuRock hyperspectral scanner can be used to identify target areas for analysis.
Conclusion and recommendations
Hyperspectral imaging (HSI) is shown to be an effective and reliable method to characterize apatite-rich units in the Upper Zone of the Bushveld Complex using the LWIR spectral region, and which can therefore also be used to map apatite in other mafic-ultramafic layered intrusions.
HSI of borehole core from the upper 600 m of the Upper Zone delineated two apatite-enriched zones: the lower (531-575 m) and upper (236-259 m) zones. A pure apatite spectral signature was not obtained owing to spectral mixing as a result of the common association between apatite and silicates. Detection of sulphides and oxides is not yet possible by HSI as highlighted in Table II. Oxides are important in the context of apatite as many apatite-rich units succeed Fe-Ti oxide-rich layers. A technique that could identify the fine-grained sulphide and oxide minerals would improve the detection of apatite-enriched zones. This is because a close association between apatite and Fe-Ti oxides is a distinctive feature of apatite mineralization in the upper parts of the Upper Zone.
The second part of the work involved the mineralogical and geochemical characterization of the apatite-rich zones detected through HSI. The results show a good correlation with the HSI results. Apatite occurs in common association with oxides, sulphides, hydrous minerals. and silicates, confirming the predominant spectral mixture associated with the apatite-enriched zones.
This study demonstrates that the LWIR range shows good apatite detection in mafic- ultramafic rocks, and the association of apatite with silicate minerals, while the SWIR and VNIR ranges did not show prominent spectral features.
Acknowledgments
The authors wish to thank the Council for Geoscience for permission to publish this paper. Our appreciation goes to Professor Rais Latypov for undertaking a preliminary review of the work, and to Zahn Nel for the language editorial work on the manuscript. We thank Bushveld Minerals Pty Ltd for providing the whole-rock geochemistry data of the apatite enriched zone. Mr Senza Ndumo is thanked for assisting with the logging and sampling of the core.
References
Ashwal, L.D., Webb, S.J., and Knoper, M.W. 2005. Magmatic stratigraphy in the Bushveld Northern Lobe: Continuous geophysical and mineralogical data from the 2950 m Bellevue drill core. South African Journal of Geology, vol. 108. pp. 199-232. [ Links ]
Barnes, S.J., Maier, W.D., and Ashwal, L.D. 2004. Platinum-group element distribution in the Main Zone and Upper Zone of the Bushveld Complex, South Africa. Chemical Geology, vol. 208, no. 1-4. pp. 293-317. [ Links ]
Cameron, E.N. 1978. The Lower Zone of the eastern Bushveld Complex in the Olifants River trough. Journal of Petrology, vol. 19. pp. 437-462. [ Links ]
Cameron, E.N. 1980. Evolution of the Lower Critical Zone, central sector, eastern Bushveld Complex and its chromite deposits. Economic Geology, vol. 75, no. 6. pp. 845-871. [ Links ]
Cawthorn, R.G., Barton, J.M. Jr, and Viljoen, M.J. 1985. Interaction of floor rocks with the Platreef on Overysel, Potgietersrus, northern Transvaal. Economic Geology, vol. 80. pp. 988-1006. [ Links ]
Christensen, P.R., Bandfield, J.L., Hamilton, VE., Howard, D.A., Lane, M.D., Piatek, J.L., Ruff, S.W., and Stefanov, W.L. 2000. A thermal emission spectral library of rock-forming minerals. Journal of Geophysical Research. vol. 105. pp. 9735-9739. https://doi.org/10.1029/1998JE000624 [ Links ]
Decree, S., Coint, N., Debaille, V., Hagen-Peter, G., Ledüc, T., and ScHiELLERUP, H. 2022. The potential for REEs in igneous-related apatite deposits in Europe. Special Publications, vol. 526. The Geological Society, London. [ Links ]
Grobler, D.F., Brits, J.A.N., Maier, W.D., and Crossingham, A. 2019. Litho- and chemostratigraphy of the Flatreef PGE deposit, northern Bushveld Complex. Mineralium Deposita, vol. 54, no. 1. pp. 3-28. [ Links ]
Harris, P. 2020. Spectral geology manual: CGS spectral geology workshop notes. TerraCore, Johannesburg, South Africa. [ Links ]
Hughes, J.M., Cameron, M., and Mariano, A.N. 1991. Rare-earth-element ordering and structural variations in natural rare-earth-bearing apatites. American Mineralogist, vol. 76, no. 7-8. pp. 1165-1173. [ Links ]
Hulbert, L.J. 1983. A petrographical investigation of the Rustenburg Layered Suite and associated mineralisation south of Potgietersrus. DSc dissertation, University of Pretoria, South Africa. [ Links ]
Ihlen, P.M., Schiellerup, H., Gautneb, H., and Skàr, 0. 2014. Characterization of apatite resources in Norway and their REE potential - A review. Ore Geology Reviews, vol. 58. pp. 126-147. doi: 10.1016/j.oregeorev.2013.11.003 [ Links ]
Keshava, N. and Mustard, J.F. 2002. Spectral unmixing. IEEE Signal Processing. Magazine, vol. 19, no. 1. pp. 44-57. https://doi.org/10.1109/79.974727 [ Links ]
Knoper, M.W. and von Gruenewaldt, G.1996. The Bellevue (BV-1) borehole core log: 2.9 km of Bushveld Complex stratigraphy (northern lobe), Potgietersrus, South Africa. http://www.geocities.com/mwk.geo/bic.htm [ Links ]
Kruse, F.A. 1994. Imaging spectrometer data analysis - A tutorial. Proceedings of the International Symposium on Spectral Sensing Research, San Diego, CA, 10-15 July 1994, vol. 1. pp. 44-50. https://citeseerx.ist.psu [ Links ]
Laakso, K., Middleton, M., Heinig, T., Bars, R., and Lintinen, P. 2018. Assessing the ability to combine hyperspectral imaging (HSI) data with Mineral Liberation Analyzer (MLA) data to characterize phosphate rocks. International Journal of Applied Earth Observation and Geoinformation, vol. 69. pp.1-12. [ Links ]
Laakso, K., Turner, D.J., Rivard, B., and Sánchez-Azofeifa, A. 2019. The longwave infrared (8-12 μm) spectral features of selected rare earth element-bearing carbonate, phosphate and silicate minerals. International Journal of Applied Earth Observation and Geoinformation, vol. 76. pp. 77-83. [ Links ]
Mungall, J.E., Kamo, S.L., and McQuade, S. 2016. U-Pb geochronology documents out-of- sequence emplacement of ultramafic layers in the Bushveld Igneous Complex of South Africa. Nature Communications, vol. 7, no. 1p. 1-13. [ Links ]
Olsson, J.R., Soderlund, U., Klausen, M.B., and Ernst, R.E. 2010. U-Pb baddeleyite ages linking major Archaean dyke swarms to volcanic-rift forming events in the Kaapvaal craton (South Africa) and a precise age for the Bushveld Complex. Precambrian Research, vol. 183. pp. 490-500. [ Links ]
Roeder, P.L., MacArthur, D., Ma, X.P., Palmer, G.R., and Mariano, A.N. 1987. Cathodoluminescence and microprobe study of rare-earth elements in apatite. American Mineralogist, vol. 72, no. 7-8. pp. 801-811. [ Links ]
Samuel, A.Z., Mukojima, R., Horii, S., Ando, M., Egashira, S., Nakashima, T., Iwatsuki, M., and Takeyama, H. 2021. On selecting a suitable spectral matching method for automated analytical applications of Raman spectroscopy. ACS Omega, vol. 6, no. 3. pp. 2060-2065. doi: 10.1021/acsomega.0c05041. PMID: 33521445; PMCID: PMC7841937 [ Links ]
Scoon, R.N. and Mitchell, A.A. 2012. The Upper Zone of the Bushveld Complex at Roossenekal, South Africa: Geochemical stratigraphy and evidence of multiple episodes of magma replenishment. South African Journal of Geology, vol. 115, no. 4. pp. 515-534. [ Links ]
Sharpe, M.R. 1982. The floor contact of the eastern Bushveld Complex: Field relations and stratigraphy. Institute for Geological Research on the Bushveld Complex, University of Pretoria, South Africa. 49 pp. [ Links ]
South African Committee for Stratigraphy. 1980. Lithostratigraphy of the Republic of South Africa, South West Africa/Namibia and the Republics of Botswana, Transkei and Venda. Handbook 8. Geological Survey of South Africa. 690 pp. [ Links ]
Turner, D.J. 2015. Reflectance spectroscopy and imaging spectroscopy of rare earth element- bearing mineral and rock samples. PhD thesis,. University of British Columbia. https://doi.org/10.14288/L0167182 [ Links ]
Turner, D.J., Rivard, B., and Groat, L.A. 2014. Visible and short-wave infrared reflectance spectroscopy of REE fluorocarbonates. American Mineralogist, vol. 99. pp. 1335-1346. https://doi.org/10.2138/am.2014.4674 [ Links ]
Turner, D.J., Rivard, B., and Groat, L.A. 2016. Visible and short-wave infrared reflectance spectroscopy of REE phosphate minerals. American Mineralogist, vol. 101. pp. 2264-2278. https://doi.org/10.2138/am2016-5692 [ Links ]
Turner, D.J., Rivard, B., and Groat, L.A. 2018. Visible and short-wave infrared reflectance spectroscopy of selected REE-bearing silicate minerals. American Mineralogist, vol. 103. pp. 927-943. https://doi.org/10.2138/am-2018-6195 [ Links ]
Von Gruenewaldt, G. 1993. Ilmenite-apatite enrichments in the upper zone of the Bushveld complex: A major titanium rock phosphate resource. International Geology Review, vol. 35. pp. 987-1000. [ Links ]
Wong, A., Abeysinghe, W., and Hung, C. 2019. A massive self-organizing map for hyperspectral image classification. Proceedings of the 10th Workshop on Hyperspectral Imaging and Signal Processing: Evolution in Remote Sensing (WHISPERS). IEEE, New York. pp. 1-5. doi: 10.1109/WHISPERS.2019.8921093 [ Links ]
Zeh, A., Ovtcharova, M., Wilson, A.H., and Schaltegger, U. 2015. The Bushveld Complex was emplaced and cooled in less than one million years - Results of zirconology and geotectonic implications. Earth and Planetary Science Letters, vol. 418. pp. 103-114. [ Links ]
 Correspondence:
H. Mandende
Email:hakaymanday@gmail.com
Received: 3 Nov. 2022
Accepted: 23 Jan. 2023
Published: February 2023

