


Services on Demand
Article
 English (pdf)
 Article in xml format
 Article references
Indicators

Related links
-
 Cited by Google
 -
 Similars in Google
Share

 Permalink
Journal of the Southern African Institute of Mining and Metallurgy
On-line version ISSN 2411-9717
Print version ISSN 2225-6253
J. S. Afr. Inst. Min. Metall. vol.122 n.12 Johannesburg Dec. 2022
http://dx.doi.org/10.17159/2411-9717/1873/2022
PROFESSIONAL TECHNNICAL AND SCIENTIFIC PAPERS
Flyrock in surface mining - Limitations of current predictive models and a better alterative through modelling the aerodynamics of flyrock trajectory
T. SzendreiI; S. ToseII
IDynamic Physics Consultant, Johannesburg, South Africa. https://orcid.org/0000-0002-5693-7850
IIAECI Mining Explosives, Johannesburg, South Africa. https://orcid.org/0000-0002-2514-5308
SYNOPSIS
Historical approaches to the problem of flyrock based on correlation studies and regression analysis, including artificial neural networks and similar techniques, are inherently incapable of addressing two core issues - root causes of flyrock and projection velocity. A further shortcoming of correlation techniques is that they give no information on the influence of rock size and shape on the flight distance. The scaled depth of burial model for crater blasting in the collar zone and bench face does not specifically address the question of flyrock velocity. A third approach, based on flight trajectory calculations, often neglects the very significant effects of air resistance on the trajectory. Some trajectory models incorporate air resistance but use an implausible fragment velocity model that cannot propel sizeable rocks to distances much beyond 150 m.
Nonetheless, trajectory calculation incorporating the effects of air drag affords the most promising approach to the prediction of flyrock range. A unique and insightful feature of the proposed realistic flight modelling is that it collapses all suspected causes of flyrock, many of which are not well understood, to just a single parameter - the launch velocity. This indicates that the root causes of flyrock lie in the mechanisms of momentum transfer to broken rock and suggests new avenues of study.
Keywords: flyrock, flyrock velocity, throw distance, scaled depth of burial, airblast, trajectory, air drag.
Introduction
In comparison to the propagation and attenuation of ground and airborne vibrations, flyrock is a much less well understood phenomenon. Yet flyrock is often considered to be the most hazardous of the adverse effects of rock blasting in surface mines and construction works. It can damage machinery, property, and industrial structures, as well as cause serious injuries at distances where ground and air vibrations are not significant.
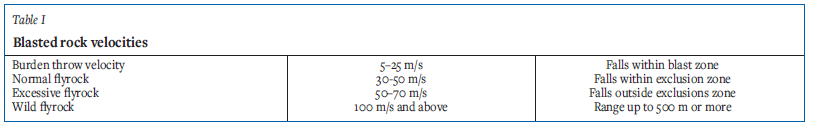
Following Little (2007), three types of flyrock can be recognized in mining works based on bench blasting:
> Burden throw - blast-driven movement of broken rock to form the muckpile, which generally does not extend to more than ten bench heights and falls within the blast zone
> Normal flyrock - the propulsion of rock beyond the blast zone but falling within the exclusion or clearance zone.
> Wild flyrock - rock fragments propelled outside the clearance zone, often onto private and public areas. A particularly troublesome aspect of wild flyrock is that large fragments can be thrown unexpected distances. For example, Stojadinovic, Pantovic, and Zikic (2011) noted a sizeable rock punching a hole through the brick wall of a double-storey residence located 360 m from the bench. Lundborg (1981) published a photograph of a 3 t boulder that landed 300 m from and 40 m above its source. There have been scattered reports in mining literature of flyrocks thrown up to 1000 m.
Many attempts have been made to understand the generation of flyrock and predict its throw distance. In this study we review various historical methods of understanding the flyrock problem, point out their shortcomings, and propose a new way of looking at the problem. Although the concept - trajectory modelling - is not new, its full potential has not been explored in mining literature. Often, it has been simplified to a kinematic (drag-free) approach, or coupled to a defective model of flyrock velocity, resulting in erroneous predictions of maximum range. We demonstrate through calculations how the trajectory approach can deliver useful answers to a range of questions frequently encountered in the field, and point out that it opens a new avenue for the study of the root causes of flyrock.
Literature overview of flyrock models
Historical correlation studies
Historically, empirical correlations led to predictions of flyrock throw based on readily available blast parameters, such as burden, stemming depth, quantity of charge, and blast-hole diameter (Adhikari, 1999; Aghajani-Bazzazi, Osanloo, and Azimi, 2010). In recent years, empirical correlations have greatly increased in complexity through the use of multiple regression analysis (Ghasemi, Sari, and Ataei 2012) and RSA (response surface analysis), which is the analysis of variance or ANOVA (Raina and Murthy, 2016a). Artificial intelligence (AI) has been increasingly applied in the form of artificial neural networks (ANNs) and fuzzy logic (Tivedi et al., 2014). Such routines have been used with up to 21 parameters describing the blast and to some degree, the properties of the rock mass to be blasted (Raina and Murthy, 2016b). The independent parameters may be combined in linear arrays, or raised to various powers, or included in various mathematical functions such as logarithms and exponentials.
This increased sophistication of statistical algorithms has not resulted in any better understanding of the problem of flyrock. Empirical correlations, however precise, contain certain inherent limitations as indicated below.
A distinct disadvantage is that predictions of range require a large amount of field data, including measured values of throw distance, before a correlation can be found. A second disadvantage is that the predicted throw distance is site-specific and cannot be used to predict throw distances under any other conditions of blasting. As for multiple regression and neural network analyses, other than indicating the relative importance (sensitivities) of burden, stemming, and some other parameters under site-specific blasting conditions, these techniques do not offer practical guidance for adjusting and controlling the blast plan. The authors of such studies themselves point out that their elaborate predictive equations for flyrock range cannot be applied at mines other than those where they gathered their input data.
The greatest inherent deficiency of empirical correlations is that they do not identify the root causes of flyrock, nor the physical mechanisms resulting in flyrock projection from the bench. A further distinct disadvantage is that correlation equations do not provide any information on the size of rocks being thrown or on the influence of size on the distance travelled. Studies that considered the sizes of projected rocks were done in the context of ballistic flight modelling, as discussed below. It is well known that air drag is a significant factor in calculating the range of various projectiles from bullets to volcanic ejecta and debris thrown out in surface explosions. It is unlikely that any model of flyrock projection that does not consider one of the most important determinants of the distance travelled - air resistance, and hence rock shape and size - can provide reliable estimates of flyrock range.
Lundborg model of flyrock throw
In two often-cited studies Lundborg presented a new method for predicting flyrock range (Lundborg, 1974; Lundborg et al., 1975). The Lundborg model has gained wide recognition because it combined measurements of flyrock throw distance and blast-hole diameter with some theoretical considerations of explosion blast impulse and momentum transfer to rocks, together with the use of a realistic trajectory model incorporating air drag. In essence, the Lunborg model derives rock velocities based on the transfer of impulse from the blast wave to a rock fragment. An empirical correlation is used to define the maximum velocity thus imparted to rocks of various sizes (diameters). A more detailed analysis of the Lundborg impulse-rock velocity model is given in the Appendix. The work of Lundborg et al. (1975) is encapsulated in a family of graphs depicting the variation of range with rock size. Together with these graphs, Lundborg defined the maximum range Lmax attainable for a given borehole diameter d:

These maxima are attained at a stone size specific to each hole diameter:

where Lmax is the maximum range in metres at hole diameter d inches, and φmax is the 'optimal' rock size in metres at which the maximum range is attained. These equations are not based on independent field observations, but are based directly on the coordinates of maximum points in the calculated trajectories. These trajectories were calculated with launch velocities (m/s) assigned by the following equation:
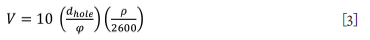
In this equation, the borehole diameter 'dhole' is in inches. p is rock density normalized to granite, and φ is rock diameter in metres. The factor 10 is an empirically-based upper bound.
Although acknowledged as a comprehensive approach to the problem of flyrock throw, Lundborg's model has been questioned in the engineering literature for being overly conservative. In fact, it should be noted that the predictions of range according Equations [1-3] and the accompanying graphs are applicable only under some explicit and implicit assumptions. These are:
> Predicted throw distances are applicable only to spherically shaped fragments of a very specific size given by Equation [2] pertaining to each hole diameter
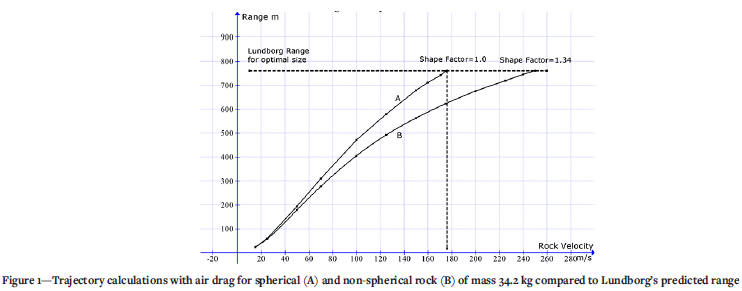
> For the same mass, other rock shapes would yield significantly less throw distance at the same velocity for the reason that a sphere has the least surface area per unit mass. Thus for flyrock of the same mass, all non-spherical shapes would expose larger surface areas to drag forces and suffer greater deceleration in flight. (An example of this is shown in Figure 1 where a 19% reduction in range is calculated on changing the flyrock shape from spherical to slab-like
> Predictions of Lmax for all rock sizes, j, are ultimately based on velocities defined by Equation [3]. This equation is a direct consequence of an airblast momentum model that Lundborg created in 1974. When updated to reflected current knowledge of blast wave properties, the model yields significantly lower estimates of flyrock velocity than the original model and hence significantly shorter flight distances. The updates to the model relate to the calculation of blast wave impulse acting on rocks in the vicinity of an explosive charge. The details of this re-analysis are given in the Appendix.
A number of other - and simpler - models have been proposed by various authors for the prediction of flyrock throw distance.
Kinematic calculations of throw distance
Various workers have attempted to estimate flyrock projection range using simpler kinematic equations to describe the trajectory (Roth, 1979; Chiapetta et al., 1983; Workman and Calder, 1994; Richards and Moore, 2005). The kinematic approach considers the motion of a point mass in free flight under the influence of gravity only. Hence it does not consider drag forces and because of this, the shapes and sizes of flyrocks and their masses have no influence on the predicted trajectory path. This is made evident by the kinematic equation for the maximum range, which can be formulated simply as:
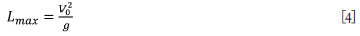
where Vo is the projection velocity (m/s) at 45° to the horizontal for maximum range and g the gravitational constant (9.84 m/s2). Clearly, for a given velocity, all rock shapes and sizes are predicted to travel the same distance. It has been argued that the kinematic approach is acceptable since the effects of drag forces are not significant at 'typical' flyrock velocities, perhaps even up to the sonic limit (approx. 340 m/s).
This view is mistaken. McKenzie (2009) showed that the difference between the predictions of a drag-free model of a point mass and a realistic model for flyrock possessing a particular shape, surface area, and mass can be a factor of 2 to 5. He considered 50 mm and 250 mm rocks with initial velocities of 70 m/s. At velocities of 100 m/s and above, the discrepancy between kinematic and realistic trajectory distances would become progressively larger.
More recently, Stojadinovic and co-workers (2011, 2013, 2016) attempted to apply drag-inclusive trajectory calculations to the interpretation of a serious flyrock incident at a quarry. These attempts ultimately foundered on two issues - the uncertainty of what drag coefficient to use coupled with the inability to measure it, and the inability to measure launch velocity and the lack of a credible universally applicable predictive model for it.
Various workers have attempted to produce field-calibrated, empirical formulae for predicting throw velocity based on the concept that the velocity is related to confinement conditions, specifically the scaled burden, as described by Workman and Calder (1994), Bauer, Burchell, and Crosby (1982), and St George and Gibson (2001). Defining the 'scaled burden' as the burden (or length of stemming) divided by the square root of the explosive weight per metre in a fully coupled hole, Richards and Moore (2002) presented a power-law equation for ejection velocities from the face and from bench-top cratering. The calibration constant in their equation depends on rock strength and specific energy of the charge.
Similarly to Richards and Moore (2002), Chiapetta (2009) found a power law relationship between face velocity and the burden scaled by the charge/mass per unit length, albeit with somewhat different constants for the power law formula. His analysis was based on high-speed cinematography of face movement from large diameter boreholes in dolomite, granite, and iron ore.
The scaled burden (and stemming) approach appears to have been replaced by the scaled depth of burial concept discussed in the following section.
St George and Gibson (2001) and Raina, Murthy, and Soni (2015) attempted to calculate rock velocity from the explosion pressure and its duration of action on rocks, either in the borehole or through the burden respectively. The borehole pressure is not a well-defined concept for commercial blasting agents (Cunningham, 2006) and it is not the appropriate parameter for calculating the external effects of a borehole explosion. The chemical energy of an explosion resides in the high-temperature and high-pressure gases in the borehole prior to any movement of the rock. The conversion of this energy to work on the external environment can be modelled by the well-known concept of Gurney energy. Attempts to link flyrock velocities, particularly those characterizing normal and wild flyrock, to pressure (or more accurately, stress) pulses propagating through the rock mass can be considered very speculative. Similarly, Roth (1979) attempted to relate flyrock velocity to the ratio of charge mass to rock mass when averaged over the whole bench face. This again neglects the influence that the quality of rock mass as well as the presence of localized under- and overburdened areas in the face may have on the generation of flyrock.
Scaled depth of burial model (SDOB)
McKenzie (2009) presented a detailed model for calculating the velocity and range of non-spherical flyrock on the basis of the scaled depth of burial approach that considers flyrock from the collar zone and from the bench face as examples of crater blasting. The scaling factor is the cube root of the explosive weight. Numerous studies in the areas of military ballistics and civil engineering have shown that cube-root scaling is appropriate for estimating all linear features of buried explosions, such as crater diameter, depth, extent of mounding, and range of debris throw. In a comprehensive review of post-2011 flyrock literature, van der Walt and Spite-ri (2020) deemed the scaled depth of burial approach to be currently the most effective model for estimating the throw distance. McKenzie's equations are reproduced in the ISEE Blasters' Handbook 2011 and used to calculate range and safety distances. Van der Walt and Spiteri (2020) argued that all methods of flyrock analysis could be improved by using an objective and scientific method for the accurate measurements of flyrock distances.
McKenzie (2018) presented a comparison of surveyed flyrock (range and size) with his SDOB model by overlaying the field observations with the calculated 'footprint' of range versus flyrock size calculated at the appropriate SDOB for each blast. The measured values are considerably less than those calculated. They are on average 4.8-fold less and vary from 1.4 to 10. More importantly, the absolute maximum measured range - which is more relevant to flyrock prediction - was 56% of predicted values.
Seeing that McKenzie (2018) calculated flyrock range using a ballistics model that incorporated air drag, the error is clearly associated with the calculated velocity values. This is not surprising. McKenzie (2009) based his model on Lundborg's velocity values. At a SDOB equal to 0.596 m/kg1/3 (which is considered by McKenzie to be the equivalent to 'normal' bench blasting), the combinations of rock sizes and rock velocities predicted by the McKenzie (2009) model are exactly the same as those predicted by Lundborg. Since those values are questionable for reasons already pointed out, McKenzie's predictions of projection velocity and the resultant range are also questionable.
Chiapetta (2009) used the concept of cube-root scaled depth of burial to address the problem of collar zone oversize through the design of appropriate column lengths and weights of charges for top stemming, stem charges, stab charges, air decks, and decoupled charges. Appropriate values are those that yield a scaled depth between 0.4 m/kg1/3 and 1.2 m/kg1/3. The application of this model to flyrock is incidental. Other than pointing out the likely occurrence of severe flyrock (and airblast) at <0.4 m/kg1/3 and its absence at >1.2 m/kg1/3, the model does not make specific predictions of flyrock velocity.
It is evident that there is no proven and reliable method for predicting flyrock velocity and throw range. The generally accepted methods of Lundborg and Mackenzie for calculating flyrock velocity can be shown to be defective, and hence their throw distance predictions are also unreliable and err on the side of being too conservative when setting safety distances.
Trajectory models incorporating air resistance
Both problematic aspects of flyrock modelling - prediction of velocity and range based on first principles - become far more tractable to quantitative analysis when considered in reverse. Instead of trying to analyse all the multiple blast-related factors that influence flyrock projection from the bench - many of which are not well understood or are difficult to quantify - it is easier to analyse the flight of the flyrock to its eventual landing point. A great deal of simplification arises because the details of the blast and the rock mass blasted have an influence on the range only to the degree that those details contribute to the projection velocity of flyrock.
Once airborne, a flyrock is free of any further influence from the blast and travels a ballistic trajectory determined by the equations of motion (EOM) for free bodies moving under the influence of gravity and air resistance. The solutions of these equations are well known and have been reported in technical literature by, for example, Chernigovskii (1985), Stojadinovic, Pantovic, and Zikic (2011), and Saunderson (2008).
The particular algorithm that we use for trajectory calculations in this study is based on the following formulation of the EOM. The two aerodynamic forces acting on a flyrock are the force of gravity Mg (M being flyrock mass and g the gravitational acceleration), and the force of air resistance (FD), which is defined by the following equation:
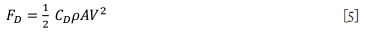
where CD denotes the drag constant, p the density of air, V is the instantaneous velocity, and A the presented area of the flyrock. A is always measured in the plane perpendicular to the direction of flight. By Newton's Second Law, the resultant of the two aeroballistic forces changes the momentum of the flyrock both in direction and in magnitude. The time (t) rate of this change can be expressed as follows:
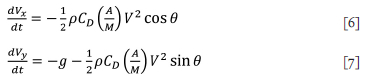
where (x,y) denote the horizontal and vertical directions respectively. 0 is the angle above the horizontal defined by the direction of the instantaneous velocity V; initial values (at t = 0) are Vo and 0o.
Equations [6] and [7] are coupled, nonlinear differential equations that cannot be solved explicitly. It is not possible to derive the solution as an algebraic expression that links the flyrock distance to the input parameters. The equations must be solved by numerical methods that trace the ballistic path of the flyrock in small increments of time. Even in the absence of a detailed numerical solution, some features of the ballistic path can be deduced from the rate equations.
1. Calculation of the maximum travel distance requires only six parameters: p, CD, A, M, Vo, and 0o.
2. The deceleration in both x- and y-directions is proportional to the ratio of flyrock surface area to its mass (A/M). This identifies the important effect that rock shape has on the throw distance - the higher the area per unit mass the greater the drag force on all rocks of the same mass.
3. Flyrock shape also defines the applicable drag constant. CD is a dimensionless number that depends solely on shape
- it is insignificantly affected by atmospheric conditions (temperature, pressure, precipitation, wind) as well as the velocity of the flyrock (up to the sonic limit). The six parameters that are required for the calculation of flyrock range are discussed and plausible values for them are identified below.
Air density: The density of air at standard temperature and pressure (1.24 kg/m3) can readily be adjusted to the ambient conditions at the blast site.
Presented area: For regular shapes such as spheres, cubes, rods. slabs, plates, and discs the surface areas are readily calculated. The surface areas of irregular fragments produced by blasting have been considered in the technical literature, e.g. Chernigovskii (1985), McCleskey (1988), Kljuna and Catovic (2019). The rectangular parallelepipedic shape is an acceptable approximation for the calculation of the surface areas of such fragments. Fragment mass is related to the surface areas by the shape factor (SF). This factor is the ratio of the surface area averaged over all orientations of an irregular fragment of a given mass to the presented area of a sphere of equal mass. For spheres, SF equals 1.00; for compact shapes it is 1.1-1.25; 1.34 for short slabs and about 2.0 for long, slender shapes. Drag coefficient: Typical values are listed in Kinney and Graham (1995) and NASA (2021). The following general values are relevant to flyrock analysis: rough spheres 0.5-0.8; compact shapes about 1.0; structural shapes (flat and round bar, plate, angles, and channels) 1.2-1.8; large ungainly shapes 1.8-2.5. A key point to note is that drag coefficients that are likely to occur in flyrock analysis cover a relatively small range from about 0.6 to 1.8.
Velocity: Indicative flyrock velocities are listed in Table I and cover the range from about 10 m/s to greater than 100 m/s. In running a trajectory model it is convenient to consider flyrock velocity as a free parameter and derive predictions of flyrock distances for a range of velocities, thereby establishing the link between velocity, mass, and range.
The use of high-speed cameras, with frame rates >1000 frames per second, is well established in the blasting environment for assessing such factors as initiation system timing and face movement. Placing an object of known size and/or surveying the face coupled to a known frame rate of the high-speed camera enables an object to be tracked, the distance measured, and velocity to be calculated. Table I illustrates a range of values measured during blast monitoring conducted by AECI Mining Explosives in many different mining and blasting applications.
Launch angle: Flyrock analyses are generally made to establish the upper limit to expected throw distances. In vacuum, maximum range occurs at 45° launch angle; in air, the maximum is attained at 30° to 60°. Launch angle is not an important determinant of the range of a given mass of flyrock - at any given velocity, maximum range changes less than 10% over a broad range of angles.
Three worked examples are given below with calculations of ballistic trajectories to illustrate the potential uses of the trajectory model. The first is the analysis of the distance of throw of the optimal-sized rock from a 5-inch (127 mm) blast-hole (Lundborg et al., 1975) calculated with a more realistic, non-spherical rock shape. The second example examines the variation of throw distance with rock size for a range of velocities and determines the screening effect of air resistance on the range attained by different sizes of rock. The third example examines he effect of flyrock velocity on throw distance in the presence of air drag.
Trajectory calculations
Example 1. Effect of rock shape on range
The ballistic properties of the optimal-sized fragment from a 5-inch. (127 mm) blast-hole as defined by Lundborg's equations (Equations [1-3]) are:
Shape factor 1.00
Diameter 293 mm
Presented area 0.0674 m2
Mass 34.243 kg
Velocity 170.6 m/s
Maximum range 761 m
It should be noted that in the Lunborg model flyrock mass and presented area are calculated from the diameter of ball-shaped rocks. The range of the above optimal rock size as a function of velocity calculated with the air-drag trajectory model as described above in Equations [1-3] is shown in Figure 1 as curve A (spherical rock).
It is seen that the calculated range for spherical rocks is very close to 760 m, as predicted by Equation [1]. It is reached at a launch velocity of about 171 m/s, as predicted by Equation [3]. When the shape factor is changed from 1.0 to 1.34 to reflect a non-spheroidal shape - a parallelepiped fragment with side ratios of 1.6:1.0:0.6 - the trajectory calculations yield curve B. The range attained with this shape at 170 m/s is less than the predicted value by Equation [1], being 618 m in place of 760 m. The velocity required to attain the predicted range of 761 m increases from 170 m/s to 250 m/s. Both effects can be understood as resulting from the larger presented area of the flyrock compared to a ball shape (of equal mass), and the larger drag force acting on it.
The above example illustrates that the Lundborg family of graphs should not be used for any fragment shape other than spheroidal. In the example, the substitution of a more realistic shape for the optimal fragment size resulted in a decrease of the range by 19% and an increase of 46% in the velocity required to attain the maximum range predicted by the Lundborg equation (Equation [1]). This decrease in range was obtained with an increase of the shape factor from 1.00 (ball) to 1.34 (parallelepipedic). Similar effects would be obtained for any other choice of fragment shape, since in all cases the shape factor would be larger than 1.00.
In conclusion, it is not an acceptable approximation to substitute some representative flyrock size, such as the average length, for the diameter of a ball shape and assume the equivalence of that length with the diameter of a sphere in order to predict the range using the Lundborg curves.
Example 2. Effect of rock mass on throw distance
Figure 2 presents the results for the maximum range attained with rocks from 0.1 kg to 50 kg and shape factor 1.34. Launch velocities from 15 m/s to 250 m/s are considered, which probably covers the full range of velocities encountered in bench blasting operations. To generate Figure 2, the trajectory algorithm was run in parametric mode: at each given rock mass, and the velocity was varied over its full range of values. Each data-point in Figure 2 is the result of one run.
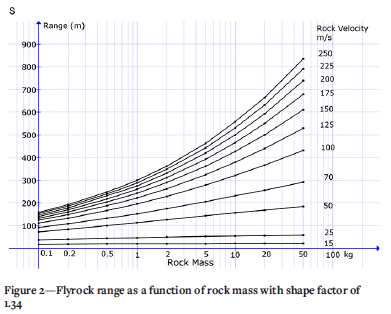
By inspection, it is evident that at a given velocity, the throw distances increase monotonically with fragment mass. In the range of mass and velocity values investigated, there is no optimum fragment size which attains the farthest throw distance.
The upper curve labelled 250 m/s traces the throw distance that cannot be exceeded with the range of rock masses and velocities listed in Figure 2. Some general trends are evident. Rocks under 1 kg all fall to the ground within 300 m; 0.5 kg rocks within 250 m, and 0.2 kg rocks within 200 m. Conversely, distances exceeding 500 m can be attained only by rocks larger than about 6 or 7 kg. Distances of 700-800 m would require rocks larger than 25 kg and possessing velocities higher than 225 m/s.
Example 3. Effect of velocity on throw distance
Figure 3 examines the effect of projection velocity from 15 m/s to 250 m/s on the throw distance for rock sizes from 0.1 kg to 50 kg. Again, the trajectory model was run in parametric mode, where for each selected velocity the rock mass was varied from 0.1 kg to 50 kg.
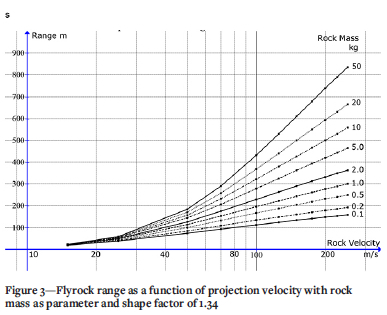
Some notable features of Figure 3 are:
> Under 50 m/s, throw distances increase relatively slowly with velocity and all sizes of rock are spread in a tight group: 5 m wide at 15 m/s, 20 m at 25 m/s, and 100 m at 50 m/s.
> Above 50 m/s, the spread of distances fans out as the range difference between low and high rock masses becomes increasingly divergent with increasing velocity.
> Under 30 m/s, all sizes of rock are contained within 100 m; within 200 m at 50 m/s, 300 m at 70 m/s; 500 m at 115 m/s, and within 700 m at 180 m/s.
> Rock throw in excess of 500 m requires large stones (>50 kg) at velocities of at least about 100 m/s, or velocities higher than 200 m/s for stones larger than 10 kg.
Figure 3 offers an explanation for a common observation that wild flyrock is often associated with surprisingly heavy rocks. At the highest flyrock velocity assumed in this study (250 m/s), only rocks larger than about 7 kg can attain distances exceeding 500 m.
With the information encapsulated in Figures 1, 2, and 3, and even in the absence of an accurate predictive model for velocity, trajectory calculations made by numerically solving the flyrock equations of motion can already to a large extent provide useful answers to many of the questions a flyrock model should be able to address, such as:
> Give realistic estimates of expected maximum throw distances, incorporating the effects of rock size, and help to establish appropriate exclusion and other safety zones.
> Indicate control measures and restrictions to be imposed on the blast in order to restrict flyrock thrown in the vicinity of vulnerable infrastructure and public areas.
> Yield reliable estimates of the influence of rock mass and rock velocity on maximum range and determine the screening effect of air on the dispersion of various sized rocks.
> Forensic analysis of flyrock incidents where detailed knowledge of the trajectory would assist in understanding the source of the flyrock. Such details would include the effect of an elevation change between source and landing point, terminal velocity, angle of fall, and rock sizes that are capable of reaching the location of the observed damage. Numerical calculations of trajectories would also yield values for terminal momentum and energy at impact, both of which are useful for assessing the observed damage.
Flyrock projection velocity and sources of momentum
The unrealistic blasting conditions required to propel rocks to velocities of the order of 100 m/s, as derived in the Appendix, suggest that the blast wave propagating through air is not an efficient mechanism for the transfer of momentum to external objects. Yet sizeable rocks have been observed falling 500-600 m from the bench, which would require launch velocities well in excess of 100 m/s, as shown by trajectory calculations in example 3 above. Clearly, short-duration pressure pulses in air cannot be the only, or perhaps even the primary, mechanism for flyrock projection.
The modelling of rock flight ballistics has indicted that significant sources of flyrock projection are those that provide a mechanism for the transfer of momentum, and hence velocity, to rock. It is generally acknowledged that rock fragmentation and throw occur through the combined influence of stress wave action and gas pressure action. While it is possible to conceptualize rock throw along these lines, the details of mechanisms that allow for the transfer of momentum to rock have not been established and will form the subject of further studies by the authors.
Conclusions
> A historical review has been given of flyrock prediction models in three broad categories: correlation studies and regression analyses using artificial neural networks (ANNs) and similar approaches; scaled burden and scaled depth of burial; and trajectory calculations with and without air resistance.
> An inherent deficiency of correlation and regression studies is that they do not address the root causes of flyrock nor the physical mechanisms resulting in its projection. Furthermore, without knowing how long-range flyrock can be generated, it is unlikely that its occurrence can be prevented or at least largely suppressed.
> Trajectory calculations without taking air drag into account are highly deficient in two respects. They do not consider the influence of rock shape and size on the range and they overestimate the range by factors of 2 to 8.
> The predictions of the Lundborg et al. (1975) model for maximum throw distance are applicable only to ball-shaped rock fragments and are underpinned by a model of momentum transfer to rocks that is not supported by present-day knowledge of the properties of blast waves. It is concluded that the Lundborg model significantly overestimates the expected range.
> The McKenzie (2009) model of flyrock projection based on the scaled epth of burial appears to have replaced previous correlation approaches based on scaled burden. McKenzie calibrated the velocity calculations of his model against the Lunborg values and this renders his predictions of range based on rock velocity and shape questionable.
> The results presented in this study affirm that trajectory calculation incorporating air drag affords the most insightful approach to the analysis of flyrock. It permits the formulation of a scientifically sound, quantitative physical model for the prediction of throw distance, and reduces all the multiple (and often little understood) causes of flyrock generation to a single parameter - the launch velocity.
> It has been pointed out that even without a proven and generally applicable velocity model, trajectory calculations can yield useful information in a number of important areas of flyrock analysis, such as realistic estimates of maximum range, appropriate safety distances, degree of control required to limit the range of flyrock in the vicinity of public areas and infrastructure, and investigations of flyrock incidents.
> Analysis of the transfer of momentum to rocks (see Appendix) suggests that the pressure impulse of a blast wave is not the primary cause of flyrock propulsion. It is proposed that alternative sources of flyrock velocity reside in the action of stress waves and gas pressure on broken rock. Future work in flyrock generation and projection should focus on elucidating the mechanisms that mediate the transfer of momentum from these sources to rock.
Appendix
A re-examination of Lundborg's blast impulse rock velocity model
The mechanism proposed by Lundborg et al. (1975) for the transfer of momentum to rocks is based on considerations of a quantity of charge W (kg) surrounded by a number of loose rocks and exposed to the blast wave spreading away from the borehole after detonation of the charge. A blast wave from a single, concentrated source is a steep-fronted, short-duration pressure pulse travelling at supersonic speed in the ambient atmosphere. The interaction between the blast wave and rocks can be modelled through the concept of blast wave impulse by the following equation:
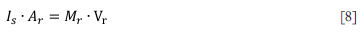
where Is is the specific impulse of the blast wave (per unit area of the wave front) with units of Pa-s. Ar is the surface area of a rock exposed to the blast wave, Mr its mass, and Vr is the velocity that the rock acquires impulsively. The physical significance of impulse intensity in flyrock modelling is that it is a measure of the force per unit area exerted on a surface by the pressure pulse of the blast wave.
The properties of blast waves have been well studied, in particular, the impulse intensity as it is directly connected to the damage causing capacity of airblast. Charts and tabulations of specific impulse intensity may be found in various sources, e.g. Baker (1973), Kinney and Graham (1995), Smith and Hetherington (1994), and Held (1983). A distinction must be made between incident and reflected pressure waves and the corresponding incident and reflected impulse values.
The specific impulse of a blast wave at a distance R (m) from a charge W (kg) can be written as a functional relationship:

where Z is the scaled distance  and f is a function of the scaled distance such that for each value of Z, it yields the corresponding value of scaled impulse is. The shape of this function must be determined empirically. In many applications, and over a limited range, it can be adequately represented by a power law equation.
Equation [9] can be applied to derive the blast wave impulse acting on the optimal-sized flyrock from a 5-inch hole (127 mm) in order to propel it to Lundborg's predicted velocity. The properties of this optimal rock are listed above under example 1. The properties required to evaluate momentum transfer are the mass (34.2 kg), velocity (170.6 m/s), and the surface area Ar.
Substituting Equation [8] for Is in Equation [9], the impulse momentum-equation becomes:
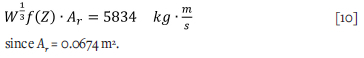
Equation [10] defines the charge mass W (as W1'3) required to project the 5-inch hole, optimum-sized rock to a velocity of 170.6 m/s, at which it is predicted to attain its maximum range. Charge quantities required to achieve this at various scaled distances from the charge are listed in Table II.
The values of charge mass listed in Table II (and considered to be concentrated as one lump charge) indicate that unless a rock is within a very short distance of the charge - within two charge diameters - it will not be driven to the predicted velocity (Lundborg et al., 1975) with charge sizes that can reasonably be associated with quarry and open pit bench blasting and hence will not attain the predicted maximum range. A serious conceptual difficulty in the application of the Lundborg model is that it considers the whole borehole charge as one lumped mass (of spherical shape) as the source of the blast wave.
References
Adhikari, G.R. 1999. Studies of flyrock at limestone quarries. Rock Mechanics and Rock Engineering, vol. 32, no. 4. pp. 291-301. [ Links ]
Aghajani-Bazzazi, A., Osanloo, M., and Azimi, Y. 2010. Flyrock prediction by multiple regression analysis in Esfordi phosphate mine of Iran. Rock Fragmentation by Blasting. Sanchidrian, J.A. (ed.). Taylor & Francis, London. pp. 649-657. [ Links ]
Baker, W.E. 1973. Explosions in Air. University of Texas Press, Austin, TX, [ Links ].
Bauer, A., Bürchell, S.L., and Crosby, W.A. 1982. Use of high speed photography in open pit blasting. Mining Resource Engineering Ltd, Kingston, Ontario, Canada. [ Links ]
Chiappetta, F. 2009. Combining electronic detonators with stem charges and air decks. Proceedings of the 9th Symposium on Rock Fragmentation by Blasting (FRAGBLAST9), Granada, Spain, 14-17 September 2009. CRC Press. [ Links ]
Chiapetta, R.F., Bauer A., Dailey, O.J., and Burchell, S.J. 1983. The use of high speed motion picture photography in blast evaluation and design. Proceedings of the 9th Annual Conference on Explosives and Blasting Technique. International Society of Explosives Engineers. pp. 258-309, [ Links ]
Chiapetta, R.F., Treleaven, T., Nixon, E., and Smith, J.D. 1998. History and expansion of the Panama Canal. Fragblast, vol. 2, no. 3. pp. 312-340. [ Links ]
Chernigovskii, A. 1985. Movement of rock subject to air drag. Application of Directional Blasting in Mining and Civil Engineering. Oxonian Press, New Delhi. [ Links ]
Cunningham, C. 2006. Blast hole pressure: What it really means and how we should use it. Fragblast, vol. 10, no. 1. pp. 33-45. [ Links ]
Ghasemi, E., Sari, M., and Ataei, M. 2012. Development of an empirical model for predicting the effects of controllable blasting parameters on flyrock distance in surface mines. International Journal of Rock Mechanics and Mining Sciences, vol. 52. pp. 1631-1670. [ Links ]
Held, M. 1983. Blast waves in free air. Propellants, Explosives, Pyrotechnics, vol. 8. pp. 1-7. [ Links ]
ISEE. 2011. Flyrock. Blasters' Handbook. Stiehr, J.F. (ed.) Chapter 15. International Society of Explosives Engineers, Cleveland, OH. pp. 385-410. [ Links ]
Kinney, G.F. and Graham, J. 1995. Explosive Shocks In Air. 2nd edn. Springer-Verlag, New York. [ Links ]
Kljuno, E. and Catovic, A. 2019. Estimation of projected surface area of irregularly shaped fragments. Defence Technology, vol. 15. pp. 198-209. [ Links ]
Little, T.N. 2007. Flyrock risk. Proceedings of EXPLO 2007 Blasting: Techniques and Technology, Wollongong, NSW Australia, 3-14 September 2007. Australasian Institute of Mining and Metallurgy, Carlton, Vic. pp. 35-43. [ Links ]
Lundborg, N. 1981. The probability of flyrock damage. Report DS 1981:5. Swedish Detonic Foundation (SveDeFo), Stockholm, Sweden. [ Links ]
Lundborg, N. 1974. The hazards of fly rock when blasting. Report DS 1974:12. Swedish Detonic Foundation (SveDeFo), Stockholm, Sweden. [ Links ]
Lundborg, N., Persson, A., Ladegaard-Pedersen, A., and Holmberg, R. 1975. Keeping the lid on flyrock in open-pit blasting. Engineering and Mining Journal, May 1975. pp. 95-100. [ Links ]
McCleskey, F. 1988. Drag coefficients for irregular fragments. Report NSWC TR 87-78, Naval Surface Weapon Warfare Center, Dahlgren, VA. [ Links ]
McKenzie, C.K. 2009. Flyrock range and fragment size prediction. Proceedings of the 35th Annual Conference on Explosives and Blasting Technique, Denver, CO, 8-11 February 2009, vol. 2. International Society of Explosives Engineers, Cleveland, OH. pp. 17-33. [ Links ]
McKenzie, C. 2018. Flyrock model validation. Proceedings of the ISEE Australia 4th Annual Conference, Fremantle, WA, 8-9 November 2018. International Society of Explosives Engineers Australian Chapter., Australia, https://iseeaustralia.org/wp-content/uploads/2022/08/1_2McKenzie_FlyrockModelValidation-1.pdf [ Links ]
NASA. Shape effects on drag. Hall, N. (ed.). Glenn Research Centre. https://www.grc.nasa.gov/www/k-12/airplane/shaped.html [accessed 3 October 2021] [ Links ]
Raina, A.K. and Murthy, V.M.S.R. 2016a. Prediction of flyrock distance in open pit blasting using surface response analysis. Geotechnical and Geological Engineering, vol. 34. pp. 15-28. [ Links ]
Raina, A.K. and Murthy, V.M.S.R. 2016b. Importance and sensitivity of variables defining throw and flyrock in surface blasting by artificial neural network method. Current Science, vol. 111, no. 9. pp. 1524-1531. [ Links ]
Raina., A.K., Murthy, V.M.S.R., and Soni, A.K. 2015. Estimating flyrock distance in bench blasting through blast induced pressure measurements in rock. International Journal of Rock Mechanics and Mining Sciences, vol. 76. pp. 209-216. [ Links ]
Richards, A.B. and Moore, A.J. 2002. Flyrock control-By chance or design. Proceedings of the 30th ISEE Conference on Explosives and Blasting Technique, New Orleans, LA. International Society of Explosives Engineers, Cleveland, OH. [ Links ]
Richards, A.B. and Moore, A.J. 2005. Golden Pike cut-back flyrock control and calibration of a predictive model. Report no. KCG-0503. Terrock Consulting Engineers, Victoria, Australia. [ Links ]
Roth, J.A. 1979. Model for the determination of flyrock range as a function of shot conditions. Report no. NTIS PB81-222358. U S Department of Commerce. 97 pp. [ Links ]
Saunderson, H.C. 2008. Equations of motion and ballistic paths of volcanic ejecta. Computers and Geosciences, vol. 34, no. 7. pp. 802-814. [ Links ]
Smith, P.D. and Hetherington, J.D. 1994. Blast and Ballistic Loading of Structures. Taylor & Francis, Chichester, UK. [ Links ]
Stojadinovic, S., Lilic N., Obradovic, I., and Pantovic, R. 2016. Prediction of flyrock launch velocity using artificial neural networks. Neural Computing and Applications, vol. 27. pp. 515-524. [ Links ]
Stojadinovic, S., Pantovic, R., and Zikic, M. 2011. Prediction of flyrock trajectories for forensic applications using ballistic flight equations. International Journal of Rock Mechanics and Mining Sciences, vol. 48. pp. 1086-1094. [ Links ]
Stojadinovic, S., Lilic, N., Pantovic, R., Zikic, M., Denic, M., Cokorilo, V., Svrkota, I., and Petrovic, D. 2013. A new model for determining flyrock drag coefficient. International Journal of Rock Mechanics and Mining Sciences, vol. 62. pp. 68-73. [ Links ]
St George, J.D. and Gibson, M.F. 2001. Estimation of flyrock travel distances. A probabilistic approach. Proceedings of the EXPLO 2001 Conference, Hunter Valley. Australasian Institute of Mining and Metallurgy, Melbourne. pp. 245-248. [ Links ]
Trivedi, R., Singh, T.N., Mudgal, K., and Gupta, N. 2014. Application of artificial neural network for blast performance evaluation. International Journal of Engineering Research and Technology, vol. 3, no. 5. pp. 5645-5674. [ Links ]
Van der Walt, J. and Spiteri, W.A. 2020. A critical analysis of recent research into the prediction of flyrock and related issues in surface blasting activities, Journal of the Southern African Institute of Mining and Metallurgy, vol. 120, no. 12. pp. 701-714. [ Links ]
Workman, J.L. and Calder, P.N. 1994. Flyrock prediction and control in surface mine blasting. Proceedings of the ISEE 20th Annual Conference of Explosives and Blasting Technique, Austin, TX, 30 January-3 February 1994. International Society of Explosives Engineers, Cleveland, OH. pp. 59-74. [ Links ]
 Correspondence:
T. Szendrei
Email: szendrei@icon.co.za
Received: 26 Oct. 2021
Revised: 3 Mar. 2022
Accepted: 2 Nov. 2022
Published: December 2022

