


Services on Demand
Article
 English (pdf)
 Article in xml format
 Article references
Indicators

Related links
-
 Cited by Google
 -
 Similars in Google
Share

 Permalink
Journal of the Southern African Institute of Mining and Metallurgy
On-line version ISSN 2411-9717
Print version ISSN 2225-6253
J. S. Afr. Inst. Min. Metall. vol.122 n.12 Johannesburg Dec. 2022
http://dx.doi.org/10.17159/2411-9717/1639/2022
PROFESSIONAL TECHNNICAL AND SCIENTIFIC PAPERS
Studies on fluorination of Fe3O4 (magnetite) by NH4HF2
L. ZhangI, II; Y. ZhouI, II; H. WangI, II; C. MoI, II
ISchool of Mechanical Engineering and Automation, Shenyang Institute of Technology, China. ORCID: Y. Zhou: https://orcid.org/0000-0001-9537-9938
IILiaoning Key Laboratory of Information Physics Fusion and Intelligent Manufacturing for CNC Machine, Shenyang Institute of Technology, China
SYNOPSIS
Fluorination of magnetite (Fe3O4) by NH4HF2 was investigated using simultaneous thermogravimetry and differential thermal analysis (TG-DTA), and observing the morphology and phase changes using scanning electron microscopy with energy dispersive X-ray spectroscopy (SEM-EDS) and X-ray diffractometry (XRD). The results indicate that fluorination with the involvement of oxygen begins at room temperature, peaks at 1784ºC, and is completed at 200ºC with the formation of only (NH4)3FeF6. On heating, (NH4)3FeF6 gradually releases NH4F by the formation of NH4FeF4 at 259ºC, then (NH4)0.l8FeF3 at 327ºC, and finally FeF3 with minor FeF2 at 400ºC due to the partial reduction of Fe (III) to Fe (II). At 550ºC, FeF3 is oxidized to FeOF/Fe2O3.
Keywords: Ammonium bifluoride; fluorination; thermal decomposition; FeF3; XRD.
Introduction
Transitional metal fluorides such as FeF3 have gained growing attentions due to their potential for use as electrode materials in lithium ion batteries owing to their low cost and high specific capacities (Ignatiev et al., 2020; Shimoda et al., 2020; Zhou et al., 2017; Zhou et al., 2018). Fe is the fourth most abundant element in the Earth's crust and the cheapest metal in the market. In particular, the theoretical capacity of FeF3 is up to 712 mA h g-1 because of its unique reaction mechanism during the charge and discharge processes. However, FeF3 prepared by hydrometallurgical processes always contains crystal water such as FeF3-3H2O. During the dehydraion process, iron oxides form (Sophronov et al., 2016) because Fe fluorides are unstable in the presence of water vapour. The formation of iron oxides significantly decreased the capacity. FeF3 can also be prepared via thermal process using anhydrous HF or F2 gas at high temperature in special corrosion-resistant equipment (Johnson., 1981). NH4F and NH4HF2 are recognized as cheaper and versatile fluorinating agent used at low temperatures (<240°C) (Andreev, 2008; Claux et al., 2016; Gordienko et al., 2017; Juneja et al., 1995; Laptash and Maslennikova, 2012; Laptash and Polyshchuk, 1995; Mukherjee et al., 2011; Pourroy and Poix, 1989; Sophronov et al., 2016). However, excess NH4F should be added in order to produce oxygen-free fluorides due to the highly hygroscopic nature of NH4F (Mukherjee et al., 2011; Pourroy and Poix, 1989; Sophronov et al., 2016). Fluorination of different oxides by NH4HF2 therefore appears to be the most convenient method for obtaining oxygen-free fluorides.
The melting and boiling point of NH4HF2 are 126.8°C and 238.8°C, respectively. It is known that that NH4HF2 can react with Fe2O3 or FeTiO3 (Andreev, 2008; Gordienko et al., 2017; Juneja et al., 1995; Laptash and Maslennikova, 2012; Laptash and Polyshchuk, 1995) below 230°C to form (NH4)3FeF6 and/or NH4FeF3 according to follow reaction:
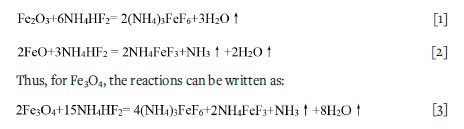
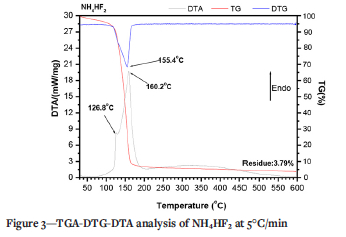
On heating, NH4FeF3 decomposes to form FeF2 in ammonium media at 350°C (Andreev., 2008); while (NH4)3FeF6 gradually releases NH4F to form FeF3 via two or three steps (Alexeiko et al., 2008; Juneja et al., 1995; Kraidenko, 2008; Laptash and Polyshchuk, 1995; Pourroy and Poix, 1989; Shinn et al., 1966; Sophronov et al., 2016), as listed in Table I. According to Alexeiko et al. (2008), Juneja et al.1(995), Pourroy and Poix (1989), Shinn, Crocket, and Haendler (1966); and Sophronov et al. (2016) the reaction proceeds in two stages:
However, Laptash and Polyshchuk (1995) and Kraidenko (2008) indicated that there exists an intermediate phase between (NH)3FeF6 and NH4FeF4 comprising (NH4)2.5FeF5.5 at 235°C and (NH4)2FeF5 at 255°C. Wang et al. (2021) indicated that (NH4)018FeF3 forms at 320°C between NH4FeF4 and FeF3. With further temperature increase up to 400°C, FeF3 with minor FeF2 forms due to the reduction of Fe (III) (Alexeiko et al., 2008; Laptash and Polyshchuk, 1995; Pourroy and Poix, 1989). Furthermore, FeF3 is oxidized due to the destruction of NH4F (Alexeiko et al., 2008; Juneja et al., 1995; Sophronov et al., 2016). Therefore, the reaction pathways between NH4HF2 and Fe3Ö4 are complicated. However, to authors' knowledge, there are no reports about the fluorination of Fe3O4 by NH4HF2. In the present work, the possible reaction pathways involved during the fluorination of Fe3O4 by NH4HF2 were simultaneously determined by TG-DTA. The fluorides in each stage were prepared by direct thermal treatment and analysed using SEM-EDS and XRD. The results of this work may be useful for studies of the fluorination of Fe-containing minerals and the production of oxygen-free fluorides.
Experimental
Commercial analytical grade magnetite (Fe3O4, 99.8 wt.%) and ammonium bifluoride (99.5 wt.%) were supplied by Sinopharm Group (China). To ensure complete fluorination, the theoretical mass ratio of NH4HF2:Fe3O4 is 1.8450 according to Equation [3]. In order to investigate the reaction progress, two mass ratios of 2.5 and 3.5 (higher than the theoretical value) were chosen for investigation.
TG-DTA runs with pure NH4HF2 and Fe2O3/NH4HF2 mixtures were carried out in a Shimadzu DTG-60 unit at a rate of 5°C/min from 25°C to 600°C under 20 mL/min N2 gas. Derivative thermogravimetry (DTG) curves were obtained as the first derivative of the TG curves. Based on TG-DTG-DTA results, the critical reaction temperatures of DTA curves were determined. In order to analyses the composition and determine the morphologies and phases of products before and after each reaction stage, Fe3O4 was first mixed with NH4HF2 at different mass ratios (NH4HF2: Fe3O4 = 2.5 or 3.5), put into a pure nickel crucible, then placed in a furnace for the assays. Heating was carried out at a rate of 5°C/min. Once the selected temperature was reached, the samples remained isothermal for 1 hour, and then allowed to cool to room temperature for further characterization. In order to increase repeatability, each test was repeated three times using 100 g Fe3O4.
The phases, morphologies, and composition of Fe3O4 powder, NH4HF2 agent, and fluorides produced were determined by XRD (D/Max-2500 pc type X-ray diffractometer) and scanning electron microscopy with energy dispersive X-ray spectroscopy (SEM-EDS) (Oxford Instruments, INCA)
Results
Properties of Fe3O4 powder and NH4HF2 agent
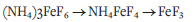
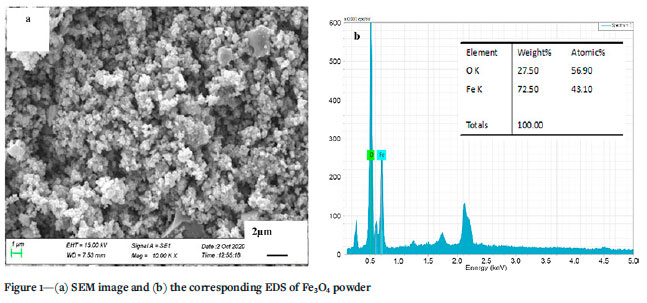
Figure 1 shows a SEM image and the corresponding EDS trace of Fe3O4 particles. Fe3O4 particles exhibit a spherical morphology with particle size less than 500 nm. EDS results in Figure 1b indicated that only Fe and O were detected. The atomic ratio of Fe to O is close to 3:4, which coincides well with the chemical formula of Fe3O4. The XRD results indicate that this phase is Fe3O4 (#19-0629) (magnetite). Figure 2 shows the XRD spectrum of NH4HF2 agent (#12-0302). Clearly, NH4HF2 agent has a crystalline nature.
Thermal analysis of NH4HF2
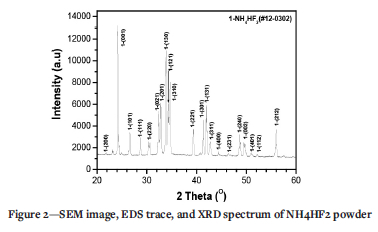
Figure 3 shows the TG-DTG-DTA curve of NH4HF2 between 25 and 600°C. A weak endothermic peak is observed at 126.8°C due to the melting of NH4HF2 (Carling and Westrum, 1976; House and Rippon, 1981; Resentera et al., 2020; White and Pistorius, 1972). The second well-defined endothermic peak overlaps the previous peak, having a maximum at 160.2°CThis peak corresponds to the decomposition and total removal of NH4HF2 (Carling and Westrum, 1976; House and Rippon, 1981; Resentera et al., 2020; White and Pistorius, 1972), as observed on the TGA-DTG curve.
Furthermore, the mass loss of NH4HF2 reagent begins from room temperature, as found in previous investigations (Carling and Westrum, 1976; House and Rippon, 1981; Resentera et al., 2020; White and Pistorius, 1972).
Thermal analysis of the fluorination of Fe3O4 with NH4HF2
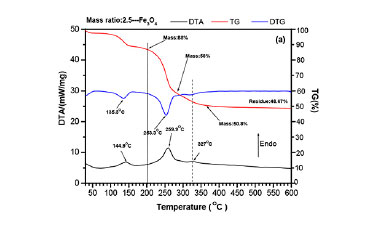
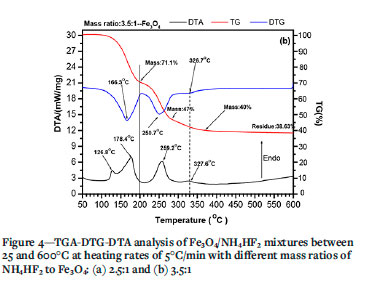
Figure 4 shows the TG-DTG-DTA curves of Fe3O4/NH4HF2 mixtures between 25 and 600°C at different mass ratios. Clearly, two endothermic peaks are observed for a mass ratio of 2.5: 144.9°C and 259.9°C as seen in Figure 4a. Moreover, a weak endothermic peak appears at 327°C. For a mass ratio of 3.5, two new endothermic peaks appear at 126.8°C and 178.4°C, as seen in Figure 4b. However, the peak at 144.9°Cdisappears or is overlapped by the peaks at 126.8°C and 178.4°¾ while the peak at 327°C increases significantly. From Figure 4a, it can also be seen that the mass loss of about 2-3% begins at room temperature for a mass ratio of 2.5, the same as for pure NH4HF2 (Figure 3); while a minor mass gain (less than 1%) is observed for a mass ratio of 3.5 before 100°C (Figure 4b). With increasing temperature, a mass loss of about 10% is observed between 100 and 150°C for a mass ratio of 2.5; after which a levelling off occurs between 150 and 200°C. However, significant mass loss (approx. 28.9%) is observed between 100 and 200°C for a mass ratio of 3.5 without the curve flattening. By comparison, there are at least three endothermic peaks, which coincide well with the peaks in the DTG curves with large mass loss at 178.4ºC 259.2-259.9°C,and 327-327.6ºC. The masses of residues for different temperatures are listed in Table II. In this temperature range, Fe3O4 is stable even at ambient condition (Ouertani et al., 2020). These results indicate that the formation of the above three peaks may be due to chemical reactions.
Characterization of the fluorination products of Fe3O4
In order to identify and analyse the products involved in TG-DTG-DTA curves of Figure 4, samples were prepared by direct thermal treatment at different temperatures for 1 hour and then analysed using XRD. The results are shown in Figure 5. Clearly, the products between 135 and 180°C at both mass ratios consist chiefly of (NH4)3FeF6 (#22-1040) with minor NH4HF2 (#12-0302) and Fe3O4 (#19-0629); the peak intensity of NH4HF2 decreases with increasing temperature and disappears at 270ºC the peak of Fe3O4 appeared between 135 and 180°C disappears at 270ºC only NH4FeF4 (#20-0503) is detected at 270°C at both mass ratios. These results indicate that the mass ratio of NH4HF2 to Fe3O4 has no influence on the fluoride phases between 135 and 270°C. In this case, only the fluorides with the mass ratio of 2.5 after direct thermal treatment were chosen for analysis.
Macroscopic morphology investigation showed that the fluorides formed between 135 and 180°C exhibit a similar grey color with increasing temperature: light grey, grey, and dark grey. Figure 6 shows the SEM images and the corresponding EDS data for fluorides produced between 135 and 270°C. Clearly, the fluorides formed between 135 and 180°C exhibit a similar large, faceted-grain morphology, as seen in Figures 6a, 6c, and 6e. Furthermore, the particle size increases with increasing temperature, although, the average grain size at 180°C is still less than 1 μm. The corresponding EDS results in Figures 6b, 6d, and 6f indicate that the fluorides consist of Fe, F, and N, with minor O. Hydrogen was below the detection limit. In order to obtain more precise results for Fe and F, O is omitted during the quantitative analysis. From Figure 6, it can be seen that the content of Fe and N increases while the content of F decreases with increasing temperature. The atomic ratios of F:Fe of the fluorides at 135°C, 150°C, and 180°C are 6.4, 6.2, and 6.0, respectively. These results suggest that NH4HF2 is lost between 135 and 180°C, which is corroborated by the decreasing peak of NH4HF2 in Figure 5.
The fluorides at 270°C become white (Figure 6g). Clearly, the faceted particles formed between 135 and 180°C disappear while finer spherical particles with average size less than 100 nm appear. The EDS results in Figure 6h indicate that the fluorides consist of Fe, F, and N without O, and the atomic ratio of F:Fe further decreases to 4.0.
The fluorides become green at 330°C. The size of the spherical particles slightly increases to larger than 150 nm and significant agglomeration occurs, as seen in Figure 7a. The EDS results in Figure 7b indicate that the fluorides at 330°C also consist of Fe and F with minor N. However, the atomic ratio of F:Fe further decreases to 3.0, which is close to the formula of FeF3. However, the XRD results in Figure 8a indicate that this is not FeF3 but a new phase comprising (NH4)018FeF3 (#47-0646). The results suggest that an intermediate phase, (NH4)0.18FeF3 (#47-0646), forms between NH4FeF4 and FeF3. In other words, a new chemical reaction occurs between 270 and 330°C.
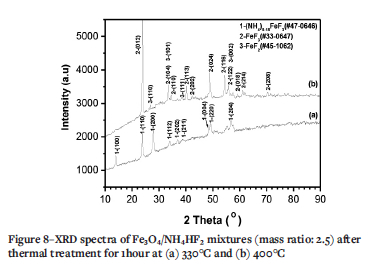
The fluorides formed at 400°C (Figure 7c) are also green. Clearly, the particle size is the same as that formed at 330°C. However, the EDS results in Figure 7d indicate that the fluorides at 400°C consist of Fe and F without N. The atomic ratio of F:Fe is close to 3, the formula ratio of FeF3. However, the XRD results in Figure 8b indicate that this is FeF3 (#33-0647) with minor FeF2 (#45-1062).
The fluorides become red at 550°C (Figure 9a). Clearly, the average particle size increases up to 500 nm. The EDS results in Figure 9b indicate that the fluorides consist of Fe and O with minor F. The atomic ratio of O:Fe is close to 3:2 of the formula ratio of Fe2O3. The XRD results in Figure 9c indicate that the fluorides consist mostly of Fe2O3 (#33-0664) with minor FeF3(#33-0647) and FeF2 (#45-1062).
Discussion
The melting of NH4HF2 at 126.8°C (Carling and Westrum, 1976; House and Rippon, 1981; Resentera et al., 2020; White and Pistorius, 1972) leads to an endothermic peak in the DTA curve, as found in this work (Figure 3). This is why a clear peak is observed at 126.8°C for a mass ratio of 3.5 (Figure 4b). Even before the melting of NH4HF2, a minor mass loss occurs due to the decomposition of NH4HF2, as seen in Figures 3 and 4a. With the melting of NH4HF2 at 126.8°C, the mass loss increases sharply and a well-defined endothermic peak with large mass loss occurs at 178.4°C due to the fluorination of Fe3O4. According to Equations [1], [2], and [3], the fluorination of Fe3O4 should form (NH4)3FeF6 and NH4FeF3. However, the results in Figures 5 and 6 indicate that only (NH4)3FeF6 (#22-1040) with a comparable coarse faceted-grain morphology forms between 135 and 180°C. No NH4FeF3 was detected. The results suggest that divalent iron becomes trivalent through the oxidation of Fe3O4 or the involvement of oxygen during the fluorination progress (Laptash et al., 2000). In a word, oxygen is involved in the fluorination reaction according to the reaction:

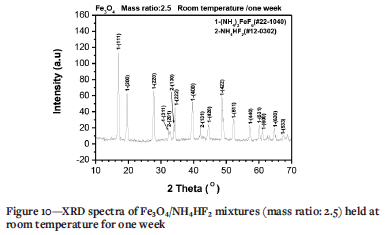
In this case, a minor mass gain should be observed. Figure 4b indicates that a minor mass gain occurs even at room temperature, suggesting fluorination may start at room temperature. To confirm this assumption, a Fe3O4/NH4HF2 mixture with mass ratio of 2.5 was prepared and kept for one week at room temperature, then analysed using XRD (Figure 10). Clearly, only (NH4)3FeF6, and no NH4FeF3, was detected, the same as at 135-180°C (Figure 5). Furthermore, the samples became warm during mixing, and a smell of ammonia was observed. The results suggest that the fluorination of Fe3O4 by NH4HF2 really begins at room temperature, the same as Fe2O3 (Wang et al., 2021).
According to Equation [4], the fluorination of Fe3O4 at room temperature also causes the formation of H2O, which is absorbed by the fluorides. The loss of absorbed H2O between 100 and 150°C (Wang et al., 2020) plus the decomposition and removal of NH4HF2 between 126.8 and 160.2°C (Mukherjee et al., 2011; Resentera et al., 2020; White and Pistorius, 1972) might cause the formation of another weak peak at 144.9ºC as seen in Figure 4a. The peak at 144.9°C will be overlapped by the fluorination of Fe3O4 at 178.4°C at a high mass ratio of 3.5, as seen in Figure 4b.
With the melting of NH4HF2 at 126.8°C, the reaction rate increases sharply due to the faster liquid-solid reaction rate compared to the slower solid-solid reaction rate. Based on the above analysis, the peak at 178.ºC at mass ratio 3.5 is mainly due to the fluorination of Fe3O4 according to Equation [4]. However, according to Equation [4], the mass ratio of NH4HF2 to Fe3O4 for complete fluorination is 2.2140. Therefore, fluorination should be completed for both mass ratios. However, results in Figures 5a and 5b indicate that minor Fe2O3 and NH4HF2 are still detected between 135 and 180°C even after 1 hour, suggesting a slow fluorination rate of Fe3O4.
With increasing temperature, the further fluorination of unreacted Fe3O4 plus the decomposition/sublimation of NH4HF2 will consume all or part of the NH4HF2.In this case, the products at 200°Cshould consist of (NH4)3FeF6, possibly with minor NH4HF2. Theoretical calculation indicates that the product masses at 200°C for mass ratios of 2.5 and 3.5 are 81.77-90% and 55.42-92.23%, in fair agreement with the measured values of 88% and 71.1% from TG curves, as listed in Table II. In other words, the products at 200°C contain major (NH4)3FeF6 with minor NH4HF2 residue. That is reasonable because the boiling point of NH4HF2 (238.8°C) is higher than 200°C. At 238.8ºC all NH4HF2 sublimes. Therefore, either no NH4HF2 will be present or it will be below the detection limit of XRD, as seen in Figure 5.
Figure 4 indicates that a new peak appears at 259.2-259.9ºC in the DTA curves, accompanied by a large mass loss. The value coincides well with the values in the literature (Juneja et al., 1995; Pourroy and Poix, 1989). The XRD results in Figure 5 indicate that a new phase of NH4FeF4 (#20-0503) forms at 270°C. Furthermore, NH4FeF4 (#20-0503) becomes white, and the morphology changes to fine spherical (Figure 6g). From these results, it may be concluded that (NH4)3FeF6 releases NH4F to form NH4FeF4 at 259.2-259.9ºC according to the following reaction:

Theoretical calculation show that NH4FeF4 residues at 280°C for mass ratios of 2.5 and 3.5 are 55.45% and 43.13%, in fair agreement with the measured values of 58% and 47% from the TG curve after consideration of the measurement error, as listed in Table II.
With increasing temperature, NH4FeF4 (#20-0503) will lose NH4F to form FeF3 at temperature above 330°C (Alexeiko et al., 2008; Juneja et al., 1995; Kraidenko, 2008; Laptash and Polyshchu., 1995; Pourroy and Poix, 1989; Shinn, Crosket, and Haemdler, 1966; Sophronov et al., 2016). However, Figure 4 shows that there exists an another peak at 327-327.6ºC. Figures 7a and 8a suggest that the fluoride at 330°C is not FeF3 but (NH4)0.18FeF3 (#470646) with minor N (Bentrup and Menz, 1990). The fluoride of (NH4)0.18FeF3 is a different colour (green) to that formed at 270°C (white). Furthermore, the particle size increases up to 150 nm. with significant agglomeration (Figure 7a). From the above results, it could be concluded that NH4FeF4 lost only part of its NH4F to form a new intermediate phase of (NH4)0.18FeF3 at 327°C. According to theoretical calculation, the residue masses at 330°C for mass ratios of 2.5 and 3.5 are 49.26% and 33.42%. These values are lower than the measured values of 52% and 41%, as seen in Table II. There are three reasons for this. The first is the measurement error, as seen in Table II. The second is the release of NH4F at 327ºC which results in the further fluorination of Fe3O4 residues according to follow reaction:

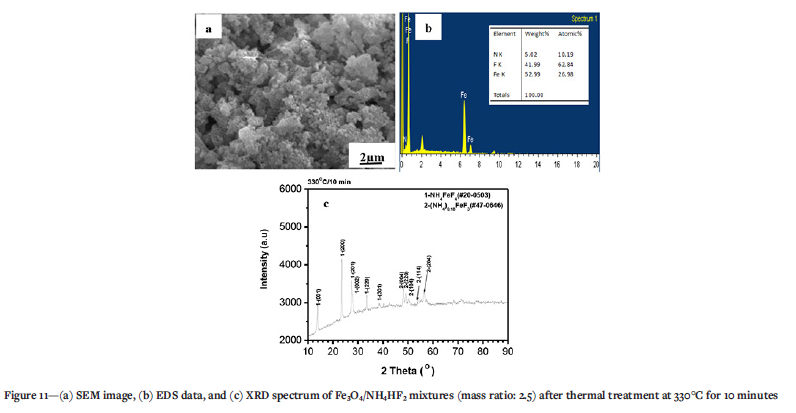
There is no direct evidence for this. However, the XRD results in Figure 5 indicate that the complete fluorination of Fe3O4 is a lengthy process Therefore, the assumption that fluorination of Fe3O4 is incomplete before 327°Cduring TG-DTA analysis is reasonable (Wang et al, 2021). The third reason is the slower release rate of NH4F from NH4FeF4 at 327ºC during TG-DTA analysis. To confirm this assumption, a Fe3O4/NH4HF2 mixture with mass ratio of 2.5 was prepared and heated at 330°C for 10 minutes, then analysed using SEM/EDS and XRD. The results are shown in Figure 11. Clearly, only minor (NH4)0.18FeF3 (#470646) was detected, with major NH4FeF4 (#20-0503). The results indicate that the complete release of NH4F from NH4FeF4 (#200503) takes a long time, even at 327°C.
With a further increase in temperature, (NH4)0.18FeF3 will gradually lose all its NH4F to form FeF3 with minor FeF2 due to the partial reduction of Fe (II) to Fe (III) by ammonia at 400°C (Alexeiko et al., 2008; Bentrup and Men., 1990; Pourroy and Poix, 1989; Laptash and Polyshchuk, 1995; Laptash et al., 2000; Wang et al., 2021), as seen in Figure 8b. After 400ºC the mass loss is negligible, as seen in Figure 4. Therefore, the measured residue at 600°C is closed to the theoretical value after consideration the measurement error and the adsorption of F, N, and NH3 by FeF3 during TG-DTA analysis.
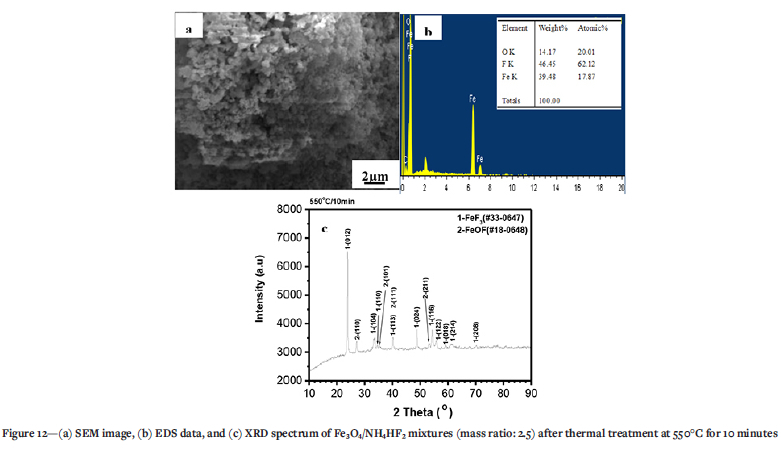
At 550°Cwithout gas protection, Fe oxides (Figure 9) form due to the oxidation of FeF3 (Alexeiko et al., 2008; Juneja et al., 1995; Sophronov et al., 2016). In order to analyse the oxidation progress, a Fe3O4/NH4HF2 mixture with mass ratio of 2.5 was prepared and heated at 550°C for 10 minutes, then analysed using SEM/EDS and XRD. The results are shown in Figure 12. Clearly, the fluorides contain a major component of FeF3 with minor FeOF (#18-0648). FeF2 is either absent or below the detection limit of XRD. Combined with the results in Figure 9, it can be concluded that oxidation proceeds through the follow stages: FeF3 -- FeOF -- Fe2O3. Furthermore, oxidation is faster than reduction under these conditions, which is why no FeF2 is detected (Figure 12), and the fluorides after 1 hour consist of a major proportion of Fe2O3 and only minor FeF2 (Figure 9).
Conclusions
The thermal and microstructural analysis of the fluorination of magnetite (Fe3O4) with NH4HF2 at different mass ratios of NH4HF2 to Fe3O4 (2.5 and 3.5) was carried out by means of TG-DTG-DTA, SEM/EDS, and XRD. The results indicate that the mass ratio of NH4HF2 to Fe3O4 has no influence on the fluorination reaction progress and the corresponding temperature. The fluorination of Fe3O4 starts at room temperature, dominates at 178.4°C, and is completed at 200°C with the formation of (NH4)3FeF6. No NH4FeF4 forms due to the involvement of oxygen. As the temperature increases above 180°Cthe unreacted NH4HF2 decomposes and is removed from the system. Furthermore, (NH4)3FeF6 decomposes sequentially through a three-step reaction by the formation of NH4FeF4 at 259.2-259.9ºC then (NH4)0.18FeF3 at 320°C, and finally FeF3 with minor FeF2 at 400°C. At 550°C in air, FeF3 is oxidized to FeOF/Fe2O3.
Acknowledgment
This research was supported by Scientific Research Fund of Liaoning Provincial Education Department (No. LJKZ1337) and Doctoral Research Startup Foundation of Shenyang Institute of Technology (BS202202).
References
Alexeiko, L.N., Maslennikova, I.G., Goncharuk, V.K., and Merkulov, E.B. 2008, Kinetics of thermal decomposition of fluorinated ilmenite. Pacific Science Review, vol. 10. pp. 325-328. [ Links ]
Andreev, A.A. 2008. Design of fluorination technology for pigment grade titanium dioxide synthesis from ilmenite Abstract, PhD thesis, Tomsk Politechnical University. p. 22. [ Links ]
Bentrup, U. and Menz, D.H. 1990. Zur thermischen Zersetzung vom (NH4)2[FeF5(H2O)] unter quasi-isobaren Bedingungen. Zeitschrift für anorganische und allgemeine Chemie, vol. 591. pp. 230-236. [ Links ]
Carling, R.W. and Westrum, E.F. 1976. Thermodynamics of the monohydrogen difluorides V. Melting thermodynamics of NH4HF2. Journal of Chemical Thermodynamics, vol. 8. pp. 269-276. [ Links ]
Claux, B., Bene, O., Capelli, E., Soucek, P., and Roland, M. 2016. On the fluorination of plutonium dioxide by ammonium hydrogen fluoride. Journal of Fluorine Chemistry, vol. 183. pp. 10-13. [ Links ]
Gordienko, P.S., Yarusova, S.B., Pashnina, E.V., and Zhevtun, I.G. 2017. Hydrofluoride method of complex processing of titanium-containing raw materials. Process Engineering Journal, vol. 1. pp. 31-34. [ Links ]
House, J.E. and Rippon, C.S. A TG study of the decomposition of ammonium fluoride and ammonium bifluoride. Thermochimica Acta, vol. 47. pp. 213-216. [ Links ]
Ignatiev, L.N., Savchenko, N.N., Marchenko, Yu. V., Mashchenko, V. A., and Tkachenko, I.A. 2020. Glasses in the MnNbOF5-BaF2-FeF3 system: Synthesis, structure and crystallization. Ceramics International, vol. 46B. pp. 16210-16216. [ Links ]
Johnson, G.K. 1981. The enthalpy of formation of FeF3 by fluorine bomb calorimetry. Journal of Chemical Thermodynamics, vol. 13. pp. 465-469. [ Links ]-
Juneja, J.M., Singh, S., Adhyapak, S.V., and Rao, U.R. 1995. Preparation of anhydrous FeF3 by solid state reaction of iron oxide with ammonium hydrogen fluoride. India Journal of Engineering and Materials Science, vol. 2. pp. 136-138. [ Links ]
Karelin, V. A., Strashko, A.N., Dubrovin, A.V., and Sazonov, A.V. 2014. Research of fluorination process of rutile concentrate. Procedia Chemistry, vol. 11. pp. 56-62. [ Links ]
Kraidenko, R.I. 2008. Fluorine-ammonium division of multi-component silicate systems to individual oxides PhD thesis [abstract], Tomsk Politechnical University. [ Links ]
Laptash, N.M. and Maslennikova, I.G. 2012. Fluoride processing of titanium-containing minerals. Advances in Materials Physics and Chemistry, vol. 2. pp. 21-24. [ Links ]
Laptash, N.M. and Polyshchuk, S.A. 1995. Thermal decomposition of ammonium fluoroferrates (NH4)xFeF2x (2<x<3). Journal of Thermal Analysis, vol. 44. pp. 877-883. [ Links ]
Laptash, N.M., Nikolenko, Y.M., Kurilenko, L.N., Polyshchuk, S.A., and Kalacheva, T.A. 2000. Fluorination of sulfide minerals with ammonium hydrogen difluoride. Journal of Fluorine Chemistry, vol. 105. pp. 53-58. [ Links ]
Mukherjee, A., Awasthi, A., Mishra, S., and Krishnamurthy, N. 2011. Studies on fluorination of Y2O3 by NH4HF2. Thermochimica Acta, vol. 520. pp. 145-152. [ Links ]
Ouertani, B., Bidouk, G., Ouertani, R., Theys, B., and Ezzaouia, H. 2020. Effect of the ruthenium incorporation on iron oxide phases synthesis, Fe2O3 and Fe3O4-, at low annealing temperature. Materials Chemistry and Physics, vol. 242. 122272. [ Links ]
Pourroy, G. and Poix, P. 1989. New synthesis routes for difluorides MF2 (M=Fe, Mn, Zn and Ni). Journal of Fluorine Chemistry, vol. 42. pp. 257-263. [ Links ]
Resentera, A.C., Rosales, G.D., Esquivel, M.R., and Rodriguez, M.H. 2020. Thermal and structural analysis of the reaction pathways of a-spodumene with NH4HF2. Thermochimica Acta, vol. 689. 178609. [ Links ]
Shimoda, K., Shikano, M., Murakami, M., and Sakaebe, H. 2020. Capacity fading mechanism of conversion-type FeF3 electrode: Investigation by electrochemical operando nuclear magnetic resonance spectroscopy. Journal of Power Sources, vol. 477. pp. 228722. [ Links ]
Shinn, D.B., Crocket, D.S., and Haendler, H.M. 1966. The thermal decomposition of ammonium hexafluoroferrates and ammonium hexafluoroaluminate: A new crystalline form of aluminum fluoride. Inorganic Chemistry, vol. 5. pp. 1927-1933. [ Links ]
Sophronov, V. L., Kalaev, M.E., Makaseev, Yu. N., Sachkov, V., and Verkhoturova, V.V. 2016. Study on the process of Fe (III) oxide fluorination. Materials Science and Engineering, vol. 110. 012069. [ Links ]
Wang, H, Zhou, Y. and B., Mo, C.G., Zhang, L.N., and Cui, J.J. 2021. Fluoridation of a-Fe2O3 by NH4HF2 to produce FeF3. Russian Journal of Inorganic Chemistry, vol. 66. pp. 2017-2026. [ Links ]
Wang, Y.D., Zhang, Y.P., Liang, G., and Zhao, X. 2020. Fabrication and properties of amorphous silica particles by fluorination of zircon using ammonium bifluoride. Journal of Fluorine Chemistry, vol. 232. 109467. [ Links ]
White, A.J.C. and Pistorius, C.W.F.T. 1972. Melting curve and high-pressure polymorphism of NH4HF2. Journal of Solid State Chemistry, vol. 4. pp. 195-198. [ Links ]
Zhou, X.Y., Sun, H.X., Zhou, H.C., Ding, J., Xu, Z.L., Bin, W.J.J., Tang, J.J., and Yang, J. 2018. Enhancing the lithium storage capacity of FeF3 cathode material by introducing CaLiF additive. Journal of Electroanalytical Chemistry, vol. 810. pp. 41-47. [ Links ]
Zhou, X.Y., Sun, H.X., Zhou, H.C., Xu, Z.L., and Yang, J. 2017. Enhancing cycling performance of FeF3 cathode by introducing a lightweight high conductive adsorbable interlayer. Journal of Alloys and Compounds, vol. 723. pp. 317-326. [ Links ]
 Correspondence:
L. Zhang
Email: zhanglina1204@126.com
Received: 23 May 2021
Revised: 1 Sep. 2022
Accepted: 23 Oct. 2022
Published: December 2022

