


Servicios Personalizados
Articulo
 Inglés (pdf)
 Articulo en XML
 Referencias del artículo
Indicadores

Links relacionados
-
 Citado por Google
 -
 Similares en Google
Compartir

 Permalink
Journal of the Southern African Institute of Mining and Metallurgy
versión On-line ISSN 2411-9717
versión impresa ISSN 2225-6253
J. S. Afr. Inst. Min. Metall. vol.122 no.11 Johannesburg nov. 2022
http://dx.doi.org/10.17159/2411-9717/1910/2022
PROFESSIONAL TECHNICAL AND SCIENTIFIC PAPERS
The effect of overburden and confined stress state on cave mining propagation
N.K. Schoeman; S.W. Jacobsz; E.P. Kearsley
Department of Civil Engineering, University of Pretoria, Pretoria, South Africa. ORCID: N.K. Schoeman: http://orcid.org/0000-0003-1544-8476; S.W. Jacobsz: http://orcid.org/0000-0002-7439-2276; E. Kearsley: http://orcid.org/0000-0003-0458-8908; J. Wesseloo: http://orcid.org/0000-0001-7124-2267
SYNOPSIS
A physical modelling approach was adopted to simulate the process of cave mining propagation at various horizontal to vertical stress state ratios, and image data was captured and used to characterize the resulting failure mechanisms. Image processing was integrated into the study to determine minor principal strains in models to identify where critical extensional strains had been exceeded relative to crack propagation. The study exhibited a scale factor magnitude of 119 using a calculated critical extensional strain value of 0.014% for the modelling material used. It was perceived that cave propagation occurred through successive parallel extensional 'fracture bands' in all cases, as noticed in models of prior studies, deviating from that described by the Duplancic model. Cracks tended to bisect regions of minor principal strain equal to the critical extensional strain, which suggests 'fracture banding' is an acceptable failure mode for brittle, rock-like materials. Moreover, it was found that models with lower horizontal to vertical stress ratios (K ratios) showed a greater degree of vertical development of the caving mechanism (at similar vertical stresses), while the vertical extent of the cave was suppressed in models with higher K ratios. Models subjected to larger vertical stresses experienced slower cave formation in latter time-steps. These models exhibited larger two-dimensional caved perimeters and areas, respectively.
Keywords: physical modelling, cave mining propagation, particle image velocimetry, critical extensional strain, model material.
Introduction
Cave mining involves the mass mining of an orebody by means of an undercutting process in the form of drilling and blasting of horizontal in-situ rock sections. This broken rock is removed at underground drawpoints after the undercutting phase. When an undercutting footprint of sufficient extent has been reached, a self-sustaining propagating cave will advance, provided the caved material is removed. Block and panel cave mining are efficient mass mining methods since, after initial establishment of the infrastructure, no drilling and blasting is necessary to mine the ore.
In-situ stress states
The World Stress Map (WSM) provides a database of lithospheric stresses resulting from tectonic plate movement in the upper part (2-5 km), as well as the lower part (5-20 km) of the Earth's crust. Zoback and Zoback (2002) claim that in-situ stresses at depths exceeding 100 m are caused purely by tectonic stress fields. According to Stacey and Wesseloo (1998), the horizontal secondary principal stresses in South Africa's mines are found to take on an approximate NW-SE orientation in most cases, with some NE-SW directions in fewer instances. The general trend found in South Africa's mines is that horizontal stress values are typically equal to or greater than the vertical stress This is commonly the case in mines around the world except for Australia and Canada (Brady and Brown, 2006; Arjang, 2004; Yong and Maloney, 2015; Lee et al., 2010). Stacey and Wesseloo (1998) pointed out that the approach of using a horizontal to vertical stress ratio of 0.5 for mining layout analyses is normally invalid. It is commonly known that the Northern Cape Province is an area of high horizontal stress (Nieuwoudt and Rozendaal, 1990). At shallow depths, it is significant to note that horizontal stresses generally exceed the overburden stresses (Stacey and Wesseloo, 1998). It is hypothesised that the in-situ horizontal to vertical stress ratio (in the earth's crust) would affect the mode of cave propagation, where larger ratios could lead to less steep caving, and even causing cave stalling.
The Duplancic model
The failure mechanism that is most accepted in industry is the Duplancic model (Duplancic, 2001). The principal assumption of this model is that the damage profile of rock material decreases with distance above the cave back and that caving takes place primarily due to slip along pre-existing rock fractures (Duplancic, 2001). The model describes several zones of influence affected by cave mining. There are five sub-zones which categorize the Duplancic model, as shown in Figure 1:
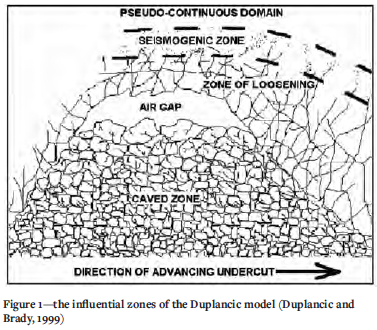
> Caved zone - which comprises a zone of caved material that has collapsed from the cave back capable of providing - to some extent - support to the flanks of the cave back
> The air gap between the cave back and the caved zone
> The zone of loosening, consisting of rock that is in a loosened state which does not provide any support to the overlying rock mass. Also known as the zone of disintegration
> The seismogenic zone, above the zone of loosening. Seismic fracture, as the name suggests, occurs in the part of the rock mass which causes slip along pre-existing discontinuities
> The last zone is referred to as the pseudo-continuous domain. This zone is above the seismogenic zone, where the rock mass damage is limited and deformation is generally assumed to be elastic.
Caving mechanics
Cumming-Potvin et al. (2016a) conducted geotechnical centrifuge modelling of the caving process on physical artificial rock models produced from fly ash and weakly cemented sand into which a network of pre-cut joints was randomly distributed during the curing process. In these model tests, the horizontal confining stresses in cave mines were simulated using water-filled bladders on the sides of samples. The undercutting procedure was induced by withdrawal of five hydraulically-supported pistons. Approximately 50 mm thick artificial rock slabs (samples) were tested under near-plane strain conditions, with confinement in the third dimension provided by a glass panel to allow the models to be photographed using a digital single lens reflex (DSLR) camera. Samples were tested at an acceleration of 80 g.
The results obtained from the physical modelling did not agree with the behaviour of the Duplancic model. Cumming-Potvin et al. (2016) observed an extensional type of failure mechanism whereby the cave advanced upwards in successive parallel fractures (referred to as 'fracture bands') from the cave back. From these results it appeared that the damage profile did not monotonically decrease with distance above the cave back as advocated by the Duplancic model, but followed a discontinuous profile. The failure was characterized as extensional because of the direction of movement and the lack of damage to the edges of the 'fracture bands' as referred to by Cumming-Potvin et al. (2016a). The authors noted that their evidence was not definitive, but indicative that these fractures formed in extension. All samples tested in the physical modelling programme were reported to have failed by the extensional-type failure described previously. The spacings of fractures were consistent within each test, but not from one test to another, indicating that the spacing of the fractures might be a function of material properties and/or stress state. Some of the fractures terminated at the edges of the piston-retractable platforms, creating the impression that fracture banding is a byproduct of the undercutting performed with comparatively wide platforms. It is clear that close to the undercut, the discrete piston width affects the fracture behaviour. This is, however, not the case with cave propagation after the original cave initiation (Cumming-Potvin et al., 2016a). Wesseloo et al. (2020) showed that the fracture generally occurs in the crown of the cave and propagates outwards and downward to terminate at the piston edge.
It was reported that no tests of brittleness had been performed and further research was yet to be conducted to determine the influence of brittleness on physical modelling tests (Cumming-Potvin et al., 2016a). Cumming-Potvin et al. (2016b) recommended that a better model material needed to be developed for follow-up physical model studies investigating cave propagation. In supplementation of Wesseloo et al. (2020), the research described in this paper extends the physical modelling by Cumming-Potvin et al. (2016a, 2016b) and attempts to investigate cave mining propagation mechanisms under different horizontal to vertical stress ratios. The current study also proposes an improvement to the model material that incorporates better rock-like features such as fragmentation, overall brittleness, and stiffness.
Methodology
Materials and properties
The material used to simulate the cave mining process in physical models was developed by trial and error to produce a weak, relatively hard, brittle medium, capable of representing a rock mass that would fracture at the test acceleration of 80 g. Table I indicates the proportioned constituents used in fabricating the model material, with their corresponding relative densities.
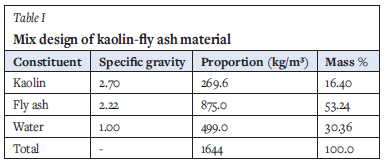
Constituents were blended using a high-shear mixer at a moderate setting (855 r/min). Fly ash and water were mixed first, followed by equal quantities of kaolin in 5-minute time increments. The constituents were mixed for a further 5 minutes and cast into oiled slab moulds (500 mm by 450 mm by 55 mm) and cylinder moulds (100 mm long by 50 mm diameter) before being vibrated for 7 minutes to remove air. Samples were initially cured uncovered at 24°C for 13 days, after which they were strong enough to be handled. Samples were finally oven-dried at 70°C for 48 hours before they were used in centrifuge testing.
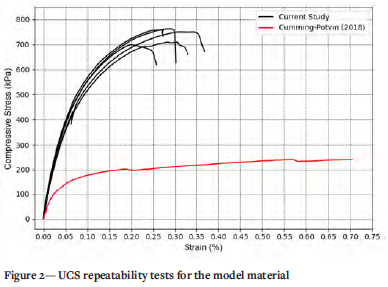
Uniaxial compressive strength (UCS) tests were conducted on cylindrical samples to gain an indication of the stiffness, brittleness, and unconfined compression strength of the model material. Figure 2 exhibits the response in the UCS tests of the model material, also showing the truncated UCS curve of 48-hour cured material as used by Cumming-Potvin (2018). In the current study, the average UCS value was recorded as 735 kPa, with the material failing at an axial strain of 0.25-0.35 %, the latter correlating well with rock and other brittle materials such as concrete.
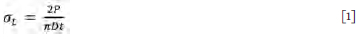
Triaxial testing was carried out at confining pressures ranging from 100 to 700 kPa on specimens to establish an average Young's modulus and Poisson's ratio. Triaxial results were then used to determine the Mohr-Coulomb strength parameters of the material. Numerous Brazilian indirect tensile disc tests (BDTs) were performed on the material with curved loading arcs to alleviate premature failure at the points of load application (Gaspar and Jacobsz, 2020). A tensile strength of around 86 kPa was calculated using the relationship from ASTM 2008 (and ISRM 1981) for the splitting tensile strength (at):
where:
σt = Tensile strength (Pa)
P = Compressive load at failure (N)
D = Diameter of disc specimen (m)
t = Thickness of disc specimen (m)
The average tensile stress was determined from the tensile splitting tests. Images taken at 5-second intervals during BDTs were corrected for lens distortion using the GIMP GNU image manipulation programme (Kimball and Mattis, 2019). Images were processed via PIV (particle image velocimetry) analysis through GeoPIV-RG software (Stanier et al., 2016) to determine the tensile sample strains during testing. The input for the PIV analysis involved generating a mesh to populate the subsets over the reference image with a patch size of 50 pixels. Images used in the analysis had adequate texture to allow for particle tracking. The diameter of the disc specimens was typically 1250 pixels (image-based distance).
The Young's modulus of the model material was determined as 778 MPa (on average), and the average unit weight was 1 453 kg/m3, based on laboratory-tested specimens. The shear modulus was calculated as 365 MPa and the Poisson's ratio was estimated as 0.22 from the triaxial tests conducted at a cell pressure of 100 kPa. The Poisson's ratio of the model material correlates well with the range exhibited by most rocks (Vutukuri, Lama, and Saluja., 1974; Hatheway and Kiersch, 1986; Gercek, 2007). The porosity of specimens and panels used in centrifuge testing was calculated as 37.3% on average, which correlates well with sedimentary rocks. According to Sheorey (1997), the compressive to tensile strength ratio of rock covers a range of 2.7 to 39, depending on the rock type. The average ratio of compressive to tensile strength for the model material in the current study was approximately 8.54. The average values for the cohesion and friction angle for specimens were calculated as 240 kPa and 16.5° respectively at peak principal stresses. At residual principal stresses, values of 112 kPa and 21.8° were reported for the cohesion and friction angle respectively. This revealed that the cohesive strength was mobilized first, followed by the onset of the frictional component, which requires higher degrees of strain to mobilize (Schmertmann and Osterburg, 1960).
Critical extensional strain
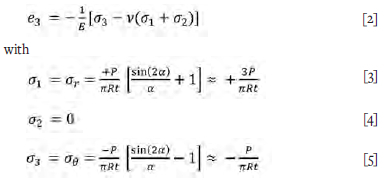
According to Li and Wong (2013), tensile cracks may initiate at strains equal to the critical extensional strain even before the required stress has reached the material's tensile strength. It is also worth noting that these cracks caused by extensional strains can be generated in environments where all three principal stresses are compressive (Stacey, 1981). Following the procedure of obtaining the tensile strength and horizontal strains from load and image data respectively, a lower and upper bound were defined to assess the critical extensional strain for the model material. The stress at the elastic limit on the tensile extreme was divided by the Young's modulus, which yielded a lower bound strain absolute value of 0.011%. The calculation of the upper bound necessitated the modification of Equation [2], with the substitution of Equation [1] at the centre of the disc sample as per Li and Wong (2013) - shown by Equations [3], [4] and [5], where σ2 is considered negligible. In this way, the added component of Poisson's ratio is used to determine a more refined value for critical extensional strain. Thus, utilizing the resulting Equation [6] to calculate extensional strains using the circumferential stresses in Brazilian disc specimens, anticipates an over-estimation of the value for critical extensional strain. In the following equations, which are valid in plane-strain environments, compression is taken as positive.
where
e3 = Extensional strain / minor principal strain
E = Elastic modulus of the material (kPa)
v = Poisson's ratio
σ1= σr, Major principal stress or radial stress (kPa)
σ2 = Intermediate principal stress (kPa)
σ3 = σ0, Minor principal stress or circumferential stress (kPa)
R = Disc radius of the specimen (m)
2a = Angular distance over which P is assumed to distributed radially (usually <150).
The origin of Equations [3] and [5] is from the assumptions of Griffith criterion where the exact centre of the disc is the only crack initiation point at which the conditions for tensile failure at a value equal to the uniaxial strength are met.
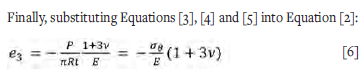
Making use of Equation [6] and the load data from the BDT tests, the extensional strain (e3) experienced normal to the cracks forming during Brazilian disc testing can be plotted against the vertical displacement applied to the sample. The extensional strain curves for six tests, which were found to have split through their centres (in tension failure), are shown in Figure 3.
From Figure 3, an average value of 0.018% for the upper bound of tensile strain was evaluated. Note that values were taken from the peaks of the curves, which correspond to the tensile strength of the material. If the average value of 0.018% was regarded as a candidate value for critical extensional strain, it would be an over-estimation as tensile cracks might have initiated where the tensile strain equals the critical extensional strain for the particular material (Li and Wong, 2013). According to Li and Wong (2013), this extensional strain value, when translated to a stress, is lower than the tensile strength of the material in most cases. This shows that strains could potentially govern failure in brittle materials.
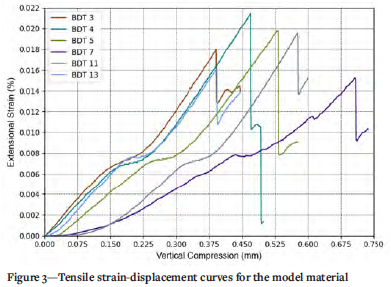
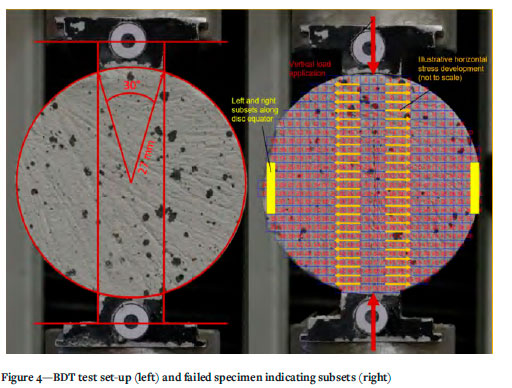
Considering the lower and upper bound values, strains were also determined from the horizontal displacements (i.e. 'bulging') of BDT specimens using PIV analysis. The horizontal displacements that were exported from the PIV data were for the left and right subsets near either end of the 'disk equator' as illustrated by the yellow columns in Figure 4. Other subsets tracked during the PIV analysis are indicated by outlined blue squares. Upon determining the horizontal tensile strains from the displacements tracked along the sides of each specimen, the absolute extensional strain was plotted for each progressive image taken during the indirect tensile tests. Values of strains recorded outside the limits, as defined by the lower and upper bounds, were discarded to select a representative estimate of the critical extensional strain for the chosen material. The representative critical extensional strain value was approximated by 0.014%, checked against the previously defined bound values.
Centrifuge model and test procedure
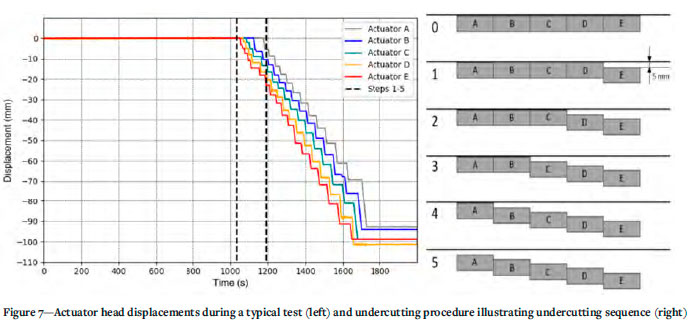
Due to settlement and shrinkage during the curing process, sample dimensions decreased by 25 mm in width, 20 mm in height, and 8 mm in thickness, resulting in final sample dimensions of approximately 475 mm in width, 430 mm in height and 47 mm in thickness. The physical modelling of the cave mining process was performed at an acceleration of 80 g using the geotechnical centrifuge at the University of Pretoria (Jacobsz, Kearsley, and Kock., 2014). Five 50 mm wide retractable platforms, positioned next to each other, supported the centre 250 mm of each sample panel of model material, with the sides of the panel resting on rigid supports. The centrifuge model is illustrated schematically in Figure 5. Figure 6 displays photographs of the test frame itself, as well as the sample residing within the test frame before and after the window is fastened for centrifuge testing. The retractable platforms (or trapdoors) were controlled using linear electric actuators, each driven by a 24 V DC motor and gearbox and enabled the undercutting associated with the cave mining process to be simulated. Undercutting of the model orebody was done in a sequence illustrated in Figure 7. The linear actuators were controlled using a high-current motor driver with a variable-duty cycle which was operated using a closed-loop control system developed specifically for centrifuge applications, termed Fly-by-Pi (Broekman et al., 2020).
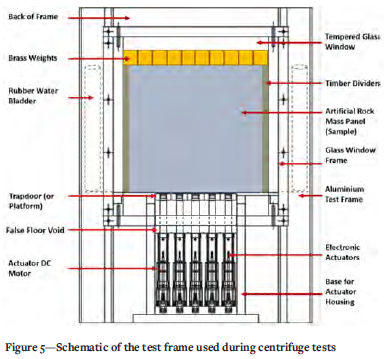
Various components, required for simulating external loads representing different cave mining conditions underground, were integrated within the test frame. These included water-filled bladders adjacent to the caving material that were pressure-regulated by a test-specific static head in a standpipe. Adjustable brass weights were placed on top of the caving material to provide overburden pressures for each specific test. Both components allowed for a certain combination of horizontal and vertical stresses to be applied to enable a number of different stress states to be achieved.
The front of the test frame comprised a 30 mm thick tempered glass panel to retain the slab of caving material and to allow photography. A 10 mm thick glass panel provided low-friction confinement at the back of the caving material and was kept in position by an aluminium panel at the back of the test frame. It was intended to maintain the caving material in near plane-strain conditions. The back panel of the test frame was also stiffened by aluminium ribs for increased bending stiffness. Movable timber dividers were placed between the sample and the water bladders to ensure consistent and uniform pressure was exerted on the sample during testing. Silicone and rubber strips were used to cushion sections of the frame that possibly could make contact with the glass components during the tests, to prevent the glass panes from cracking. With the exception of first centrifuge test, where lateral confinement of the sample was achieved using sand, water-filled bladders were placed into the side pockets of the frame. These were linked to a standpipe, fastened to the frame, which was used to control the water pressure in the bladders. After preparation, a panel of model material was abraded to the correct tolerances in order to eliminate any lack of fit in the frame. The panel was then carefully placed in the frame where the actuator heads were positioned below the sample, out of contact. The actuator heads (platforms) were then carefully extended to their maximum limit to ensure that the panel rested firmly on all the platforms. Once the panel had been centred over the five actuator platforms (leaving equal spaces on the sides of the panel), the timber dividers were positioned on the sides of the sample. The panel was marked with black spray paint spots to provide texture in the photos captured for PIV analysis. Care was taken to bolt the 30 mm thick front glass panel in place to avoid the sample cracking due to local stress concentrations. Brass weights were added to the top surface of the sample to achieve the desired overburden stress. The centrifuge model was positioned on the centrifuge swing. The centrifuge lights were switched on, actuators connected, cameras configured, and the data acquisition system initialized. The water bladders were 'bled' to purge the system of any air. Image capturing using the Canon DSLR camera and a high-speed Basler camera was started before the actuators were withdrawn to simulate caving. The undercutting commenced as shown in Figure 7 (right) to initiate cave propagation once an acceleration of 80 g was reached. This was continued until all the actuators were fully withdrawn.
Scaling relationships
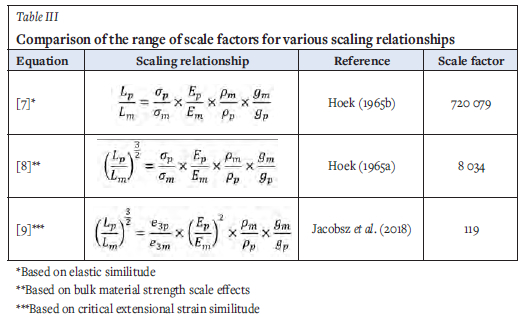
For the physical modelling in this investigation to be representative of the conditions applicable in the field it was necessary to satisfy the requirements of similitude. Buckingham (1914) postulated that the similitude of systems is based on dimensional analysis used extensively in the Buckingham n theorem. This theorem utilizes independent parameters that characterize a system and uses them to determine equations that must be satisfied for achieving similitude between the scale model and the prototype. According to Jacobsz et al. (2018), using the same material for both the prototype and modelling material to simulate deep mining problems is not feasible due to the limitations of most centrifuges. Utilizing the model material described in the current study, ranges of scale factors were calculated using typical rock values (prototype) and the corresponding values for the model material, applying the modified equation from the relevant reference. The values for these parameters are given in Table II compared to quartzite, while the scale factors achieved for the relevant equation used are shown in Table III. Note that subscripts m and p refer to the model and prototype respectively, where a denotes stress, L is the characteristic length dimension, p is the relative density of the material, E is the Young's modulus, and e3 denotes critical extensional strain.
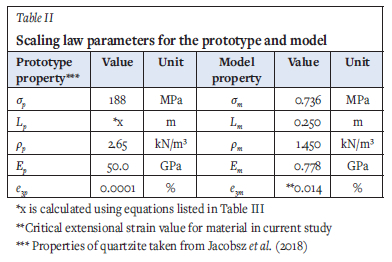
It should be noted for clarity that the model material, and hence the physical models, were not specifically representative of a certain type of rock (or of a certain block cave mine); however, the material and models of this study were aimed at satisfying the scaling laws for a range of rock types and therefore catering for cave mining in multiple rock types. Typically, σm is taken at the base of models since the model material would first fail in this position when undercut. Scaling laws were derived from the basis of Jacobsz et al. (2018).
Results and discussion
Centrifuge tests
Four cave mining simulations were conducted in the geotechnical centrifuge under different applied stress states. Test 1, with in-situ horizontal to vertical stress ratio of 0.50 (K = 0.50), had negligible horizontal confinement, using sand with zero overburden pressure. This was deemed to represent cave mining cases where low horizontal stresses and minimal overburden stresses exist.
Test 2 (K = 0.94) had a minimal horizontal confinement applied to the sample with zero overburden pressure. It should be noted that, although the in-situ stress ratio at the base of the sample was recorded at 0.94, it did vary to 1.40 at two-thirds the height from the sample base. This test was aimed at representing conditions where there are large horizontal stresses in areas that are not deep underground. This test of the current study compares the closest to those of Cumming-Potvin (2018).
Test 3 (K = 0.69) had a minimal overburden pressure applied to the sample, with the same horizontal confinement as test 2.
Finally, test 4 (K = 0.69) had a maximum overburden pressure applied to the top of the sample, with the highest horizontal confinement given by the water bladders. Theoretical stresses experienced, particularly at the bottom of the sample, exceeded the material's UCS value.
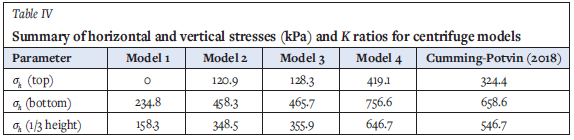
Table IV shows the models of the current study compared to that of Cumming-Potvin (2018), where σk and σv refer to the horizontal and vertical stress, respectively.
Figures 8 and 9 display the calculated caved perimeter and caved area over the cave progression steps, respectively. Figure 10 plots the measured cavity height against the cave width over cave progression steps (i.e. time intervals when each of the platforms were initially withdrawn).
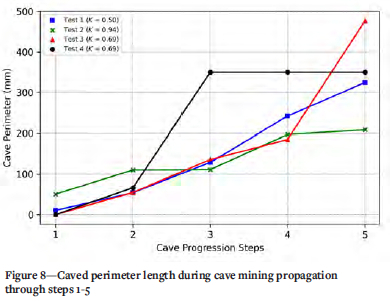
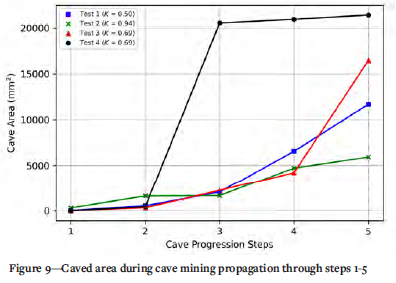
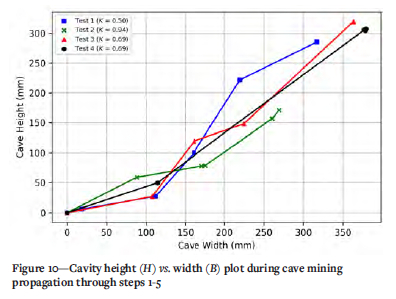
From the trends observed in the plots of the geometric parameters against the cave progression steps 1 to 5, it was concluded that tests of higher K ratios resulted in gradients that were initially steep and tended to flatten off when the cave back advanced. Tests of smaller K ratios resulted in slopes that were initially flat, possibly due to the lack of horizontal confinement; however, trends steepened upon the cave back reaching a certain height. When the cave back reached this particular height, the horizontal stress arched across, above the cave back, increasing the horizontal stress in the model. This behaviour is exhibited across tests 1, 2, and 3 with a K ratio of 0.50, 0.94, and 0.69, respectively. The same trend is identified when plotting the ratios of cavity height to width at different cave progression steps against the K ratios of tests.
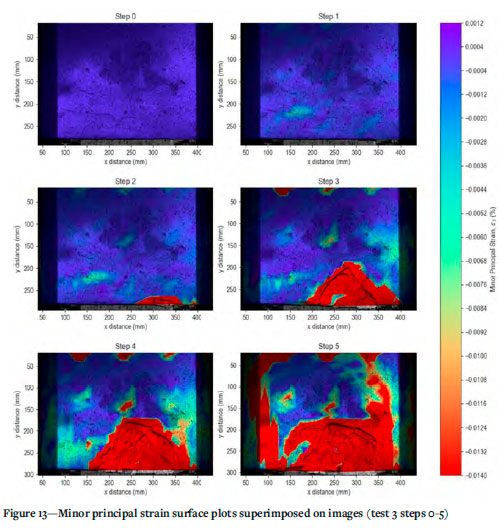
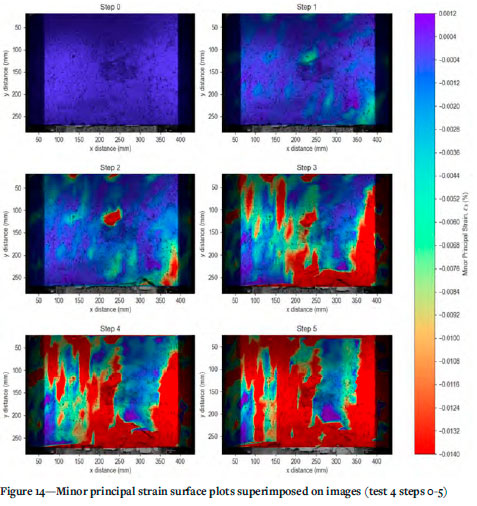
Minor principal strain and crack propagation mapping In this section, strain surface plots are superimposed on images that show crack propagation for the relevant time steps 1 to 5. Minor principal strains were presented in an attempt to capture magnitudes of tensile strain in models.
The critical extensional strain model from Stacey (1981) is applied to the events of cave progression in models and used to map cave mining propagation. Surface plots, superimposed on images showing crack development, are helpful in discerning whether strains coincide with or are bisected by cracks - which is notable in most cases. Referring to Figures 11, 12, and 13, it is interesting to take note of the fact that the minor principal strains follow the direction of crack propagation. Where the cracks formed in an advancing cave back around material which has not yet failed (for example tests 1 and 2), the strains are mapped out such that the zones of non-critical strains are surrounded by zones of critical strains. When crack propagation has occurred around an area of caved (failed) material, critical strains show up above the failed material, indicating the cave back relative to the region of caved material (this is evident from test 3). Strain mapping also indicated zones where shearing started to take place (in the cases of test 3 and test 4). Overviews of minor principal strains are shown in all time steps of tests in Figures 11 through to Figure 14.
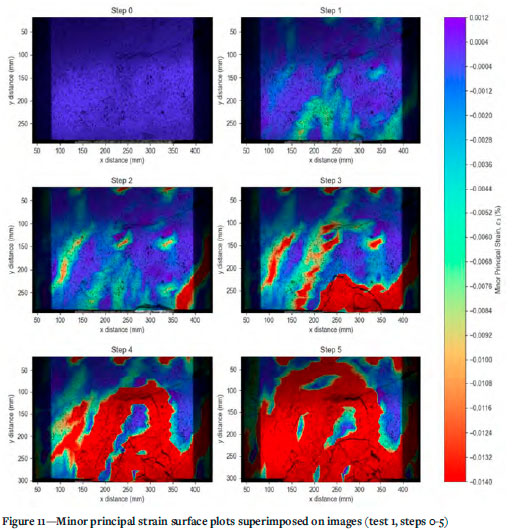

From what was observed in test 1 (K = 0.5), the critical extensional strains were mapped around the perimeter of the cave back, clearly defining the area of cracks where the absolute critical value was exceeded, as shown in Figure 11. From step 2 onwards, strains are observed to exceed the critical value at the point where crack propagation takes places - providing evidence that the chosen strain criterion is valuable for detecting cracks within the model, thereby highlighting the tensile failure of the model material.
In test 2 (K = 0.94) (Figure 12), cracks propagated as tensile strains reached the critical value and, on closer inspection, seemed to have reached pre-existing fractures within the model. Strains were once again mapped around clearly defined fractures with red zones rendered where cracks had formed.
In steps 2 and 3, the outermost critical strains were seen to overlap with the cave back in certain positions. In step 4 the red zone of critically exceeded strain followed the cave back around an area which had not yet formed part of the cave back. This could suggest that the minor principal strains tended to follow the advancing cave back around since unfractured material is rendered non-critical.
Test 3 (K = 0.96) revealed strains exceeding their critical values from the start of crack propagation in large zones which were bisected by these fractures. Figure 13 shows no gaps of non-critical strain contours that were observed, which was different from tests 1 and 2. Transition lines formed to allow for subsidence in step 5 where strains outside of these lines were also clearly detected as critical.
In test 4 (K = 0.96), shown in Figure 14, fractures propagated to pre-existing ones when critical values were reached very early (in step 2) due to crushed material at the bottom of the sample caused by excessive overburden stresses.
Subsidence appears to start on the bottom right-hand side of the sample and rapidly formed in step 3 of the caving progression test. The superposition of minor principal strain contours on identified cracks using image analysis allowed for the identification of tensile failure within the experimental models. In all tests, the observations seem to correspond well with the mode of cave mining failure identified by Cumming-Potvin (2018).
The notion of 'parallel fracturing' seems to be notable in the four cases of centrifuge test results; and the identified tensile strains exceeding the critical extensional strain value for artificial material used seemed adequate in estimating when and where crack propagation would occur.
Both extreme cases of tests 1 and 2 with K ratios 0.50 and 0.94, respectively, demonstrated a failure mechanism of parallel fracturing as a cave propagation concept. Both tests 3 and 4, despite having a K ratio within the extremes, also demonstrated parallel fracturing (extensional failure) at steps before and after the event of subsidence.
Generally, experimental models were proposed to have failed in a stress caving mechanism with the mobilization of extensional failure within the sample. Despite some scatter in the results, as can be expected in brittle fracture processes of this nature, evidence of extensional fracturing is visible when superimposing images (from which fractures can be identified) with surface plots where zones of tensile strains are present. Utilizing the simple model of critical extensional strain (Stacey, 1981), it was possible to identify areas from where cracks originated, as well as the point from which propagation took place. The critical extensional strain value chosen and used in minor principal strain surface plots was estimated using a lower and upper bound approach. The propagation of the tensile strains could be tracked conveniently from the source, and it could be ascertained that strained zones coincided with cracks which propagated upwards toward the top of the model, ultimately resulting in the occurrence of surface subsidence.
In all test cases, cracks propagated from the points where the material exceeded the absolute critical strain value of 0.014%. This occurred in either new fractures formed via cave back progression or from pre-existing fractures. In most cases, the regions of extensional strain were observed to have been bisected by visual fractures in samples, and the results indicate that extensional strains were exceeded upon formation of the cracks. This suggests that the cave material failure was extensional. The mapping of minor principal strains in the models also demonstrated, in some cases, that the outermost tensile strain contours approximately coincided with the advancing cave back. Lastly, subsidence through 'chimney' formation was detected and identified through the critical strain contours.
Conclusions
The results of centrifuge tests allowing the observation of cave propagation in models subjected to four different stress states have been presented. This work is a continuation of research by Cumming-Potvin et al. (2016a, 2016b), with more brittle material being developed and utilized which allowed for modelling actual rock behaviour more realistically. In UCS testing, the model material failed in a strain range of 0.25% to 0.35%, which compares well to that of concrete, rock, and other brittle materials. The Poisson's ratio, compression to tensile strength ratio, and fracturing characteristics are similar to most rocks. For this reason, the material can be seen to exhibit sufficient brittleness to be suitable for centrifugal cave mining progression tests.
All tested caving models, having been initially exposed to different stress states, were noted to have failed in a manner conforming to the extensional-type failure mechanism proposed by Cumming-Potvin (2018a). Although there was some uncertainty before about the fracturing mode in the centrifuge tests due to the relatively ductile nature of the material tested by Cumming-Potvin et al. (2016a, 2016b), this study also shows that the mechanism of cave propagation is indeed extensional fracturing.
The application of an improved scaling law utilizing critical extensional strain similitude resulted in a scale factor of the order of 1:119 compared to typical properties of quartzite. This scale factor offers an improvement on that determined from the elastic law of similitude by Hoek (1965) which gave a scale factor of 1:720 079, as well as to that based on bulk material strength scale effects, which gave a scale factor of 1:8 034.
Acknowledgements
The authors gratefully acknowledge the financial and technical support of Newcrest Mining Limited which made this work possible.
Author contributions
Mr N.K. Schoeman carried out the investigation with the practical assistance of Professor S.W. Jacobsz, under the supervision of Professor E.P. Kearsley and co-supervision of Professor S.W. Jacobsz. The manuscript was written by Mr. N.K. Schoeman and proof-read by Professor E.P. Kearsley, Professor S.W. Jacobsz and Professor J. Wesseloo.
References
Arjang, B. 2004. Database on Canadian in situ ground stresses. Division Report MMSL 01-029, March 2001 (revised 2004). CANMET Mining and Mineral Sciences Laboratories, Sudbury. [ Links ]
ASTM. 2008. Standard test method for splitting tensile strength of intact rock core specimens. D 3967-08. ASTM International, West Conshohocken, PA. [ Links ]
BiENiAWSKi, Z.T. 1974. Estimating the strength of rock materials. Journal of the Southern African Institute of Mining and Metallurgy, March 1974. pp. 312-320. [ Links ]
Brady, B.H.G. and Brown, E.T. 2006. Rock Mechanics for Underground Mining. 3rd Edn (reprint): Kluwer Academic Publishers, Netherlands. [ Links ]
Broekman, A., Jacobsz, S.W., Louw, H., Kearsley, E.P., Gaspar, T.A.V., and dA Silva Burke, T.S. 2020. Fly-by-Pi: Open source closed-loop control for geotechnical centrifuge testing applications. HardwareX, vol. 8. e00151. [ Links ]
Buckingham, E. 1914. On physically similar systems; illustrations of the use of dimensional equations. Physical Review, vol. 4.4. p. 345. [ Links ]
Cumming-Potvin, D. 2018. An extended conceptual model of caving mechanics. PhD thesis. University of Western Australia, Perth. [ Links ]
Cumming-Potvin, D., Wesseloo, J., Jacobsz, S.W., and Kearsley, E.P. 2016a. Fracture banding in caving mines, vol. 116, no. 8. pp. 753-761. [ Links ]
Cumming-Potvin, D., Wesseloo, J., Jacobsz, S.W. and Kearsley, E.P. 2016b. Results from physical models of block caving. Proceedings of the 7th International Conference & Exhibition on Mass Mining (MassMin 2016), 9-11 May 2016, Sydney, New South Wales, Australia. Australasian Institute of Mining and Metallurgy, Perth. pp. 329-340. [ Links ]
Duplancic, P. and Brady, B. 1999. Characterisation of caving mechanisms by analysis of seismicity and rock stress. Proceedings of the 9th ISRM Congress. International Society for Rock Mechanics and Rock Engineering. Lisbon. [ Links ]
Duplancic, P. 2001. Characterisation of caving mechanisms through analysis of stress and seismicity. PhD thesis, University of Western Australia, Perth. [ Links ]
Gaspar, T.A.V. and Jacobsz, S.W. 2020. Brazilian tensile strength test conducted on ductile unsaturated soil samples. Geotechnical Testing Journal, vol. 44, no. 3. pp. 799-810. https://doi.org/10.1520/GTJ20190078 [ Links ]
Gercek, H. 2007. Poisson's ratio values for rocks. International Journal of Rock Mechanics and Mining Sciences, vol. 44, no. 1. pp. 1-13. [ Links ]
Hatheway, A.W. and Kiersch, G.A. 1986. Engineering properties of rocks. Handbook of Physical Properties of Rocks and Minerals. Vol. 2. Carmichael R.S. (ed.). CRC Press. pp. 289-331. [ Links ]
Hoek, E. 1965a. Rock fracture under static stress conditions. PhD thesis, University of Cape Town. 237 pp. [ Links ]
Hoek, E. 1965b. The design of a centrifuge for the simulation of gravitational force fields in mine models. Journal of the South African Institute of Mining and Metallurgy, vol. 65, no. 9. pp. 455-487. [ Links ]
ISRM: 1981. Rock Characterization, Testing and Monitoring - ISRM Suggested Methods. Pergamon, Oxford. [ Links ]
Jacobsz, S.W., Kearsley, E.P., and Kock, J.H.L. 2014. The geotechnical centrifuge facility at the University of Pretoria. Proceedings of the 8th International Conference on Physical Modelling in Geotechnics, Perth. CRC Press. pp. 169-174. [ Links ]
Jacobsz, S.W., Kearsley, E.P., Cumming-Potvin, D., and Wesseloo, J. 2018. Modelling cave mining in the geotechnical centrifuge. Physical Modelling in Geotechnics, vol. 2. CRC Press. pp. 809-814. [ Links ]
Lee, M.F., Mollison, L., Campbell, A., and Litterbach, J. 2010. Rock stresses in the Australian continental tectonic plate. Proceedings of the nth IAEG Congress. CRC Press, Boca Raton, FL. [ Links ]
Li, D. and Wong, L. 2013. The Brazilian disc test for rock mechanics applications: Review and new insights. Rock Mechanics and Rock Engineering, vol. 46, no. 2. pp. 269-287. [ Links ]
Nieuwoudt, A.P.C. and Rozendaal, A. 1990. In situ stress determinations in mines located in two major structural domains in South Africa. Proceedings of the ISRM International Symposium. International Society for Rock Mechanics and Rock Engineering, Lisbon. Paper no. ISRM-15-1990-023. [ Links ]
Schmertmann, J. and Osterberg, J. 1960. An experimental study of the development of cohesion and friction with axial strain in saturated cohesive soils. Proceedings of the Research Conference on Shear Strength of Cohesive Soils. ASCE. pp. 643-694. [ Links ]
Sheorey, P.R. 1997. Empirical Rock Failure Criteria. A.A. Balkema, Rotterdam, The Netherlands. [ Links ]
Stacey, T.R. 1981. A simple extension strain criterion for fracture of brittle rock. International Journal of Rock Mechanics and Mining Sciences & Geomechanics Abstracts, vol. 18, no. 6. pp. 469-474. [ Links ]
Stacey, T.R. and Wesseloo, J. 1998. In situ stresses in mining areas in South Africa. Journal of the South African Institute of Mining and Metallurgy, vol. 98, no. 7. pp.365-368. [ Links ]
Stanier, S.A., Blaber, J., Take, W.A., and White, D.J. 2016. Improved image-based deformation measurement for geotechnical applications. Canadian Geotechnical Journal, vol. 53, no. 5. pp. 727-739. [ Links ]
Tang, G.X. and Graham, J. 2000. A method for testing tensile strength in unsaturated soils. pp. 377-382. doi: 10.1520/GTJ11059J. Geotechnical Testing Journal, vol. 23, no.3. [ Links ]
Vutukuri, V.S., Lama, R.D., and Saluja, S.S. 1974. Handbook on Mechanical Properties of Rocks, Volume 1. Trans Tech Publications, Clausthal. 280 pp. [ Links ]
Wesseloo, J., Cumming-Potvin, D., Potvin, Y., Jacobsz, S.W., and Kearsley, E.P. 2020. Physical modelling to provide data-rich case studies for verification and validation of numerical modelling of cave mechanics problems. Proceedings of the 8th International Conference & Exhibition on Mass Mining (MassMin 2020). Santiago, Chile. 4-7 October 2020. pp. 462-477. [ Links ]
Yong, S. and Maloney, S. 2015. An update to the Canadian Shield stress database. NWMO-TR-2015-18. Nuclear Waste Management Organization, Toronto. [ Links ]
Zoback, M.L. and Zoback, M.D. 2002. State of stress in the Earth's lithosphere. International Handbook of Earthquake and Engineering Seismology, vol. 81A. Elsevier. pp. 559-568. [ Links ]
 Correspondence:
N.K. Schoeman
Email: u14074428@tuks.co.za
Received: 20 Nov. 2021
Revised: 28 Jul. 2022
Accepted: 1 Aug. 2022
Published: November 2022

