


Servicios Personalizados
Articulo
 Inglés (pdf)
 Articulo en XML
 Referencias del artículo
Indicadores

Links relacionados
-
 Citado por Google
 -
 Similares en Google
Compartir

 Permalink
Journal of the Southern African Institute of Mining and Metallurgy
versión On-line ISSN 2411-9717
versión impresa ISSN 2225-6253
J. S. Afr. Inst. Min. Metall. vol.122 no.10 Johannesburg oct. 2022
http://dx.doi.org/10.17159/2411-9717/1075/2022
PROFESSIONAL TECHNICAL AND SCIENTIFIC PAPERS
Application of MR and ANN in the prediction of the shovel cycle time, thereby improving the performance of the shovel-dumper operation - A case study
S. DeyI; S.K. MandalI; C. BharII
ICSIR-Central Institute of Mining & Fuel Research, Dhanbad, India
IIIndian Institute of Technology (I.S.M), Dhanbad, India
SYNOPSIS
Loading and hauling of ore and waste are the key operations of an opencast coal mine and entail a high operational cost. The productivity of a mine can be increased by reducing the cycle time of loading equipment as well as utilizing dumpers optimally. In this paper we discuss the impact of rock type, bucket fill factor, rock fragmentation, the height of the cut, and angle of swing of the bucket on shovel performance. A time study is conducted on shovels in an opencast coal mine with experimental blasts of rocks to assess the impact of different factors on the performance of the shovel. Based on the data, the authors applied multiple regression (MR) and artificial neural network (ANN) techniques to develop different models for the prediction of the shovel cycle time. Developed models are validated by comparing the predicted data with actual field data. With the help of the best model, the plausible fleet size is determined in order to utilize the shovel and dumper optimally and to improve the performance of shovel-dumper operation.
Keywords: shovel, dumper operation, cycle time, MR, ANN, match factor.
Introduction
India is the second-largest coal producer in the world, with around 7.9% of global coal production in 2018 (BP Statistical Review of World Energy, 2019). To meet the country's coal demand, most of the coal-producing companies have shifted from underground mining to opencast methods. In the present mining scenario, more than 94% of coal production in India is met by opencast coal mines. (Ministry of Coal, 2019). Proper planning, as well as utilization of the machines used in opencast mines, is of paramount importance for effective and economical coal production.
Rock fragmentation vis-a-vis loading and transportation of the blasted muck are the key modules of production in opencast coal mines and constitute about 50-60% of the total operating cost (Alarie and Gamache, 2002; Doktan, 2002; Hartman, 2002). In the Indian opencast mines, dumpers in conjunction with a shovel are generally used for material handling. The utilization of shovel and dumper needs to be optimized to reduce material handling costs and increase the commercial viability of the mines. Chaowasakoo, et al. (2017) simulated the most effective real-time truck dispatching strategy for assigning a combination of truck-shovel operations in order to maximize productivity considering the three uncertain parameters, i.e. truck cycle time, the loading time of the matched dumper and shovel, and idle times of trucks and shovels at PT. KitadinTandungMayang's East Kalimantan production site, Indonesia. Pasch and Uludag (2018) conducted a similar study to optimize the loading-hauling fleet to improve the production of the opencast colliery. The literature reveals that, the match factor (MF) is one of the most important indicators to evaluate the utilization of any shovel - dumper operation (Krzyzanowska, 2017). The MF is defined as the ratio of truck arrival rate to loader service rate, and it is one of the most important indicators to measure the effective utilisation of loading and hauling equipment. The match factor can be determined from Equations - [1] and [2] (Hanby, 1991; Kesimal, 1998).
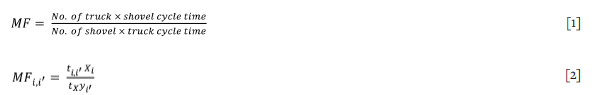
where, MFi,t is the match factor of 'f type truck and 'i"type loader; Xi is the number of 'i' type trucks; yi is the number of 'i" type loaders; ti,e is the time taken to load 'f type truck with 'i' type loader; and tx is the average cycle time of the trucks, excluding waiting times.
Burt (2008) derived Equation [3] for heterogeneous types of loading and hauling equipment,

where, tx is the average cycle time of all types of trucks; Xi is the number of i type of trucks; Xe is f type of loader; ty is the time taken to serve the truck type i by loader type i'; and t, h is the cycle time of truck type i on haul route h.
This study emphasizes shovel operation only in the opencast coal mines, where the cycle time of dumper operation is known. The productivity and efficiency of a shovel are affected by several variable factors like muckpile characteristics, loading geometry, practice, operating conditions, and loader design (Singh, 2006). Independent factors like size and type of loading equipment, the experience of the operator, site characteristics, operating conditions of the machine, and rock properties also affect the performance of the shovel (Ceylanogl, Karpuz, and Pasamehmetoglu, 1994). Various researchers have established a correlation between rock fragmentation characteristics and the productivity of loading equipment vis-a-vis actual production of a mine (Allen, Hawkes, and Noy, 1999; Doktan, 2002; Michaud, Lizatte, and Scoble, 1997; Singh and Narendrula, 2001). Researchers have also indicated that production can be enhanced by 3% of reducing the cycle time of loading equipmentby 20% (Hawkes 1998). Kirmanli and Ercelebi (2009), developed an expert system to select the excavator and dumper combination to minimize production cost, whereas a genetic algorithm was used by Marzouk and Moselhi, (2002) to optimize the loader-haul fleet for a particular type of loader and dumper.
Literature reveals that the cycle time of a shovel is affected by different factors. The study of factors affecting the shovel operation and prediction of the cycle time of shovel helps to optimize the utilization of shovel-dumper fleet. Therefore, an effort has been made to study dumper operation to predict the total cycle time of the shovel by applying multiple linear regression (MR) and the artificial neural network (ANN) techniques separately. The major objective is to minimize the total cycle time of the shovel and optimize the shovel-dumper operation to enhance productivity. The developed model was validated by comparing the predicted cycle time from the models output data with actual field values, and encouraging results have been observed.
Factors affecting shovel performance
Production of a shovel is expressed in bank cubic metres per unit time and is always less than the equipment's rated capacity. The production cycle of the shovel consists of four basic components; fill the bucket, swing with the load, dump the load, and return swing for the next load. Bucket fill factor, bench height, swing angle, and rock fragmentation sizes are the major factors affecting the shovel's actual production.
Bucket fill factor
The bucket fill factor is defined as the ratio of the actual volume of material excavated to the nominal volumetric capacity of the shovel bucket; it varies with the rock type. It is predominantly an operational variable and depends upon the loading strategy, operator experience, and willingness to fill the bucket and the angle of repose of the material on top of the bucket (Bozorgebrahimi, Hall, and Blackwell, 2003). An improper fragmentation results in large boulders, which reduce the bucket fill factor and increase the cycle time of the shovel as well as the waiting time of the dumper.
Bench height
Bench height, which influences the muck profile and cycle time of the shovel and dumper, is as the vertical distance between crest and toe of the bench (Ercelbi and Basceetin, 2009). For a high bucket capacity shovel (> 2.5 m3), a shallow bench height may incur more passes to fill a dumper and may also involve increased the traversing time along the blasted muck. A higher bench height compared to the maximum digging height of the excavator may reduce the depth of penetration in the blasted muck or more strokes may be required to fill the bucket for one pass. It may result in incomplete removal of blasted muck from the crest of the bench and improper fragmentation in the subsequent blast. Therefore, an optimum bench height with regards to the maximum digging height of the excavator may optimize the cycle time of the excavator.
Angle of swing of bucket
The angle of the swing of the shovel bucket, i.e., the angle in the horizontal plane between the loading and unloading points of the shovel, directly influences the cycle time of the shovel. Therefore a minimum swing angle can minimize shovel cycle time and waiting time of dumpers during intermittent periods.
Effect of rock fragmentation on shovel operation
Improper fragmentation results in more void spaces in the bucket and an increase in the cycle time of the shovel to fill a dumper. It also increases the time required to handle individual oversize boulders during mucking and increases the total loading time. Neilson (1987) correlated different pass sizes of boulders (50%, 80%, and 90%) with the bucket fill factor of loading equipment. Doktan (2001) indicated that a better-fragmented blast results in a 35% reduction in shovel digging time and a 22% increase in productivity. The author has derived Equation [4] to determine digging time.

where; a = 8.9942, b = 6.8706e-2, X50 = 50% passing size, and Un = Uniformity coefficient
With the help of time study data, Molotilov, Cheskidov, and Norri (2008) derived Equation [5] to calculate bucket fill time and indicated that the bucket size (capacity) should be increased to minimize the effect of fragment size on digging time.
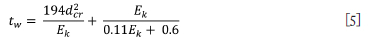
where, tw is the shovel bucket filling time, dcr is fragment size, and Ek is the geometric capacity of a shovel bucket
Methodology and data analysis
The study on loading and hauling operations was conducted at Jharia Coalfield, Dhanabd, India. The study was conducted on one 10 m3 and one 5 m3 capacity shovel, which are employed to load overburden on 60 t and 85 t dumpers. The study was conducted in four phases. In the first phase, a time study was done on shovel-dumper operation. In the second phase, the factors that affect the shovel's performance were identified. In the third phase, different models were developed for predicting shovel cycle time by applying MR and ANN techniques separately, and the models were validated with actual field data. In the fourth and final phase, the best prediction model was applied the the shovel and dumpers that are allocated for material handling operations.
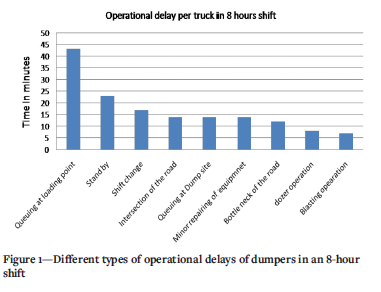
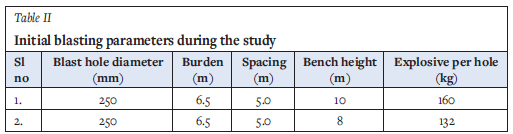
During the first phase of the study, it was observed that the waiting time of the dumper behind shovels is the highest operational delay in a shift hour (Figure 1). Initial data, presented in Table I, shows that the value of the MF is greater than 1.00, which indicates that the utilization of shovels and dumpers is not optimum, and hence the loading-hauling performance is poor. Further, It was also observed that the quality of rock fragmentation was very poor, affecting the shovel cycle time. The initial blasting parameters of the mines are given in Table II.

A few experimental blasts were conducted to improve rock fragmentation. Afterwards, a time study of each shovel was done against the loading of rocks of different fragmentation sizes at different heights of cut with varying angles of swing to obtain the cycle time under different conditions. The total loading time of a dumper is calculated from Equation [6].

where Ti is complete loading time, tc is shovel cycle time, n is the number of passes to load the dumper, and a is the time allowance for spotting the shovel to the digging location during one complete loading cycle.
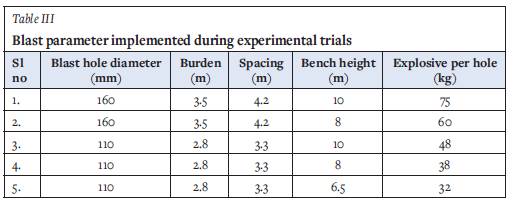
In the above equation 'n' depends on the bucket capacity of the shovel, the capacity of the dumper, the fill factor, and swelling factor of the muck. Operational delays due to face cleaning, minor breakdowns of shovels, and dozer operations are not considered in the study. The experimental blasting parameters are tabulated in Table III.
WIPFRAG software was used to determine the rock fragmentation size with the help of a Cannon HD camera. Rock fragmentation was determined by four passing sizes, K100 or 100%, K80 or 80%, K50 or 50%, and K20 or 20% passing sizes. In this study, the average cycle time of shovels is considered for accessing the effect of different factors on shovel performance. MINITAB 17 software was used for statistical analysis of data.
Analysis of time study data
The coefficient of correlation between the average cycle time of theshovel (tc) and different factors; the rock fragmentation size (K20, K50, K80, and K100 passing sizes), the uniformity Index of rock fragmentation (Un), the angle of swing (As) of the shovel bucket, and the ratio of the height of the cut (or face height) to the maximum digging height of the shovel (Hr) are tabulated in Table IV. The scatter plots of shovel cycle time and different fragmentation sizes are shown in Figure 2.
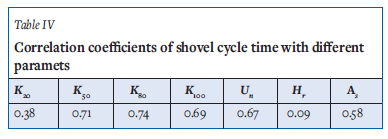
It is observed from Table IV that the cycle time of the shovel is mainly affected by the quality of rock fragmentation and the swing angle of the shovel. K50, K80, and K100 passing sizes of rock fragmentation and swing angle have a good correlation with the cycle time of the shovel. The uniformity index is not correlated with the cycle time of the shovel. The height of the cut rarely affects the cycle time. However, only three heights of cut were considered in the study. The height of the cut is considered here as the ratio of the height of the cut to boom height.
Application of multiple regression for prediction of shovel cycle time
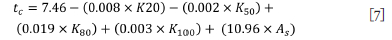
Based on the available data and correlations between different parameters and average cycle time of the shovel multiple linear regression models were developed, with an assumption that there exists a linear relationship between average cycle time and different factors like fragmentation size and swing angle. Three models were developed using regression analysis, presented in Equations [7], [8], and [9]. All the fragmentation sizes; K20, K30, K80, and K100, and swing angles are considered for developing Model 1. Similarly, fragmentation sizes K80, K100, and swing angle considered in Model 2, and fragmentation sizes; K50, K100, and swing angle for developing Model 3.
Model 1:
Model 2:

Model 3:

where tc is the cycle time of shovel, K20, K50, K80, and K100 are the fragmentation sizes of materials, and As is the swing angle
Interpretation regarding regression models of the cycle time of shovel
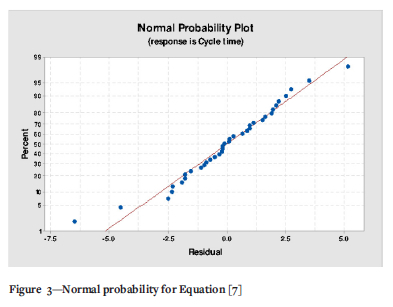
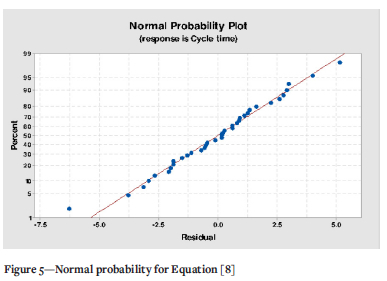
Table V shows the statistical summary of regression analysis conducted using the three developed models presented in Equations [7], [8], and [9]. The following interpretations are made from the data.
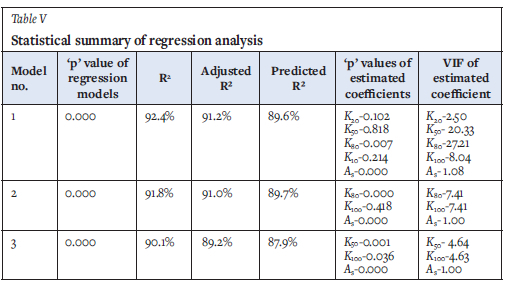
(a) The p-value for all the regression models in Table V (0.000) shows that the model estimated by the regression procedure is significant at 0.05.
(b) The higher values of R2 and adjusted R2 indicate that all the three models fit the data well.
(c) For all the three models the predicted R2 value is close to the R2 and adjusted R2 values. Therefore the models do not appear to be over it and have adequate predictive ability.
(d) The normal probability plots (Figures 3, 5, and 7) of all three models show an approximately linear pattern consistent with a normal distribution.
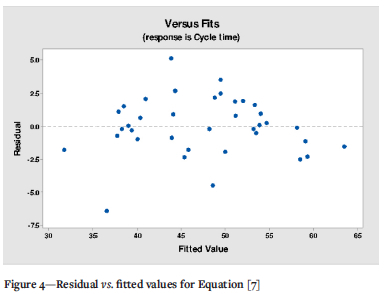
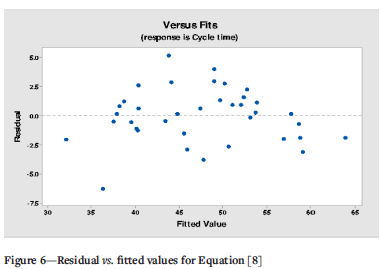
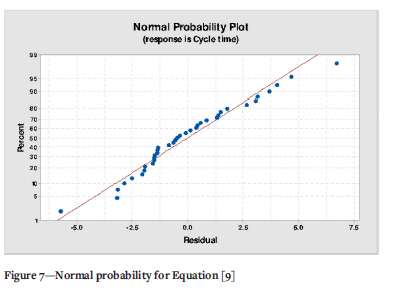
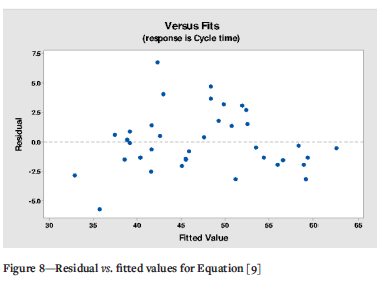
(e) Plots of residuals versus the fitted values (Figures 4, 6, and 8), show that most of the residuals are scattered around the reference line in the same manner.
(f) The p-values for all the estimated coefficients of Equation [9] are less than 0.05, and hence they are related to 'cycle time' significantly at an a-level of 0.05, but the estimated coefficient of K80 and As are only significantly related to 'cycle time' at an a-level of 0.05 for Equations [7] and [8].
(g) VIF of predictor 'As' for all the equations is near to unity, which indicates that it is not correlated to any predictor variable in any equation. For Models 1 and 2 (Equations [7] and [8]), the VIF value of predictors other than 'As' is greater than 5 and indicates that severe multi-colinearity may exist among the predictors. For Model 3 (Equation [9]), the VIF value of predictors is less than 5, indicating that the predictor may be moderately correlated.
The above analysis reveals that Equation [9] (Model 3) is the most suitable for the prediction of the shovel cycle time. During the study, it was observed that in a few cases, the maximum size of fragmentation or K100 enhances the digging time and swing time (with load), and hence the shovel cycle time is increased to a maximum extent. K100 is therefore kept as a variable in all the equations. The mean particle size of fragmentation or K50 can be predicted by Equation [10], developed by V.M. Kuznetsov (Cunningham, 2005). Table V shows the statistical analysis of regression. It is revealed from the analysis that Equation [9] (Model 3) is the most suitable for the prediction of the shovel cycle time. Therefore Equation [9] can be more helpful in predicting the cycle time in the field with the help of this equation.

where, Xm = mean particle size (cm); Fr = rock factor (varying between 0.8 and 22, depending on hardness and structure), E = powder factor, which is expressed in kilograms of explosive per-cubic metre of rock; Qb = mass of explosive charged in the blast-hole kg; RWS = relative weight strength of explosive. ( ANFO =100, TNT = 115).
Prediction of shovel cycle time through ANN
In ANN, the analysis system learns from the sequence of input and output data-sets and gathers the knowledge by detecting the patterns and relationships in data through experience. The effectiveness of ANN depends on the proper analysis of technical parameters, input data, and operating conditions (Schabowicz and Hola, 2007).
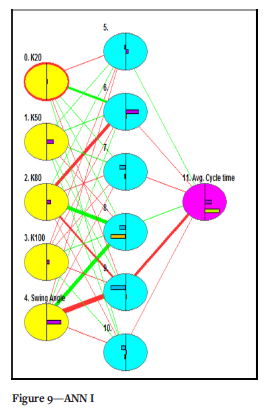
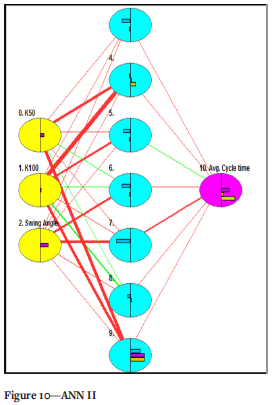
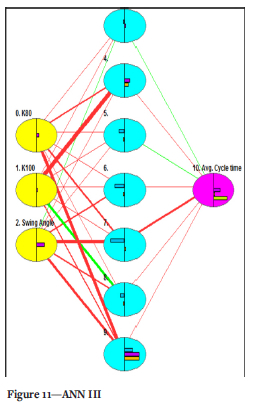
Here, three types of networks have been structured for the prediction of average cycle time; the three structures are shown in Figures 9, 10, and 11. Easy NN-Plus software was used for the ANN models. For training of the ANN models, three types of data structures were used for the three networks, Table VI shows the data structures. A total of 37 sets of data were used for each of the three networks. Table VII shows the details and number of layers considered for the three types of structure used for learning or training ANN models.
Validation of prediction models for shovel cycle time
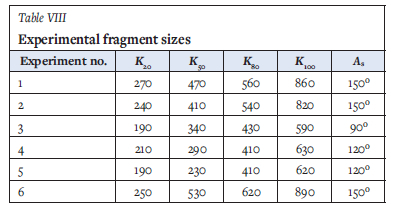
A few experimental blasts were conducted considering different rock fragmentation sizes and angular positions of the shovel relative to the dumper position. The average cycle time of the shovel was predicted by applying all three models developed by MR and the three models developed by ANN. The details of fragmentation sizes and angle of swing (As) are shown in Table VIII. Prediction models were validated after conducting actual studies on shovel cycle time with different fragmentation sizes Table VIII, and the actual and predicted values of cycle time compared. The statistical analysis of actual and predicted data is presented in Table IX. The scatter plot of the actual average cycle time vs predicted/estimated cycle time is shown in Figure 12.
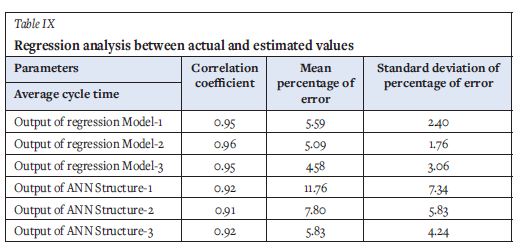
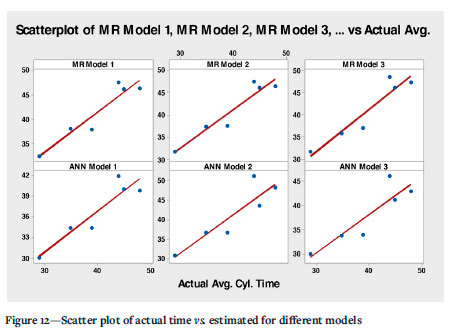
The above analysis reveals that the coefficient of correlation between actual and predicted values for all three models developed by applying the MR technique is higher than for the models developed using ANN. Among the six models developed by applying both MR and ANN techniques, Model 3 (Equation [9]) of MR shows the best result in terms of mean percentage of error, which is based on three factors; K50, K100, and As. Therefore, Equation 9 is applied further to predict the shovel cycle time and determine the dumper fleet size accordingly so that the performance of shovel-dumper operations can be improved.
Determination of dumper fleet size by applying the Model 3 developed by the application of MR technique
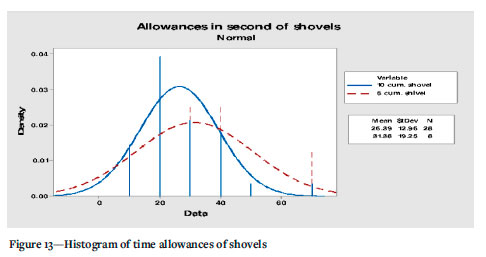
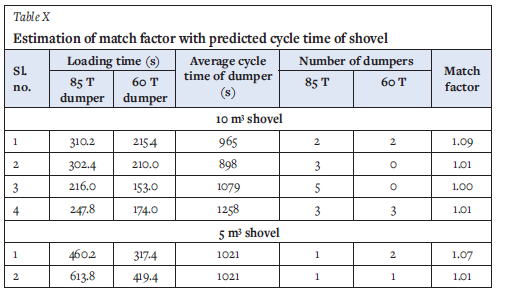
From the above study, it is revealed that the MR Model 3 (Equation [9]) is the most efficient in terms of prediction of shovel cycle time. This model is therefore used for determination of the dumper fleet size and improvement of shovel-dumper productivity. Time allowances for positioning of shovel are to be considered during the calculation of the total loading time of the dumper. The study found that the mean time allowance is different for 10 m3 and 5 m3 shovels. Figure 13 shows the histogram of time allowances is different for 10 m3 and 5 m3 shovels. The mean time allowances for the 10 m3 and 5 m3 shovels are 26.39 seconds and 31.28 seconds, respectively. The histogram shows that the variation in data for 5 m3 shovels is more than that for 10m3 shovels. Six studies were conducted with the calculated total loading time of the dumper with the help of predicted shovel cycle time by multiple regression Model 3 (Equation [9]) and mean time allowances of shovels. Accordingly, the number of each type of dumper to be utilized with each shovel is determined, keeping the value of tMF near 1.00. Instead of a homogeneous fleet (single type of dumper), a heterogeneous fleet comprising two types of dumper is proposed. Table X shows the proposed dumper fleet sizes for the six studies.
Results and discussions
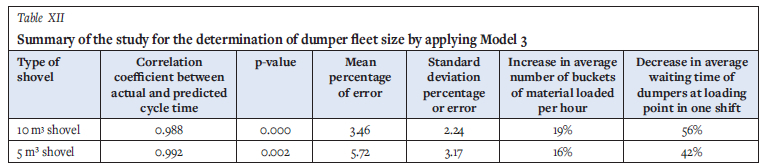
After conducting the study based on experimental blasts and determining the dumper fleet size against each of the shovels by predicting dumper loading time, the performance of the shovel was studied and is tabulated in Table XI. The study is summarized in Table XII, and the scatter plot of predicted vs actual cycle time of shovels is shown in Figure 14. It was found (Tables XI and XII) that the average production of the 10 m3 shovel, in terms of the average number of buckets of material loaded to dumper per hour, is increased by 19% (from 67 to 79.75), and that of the 5 m3 shovel is increased by 16% from 72 to 83.5. The average waiting time of dumpers at the loading point of 10 m3 shovels is decreased by 56% (from 43 minutes or 2580 seconds to 1135.25 seconds), and similarly, for 5 m3 shovels, it is reduced by 42% (from 43 minutes or 2580 seconds to 1496.5 second) in a shift of 8 hours. Therefore the experiments show a significant improvement in loading-hauling or shovel-dumper fleet performance.
Conclusion
The studies demonstrated a strong relationship between blast fragmentation and average shovel cycle time. Fragmentation sizes of K50, K80, and K100 have a good correlation with shovel cycle time. Shovel cycle time is also correlated with the swing angle of the bucket. It is essential to use an appropriate blast design according to the rock properties for a good fragmentation of the rock mass. It is also important to place either the shovel or the dumper in such a manner that the swing angle of the bucket will be minimized during loading of the dumper. Estimation of the cycle time of the shovel helps to determine the appropriate dumper fleet size for each of the shovels in order to utilize the shovel and dumper optimally and obtain better loading-hauling performance. Multiple regression (MR) and artificial neural network (ANN) techniques are the most useful tools to predict or estimate the shovel cycle time, and either of these methods can be applied after conducting a time study of loading and hauling equipment. The study reveals that the estimation of shovel cycle time with a appropriate blast design improves the productivity of a 10 m3 shovel by 19% and that of a 5 m3 shovel by 16%, whereas the operational delay of shovel-dumper operation is decreased by 56% in the case of the 10 m3 shovel and by 42% for the 5 m3 shovel.
References
Alarie, S. and Gamache, M. 2002. Overview of solution strategies used in truck dispatching system for open pit mines. International Journal of Surface Mining Reclamation and Environment, vol. 16, no. 1. pp. 59-76. [ Links ]
Allen, F., Hawkes, P., and Noy, M. Bucket fill factors - A laboratory and field study with implications for blasting. Proceedings of EXPLO '99. The Australasian Institute of Mining and Metallurgy, Melbourne. pp. 43-46 [ Links ]
Bozorgebrahimi, E., Hall, R.A., and Blackwell, G.H. 2003. Sizing equipment for open pit mining - a review of critical parameters. Transactions of the Institution of Mining and Metallurgy Section A: Mining Technology. vol. 112, no. 3. pp. 171-179. [ Links ]
Burt, C.N. 2008. An optimization approach to material handling in surface mines. PhD thesis, Department of Mathematics & Statistics, Curtin University of Technology. [ Links ]
BP. 2019. Statistical Review of World Energy, 68th edn. London. [ Links ]
Ceylanogl, A., Karpuz, C., and Pasamehmetoglu, A.G. Specific digging energy as a measure of diggability. Proceedings of the Mine Planning and Equipment Selection '94. pp. 489-494. [ Links ]
Chaowasakoo, P., Seppala, H., Koivo, H., and Zhou, Q. Digitalization of mine operations: Scenarios to benefit in real-time truck dispatching. International Journal of Mining Science and Technology, vol. 27. pp. 229-236 [ Links ]
Cunningham, C.V.B. 2005. The Kuz-Ram fragmentation model - 20 years on. Brighton Conference Proceedings. Holmberg, R. et al. (ed.), European Federation of Explosives Engineers, pp. 201-210. [ Links ]
Doktan, M. 2001. Impact of blast fragmentation on truck shovel fleet performance. Proceedings of the 17th International Mining Congress and Exhibition of Turkey-IMCET 2001. Chamber of Mining Engineers of Turkey, Ankara. pp. 376-379. [ Links ]
Doktan, M. A preliminary study of the impact of blast fragmentation on load and haul productivity at Porgera. JKMRC, Brisbane. [ Links ]
Ercelbi, S.G. and Basceetin, A. 2009. Optimisation of shovel-truck system for opencast mining, Journal of The Southern African Institute of Mining and Metallurgy, vol. 109, no. 7. pp. 433-439. [ Links ]
Fourie, G.A. and Dohm, G.C., 1992. Open pit planning and design. Mining Engineering Handbook, 2nd edn. Society for Mining Metallurgy & Exploration, Englewood, Co. pp. 1274-1290. [ Links ]
Hanby, I.R. 1991. Enhancement of dump truck operating efficiency. Transaction of the Institution of Mining and Metallurgy Section A: Mining Technology, vol. 100. pp. 42-47. [ Links ]
Hartman, H.L. 2002. Introductory Mining Engineering, Wiley India. [ Links ]
Hawkes, P. 1998. Using simulation to assess the impact of improvements in drill and blast on down stream processes. Proceedings of Mine to Mill 1998. Australasian Institute of Mining and Metallurgy, Melbourne. pp. 209-217. [ Links ]
Kesimal, A. 1998. Shovel-truck productivity and efficiency studies for overburden removal in an open-pit mine. Transactions of the Institution of Mining and Metallurgy, Section A: Mining Industry, vol. 107. pp. 37-40. [ Links ]
Kirmanli, C. and Ercelebi, S.G. 2009. An expert system for hydraulic excavator and dumper selection in surface mining. Journal of the Southern African Institute of Mining and Metallurgy, vol. 109. no. 12. pp. 727-738. [ Links ]
Krzyzanowska, J. 2007. The impact of mixed fleet hauling on mining operations at Venetia mine. Journal of the Southern African Institute of Mining and Metallurgy, vol. 107. pp. 215-224. [ Links ]
Marzouk, M. and Moselhi, O. 2002 Bid preparation for earthmoving operations. Canadian Journal of Civil Engineering. vol. 29. pp. 517-532. [ Links ]
Michaud, P.R., Lizotte, Y.C., and Scoble, M.J., 1997. Rock fragmentation and mining productivity: Characterisation and case studies. Proceedings of the 23rd Annual Conference on Explosives and Blasting Technique. International Society of Explosive Engineers, Austin, TX. pp 275-279. [ Links ]
Molotilov, S.G., Cheskidov V.I, and Norri, V.K. 2008. Mineral mining technology methodical principles for planning the mining and loading equipment capacity for opencast mining with the use of dumpers, Journal of Mining Science. vol. 44, no. 4. pp. 376-385. [ Links ]
Neilson K. 1987. Model studies of loading capacity as a function of fragmentation from blasting, Proceedings of the 3rd Mini-Symposium on Explosives and Blasting Research. pp.71-80. [ Links ]
Paterson, L.B. and Ózdogan, M. 2001. Performance of the bigger, faster and smarter new generation electric mining shovels. Proceedings of the 17th International Mining Congress and Exhibition of Turkey- 1MCET 2001. Chamber of Mining Engineers of Turkey, Ankara. pp. 237-242. [ Links ]
Pasch, O. and Uludag, S. 2018. Optimization of the load-and-haul operation at an opencast colliery. Journal of the Southern African Institute of Mining and Metallurgy. vol. 118, no. 5. pp. 449-456. [ Links ]
Ministry of Coal. 2019. Provisional coal Statistics 2018-19. Government of India, Coal Controller's Organization. [ Links ]
Schabowicz, K. and Hola,B., 2007. Mathematical-neural model for assessing productivity of earthmoving machinery. Journal of Civil Engineering and Management. vol. XIII, no. 1. pp. 47-54. [ Links ]
Singh, S.P. and Narendrula, R. 2006. Factors affecting the productivity of loaders in surface mines. International Journal of Mining, Reclamation and Environment. vol. 20, no. 1. pp. 20-32. [ Links ]
Singh, S., Glogger, M., and Willock, D. 2001. Effect of fragmentation on loader efficiency. Proceedings of the 27th Annual Conference on Explosives and Blasting Technique. International Society of Explosives Engineers, Warrensville Heights, OH. pp 77-87. [ Links ]
 Correspondence:
S. Dey
Email: surajitcmri@gmail.com
Received: 21 Dec. 2019
Revised: 2 Apr. 2021
Accepted: 26 Jul. 2022
Published: October 2022

