


Services on Demand
Article
 English (pdf)
 Article in xml format
 Article references
Indicators

Related links
-
 Cited by Google
 -
 Similars in Google
Share

 Permalink
Journal of the Southern African Institute of Mining and Metallurgy
On-line version ISSN 2411-9717
Print version ISSN 2225-6253
J. S. Afr. Inst. Min. Metall. vol.122 n.10 Johannesburg Oct. 2022
http://dx.doi.org/10.17159/2411-9717/2045/2022
PROFESSIONAL TECHNICAL AND SCIENTIFIC PAPERS
A discrete event simulation approach for mine development planning at Codelco's New Mine Level
I. SotoI; A. AnaniII; E. CordovaI
IDepartment of Mining Engineering, Pontificia Universidad Catolica de Chile, Santiago, Chile. E. Córdova: https://orcid.org/0000-0002-9187-4461
IIDepartment of Mining and Geological Engineering, University of Arizona, Tucson, USA. https://orcid.org/0000-0001-9125-6877
SYNOPSIS
The new caving megaprojects that are planned to go into production in the next decade have scheduled horizontal developments at very high rates, which are difficult to achieve. Research has been conducted that seeks to model the construction times for underground developments to determine the feasibility of achieving the planned rates. However, these previous attempts do not consider all the operational aspects that make up the mine development cycle. Here, we present a discrete event simulation (DES) model that individualizes each unit operation of the development cycle to determine the construction rates that new projects will be able to attain. The developed model was applied to the New Mine Level (NML) of the El Teniente Division (DET). The results indicate that it would be impractical to achieve the advance rates scheduled in the original plans if the unit operations of the mine continue to be executed using the status quo. The metres developed after six years in the sections analysed can be significantly improved by changing the maintenance strategy for the equipment (457 metres increase), orepass availability (194 metres increase), and the initial planning sequence (1 598 metres increase). It is recommended that the mine implements a flexible maintenance strategy, defines a strategy to ensure and increase orepass availability to contractors, and makes use of current simulation tools for a more robust development sequence planning.
Keywords: mine development, mine planning, caving, OR in natural resources, discrete event simulation.
Introduction
The depletion of near-surface deposits has pushed the mining industry to transition to the extraction of deeper orebodies by underground mining methods. An essential part of underground mine planning is underground development to access the orebody, which is complex and capital intensive. The geotechnical uncertainties and capital investment requirements result in long development periods, delaying production ramp-up and minimizing the operational flexibility. The rate at which horizontal excavations are developed is an important factor for mine development, since it controls the accessibility of the deposit and the meeting of production goals. However, compared to surface mining, little technological advancement has been made to incorporate the uncertainties surrounding underground development and exploitation in mine planning (Musingwini, 2016).
Additionally, the new caving megaprojects or 'supercaves' that will soon commence production are very ambitious in terms of their production goals. These goals relate directly to the kilometres of tunnels that must be developed to achieve them. This is the case for the New Mine Level (NML) of Codelco's El Teniente Division, a mine located 120 km south of Santiago, Chile, which is used as a case study in this paper. The mine must excavate more than 113 km of tunnels to extend the mine life for at least 50 more years (Diaz, Rojas, and Vargas., 2019). Therefore, important aspects of the production planning exercise should focus more on development planning than on production itself, since production is a result of the development rate (Rocher, Rubio, and Morales., 2011). In this paper, we present a disaggregated approach, using discrete event simulation that takes into account equipment and orepass availability and micro-activities in the drill and blast sequence that affect mine development goals. Based on current practices, we evaluate the feasibility of achieving the planned future development rate at the NML. The research also accounts for the impact of outsourcing mine development to contractors and their access to resources such as ore-passes on long-term development plans. Finally, a feasible medium- to long-term plan is developed using Datamine's Studio UG with EPS tools, and recommendation made to facilitate achieving the development goals.
Applications of DES in underground mines
As stated, technological advancement in underground mining still lags that in surface mining, including the application of discrete event simulation (DES). Many parameters in a mining operation, such as commodity prices, are characterized by high uncertainty (Singer and Kouda, 1999; Dehghani, and Ataee-pour, 2012; Haque, Topel, and Lilford, 2014). Simulation has been used in short-term mine planning to better manage the risks of uncertainty (Paravarzar, Pourrahimian, and Askari-Nasab 2021). DES is a method that models systems through a sequence of well-defined events, which has proven to be a very useful tool in decision support for the mining industry (Basu and Baafi, 1999; Vagenas,1999; Ahmed, Scoble, and Dunbar, 2014; Greberg et al., 2016; Dindarloo, Osanloo, and Frimpong, 2015) for both existing and future mines. Skawina et al., (2014) compared the use of mechanical excavation and drilling and blasting for underground tunnel development using DES. Similar to our study, their research proves that tunnel development using multiple development faces simultaneously increases performance significantly. The focus of their work, however, involved the comparison of tunnel excavation methods and lacked important factors of mine development planning such as resource availability. Manríquez, Pérez, and Morales (2020) developed a combined mixed-integer linear programming model and DES model to generate optimal short-term production schedules for a bench and fill mine. They conclude that a better mine plan is obtained by accounting for uncertainty using simulation. Musingwini (2016) explored the application of optimization algorithms in underground mine planning. He noted the difficulty in the use of exact methods to solve complex underground planning problems optimally. To overcome challenges in optimizing underground mine planning, he recommends the integration of stochastic optimization in development layout, as demonstrated in this research.
The most common application of DES in underground mines is the selection of equipment to maximize productivity (Runciman, Vagenas, and Baiden, 1999; Salama, Greberg, and Schunnesson, 2014; Park, Choi, and Park, 2016). Salama, Greberg, and Schunnesson, (2014) evaluated the impact of the combinations of trucks and LHDs and equipment sizes on mine productivity using DES. Park, Choi, and Park, (2016) used DES to optimize the number of trucks dispatched to three loading points in a truck-loader haulage system that maximizes productivity. Greberg et al., (2016) used DES to compare the use of orepasses and trucks for the transport of ore in deep underground mines. Their results indicated that trucks could be economically viable at levels where the costs of managing an orepass become too high. Anani and Awuah-Offei (2017) also used DES to match shuttle-car haulage equipment to the continuous miner (CM) in different sections of a coal panel based on the CM cycle time. They determined that in sections of the coal panel, fewer shuttle cars can be used to extract the coal to achieve the same level of productivity. Anani et al., (2019) applied DES to optimize the extraction parameters in a bord and pillar coal mine. They maximized productivity by optimizing the cut-out distance, fleet size, and panel dimensions of the production system.
Skawina et al., (2018) used DES to evaluate the effects of orepass loss due to failure on loading, hauling, and dumping operations and productivity. The authors also determined the minimum number of orepasses needed to maintain production rates. Similar to our study, they conclude that orepass availability has a significant impact on the production rate. Although their work does not focus on mine development, the impact of orepass availability on production rate is relevant. Salama et al., (2017) used DES combined with mixed-integer programming to evaluate the net present value (NPV) of an underground operation based on the copper price and increased costs as the mining rate increases. The authors conclude that at greater depth, it is beneficial to increase the mining rate during times of high copper prices, even with an increase in operational cost.
Few works can be found that apply simulation to horizontal tunnel development in small-scale underground mines (Leiva, 2015; Navarro 2012). They do not consider key factors such as the ability to work on multiple faces with a work crew and critical cycle operations such as roof support in the drifts. Previous research does not evaluate the impact of changes in critical operations management on the key performance indicators in mine development. Therefore, we develop a DES model that allows the identification and understanding of the critical operations in the horizontal development cycle in large underground mines. We consider all the unit operations of the cycle and the possibility of working multiple faces with a work crew. We also compare the impact of the original equipment manufacturer (OEM) and a flexible load-haul-dump (LHD) equipment maintenance strategy on the development rate. Lastly, we investigate the effect of orepass availability on the development rate and propose a new development plan that the mine can realistically achieve.
In the following sections, the proposed simulation model is detailed and subsequently applied to a case study of mining sections in El Teniente's New Mine Level (NML). The results obtained from the simulation are validated with historical data from sections currently in operation at DET, and critical unit operations of the development cycle are identified. Experimental analysis is performed that incorporates changes in the management of critical unit operations and the results compared to existing and planned development rates. Finally, the conclusions and recommendations for future work are presented.
Case study
The case study pertains to the El Teniente Division (DET), an orebody exploiyed by a set of different underground projects through caving methods producing around 160 kt/d and a small open-pit operation (20 kt/d) on the surface. The orebody caves naturally after undercutting its base, and the caved material is recovered using drawpoints (Laubscher, 1994). El Teniente mine has been operating since 1904 and produces both copper anodes and copper cathodes. The mine is positioned as the most productive division of Codelco, reaching a production of 459 744 of fine copper in 2018 (Codelco, 2020). This production also positions it as the third most productive mine in Chile, surpassed only by Escondida and Collahuasi (Cochilco, 2019).
Production in Esmeralda, Dacita, Recursos Norte, and Diablo Regimiento, the current underground mines of DET, cannot be maintained through the ensuing decades due to depletion of the reserves. As a result, Codelco has developed a structural megaproject called New Mine Level (NLM), which aims at developing new productive levels at a greater depth than those currently exploited. By doing so, it will increase DET's copper reserves by more than 2 Gt and thereby extend the life of mine by more than 50 years. This megaproject consists of four productive sections: Andes Norte (North Andes), Pacífico Sur (South Pacific), Andes Sur (South Andes), and Pacífico Norte (North Pacific). These sections are expected to enter production in the years 2023, 2030, 2034, and 2038 respectively.
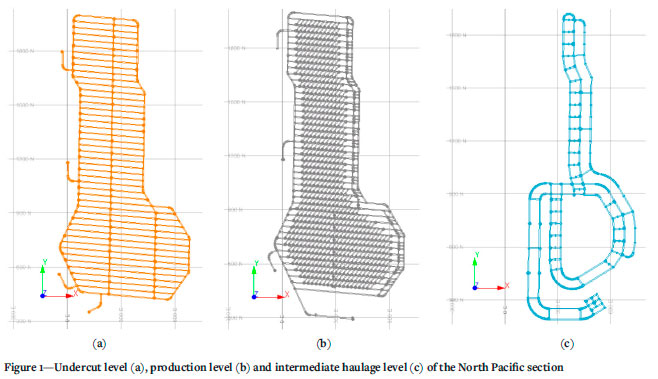
To make production from the NML sections viable, each section must have an undercut level, intermediate transport level, drainage level, ventilation level, and production level. The latter constitutes the largest number of developments. Therefore, the focus of this paper will be on planned developments at the production level. Figure 1 shows an example of an undercut level, where the drilling and loading equipment will undercut the ore deposit; production level, where the LHDs will load the ore from the drawpoints and dump it into the orepasses; and finally the intermediate haulage level where the trucks will circulate to collect the material from the production level and dump it into the orepasses. The orepasses are connected to the conveyor belt of the main haulage system. All these levels belong to the Pacífico Norte (hereon referred to as North Pacific) section of the NML.
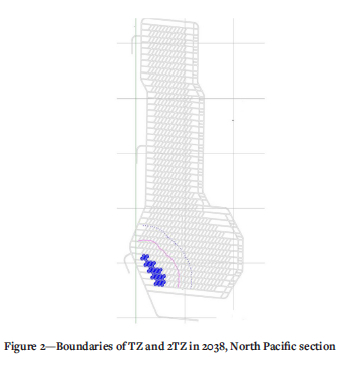
El Teniente mine has within its safety policies provisions to minimize the exposure of equipment and people in the so-called transition zone (TZ), which is defined as 'That area where the state of the stress is increasing and is under continuous changes, and which generates stress conditions considerably greater than the in-situ condition' (Lobiano, 2016). This area of increased stress due to mining and developing caves is the abutment stress zone, which moves through the footprint ahead and follows the undercut face. The stresses in this area can be 1.5 to 2 times greater than the main in-situ stress, which in the case of the NML is estimated at around 50 MPa (Hormazabal et al., 2014). DET established a rule to ensure that the development is always ahead of the TZ and leaves a margin of safety. This rule must be respected for each year of mine production. The rule states that 'Between the transition zone (TZ) and twice the area that it encompasses (2TZ), all tunnels must be developed.' Therefore, to generate the transition zone, the most external production points of each year must be taken to generate a circumference with a radius equal to the TZ, which for the North Pacific section is 80 m. The process must be repeated, this time taking circles with a radius of 160 m. Figure 2 shows the boundaries of the TZ and 2TZ for the year 2038. In order to comply with the rule set by DET, all tunnels below the dotted blue line must be developed by the end of the year 2038. The main idea of the TZ is to have the minimum number of workers in the 'increased stress' zone; therefore, the developments must be advanced as much as possible before the influence of the abutment stress from the undercutting face reaches these areas.
Mine design or AutoCAD software is used by the mine, taking as input the advance plans of the TZ and 2TZ of each section to obtain the sequence of the horizontal developments. Each segment drawn on the AutoCAD plans corresponds to a horizontal drift at scale. The use of this software is justified since it helps to document changes in construction scheduling (Memon, Majid, and Mustaffar, 2006) and communicates the planning to be carried out very effectively. The plans can be used by workgroups from other areas that do not have knowledge of specific software.
However, AutoCAD has limitations; for example, once the planning process is finished, there will be only one scenario to be evaluated (Ramírez, 2020). That scenario is not necessarily optimal since it is based only on the planner's own criteria. Therefore, the use of specialized software such as Datamine Studio UG and EPS tools is recommended. Although none of these tools generates optimal plans, they do allow the simulation and evaluation of multiple scenarios quickly and reliably, and therefore are better for choosing a more robust scenario than the initial case. The scenarios consider different precedence rules for plannable activities (MacNeil and Dimitrakopoulos, 2017), on which the simulation model detailed in the following section can be run.
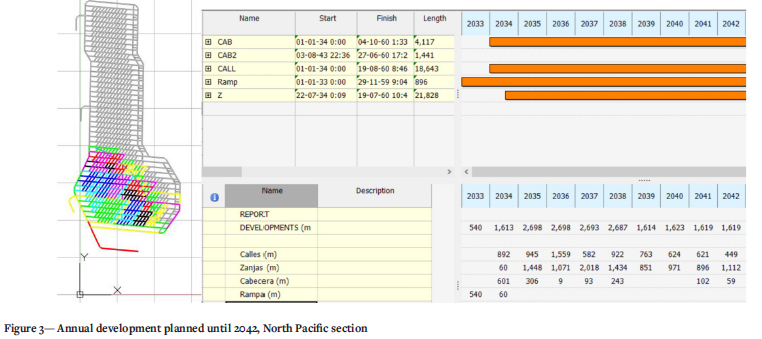
The North Pacific section planning is developed under the assumption that construction starts in 2033 with an open development face, three active faces in the year 2034 and between the years 2039 and 2060, and finally, five active faces between the years 2035 and 2038. An average advance of 45 m per month per face is planned based on these assumptions. In Figure 3, the red coloured segment corresponds to the first development to be carried out in 2033 in the production level of the North Pacific section. From the figure, the restriction imposed on the 2TZ is satisfied since the development of all the tasks that are below the blue segmented line is planned.
DES modelling
System description
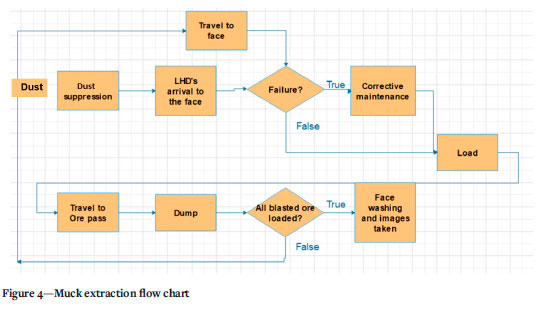
The system to be modelled corresponds to a classic drilling and blasting cycle. The complete development cycle consists of many stages, which can be grouped mainly into muck extraction, ground support, drilling of blast-holes, loading of explosives, blasting, ventilation, and scaling. Muck extraction (Figure 4) corresponds to all the activities necessary to transfer the recently blasted material from the face to an orepass or dumping point. An LHD of 9 cubic yards is used for this task. It is important to note that the availability of the LHD may vary due to failure resulting from hard use and lack of proper maintenance. This will directly affect the equipment performance and consequently the overall cycle (Balaraju, Govinda, and Murthy 2018a).
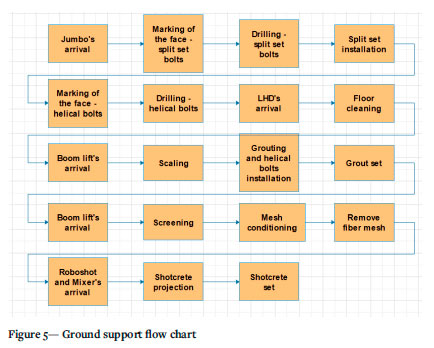
Ground support includes all the activities required to provide support and stability to the developed tunnels and thus minimize the risk of damage to equipment and injuries caused by rockfalls. The resources required for these activities are a crane, jumbo, LHD, roboshot, and mixer. Support of the face begins with the marking of support holes. The jumbo drills the support holes for the installation of the helical bolts and split-set bolts. The crane then enters the face to grout the bolts with a mixture of water, cement, and additives. Once the bolts have set, the crane with a boom lift enters the face for conditioning and installation of the support mesh. The last step in ground supportis the projection of shotcrete using the roboshot equipment. The sum of all these activities constitutes the longest time in the mining development cycle. Figure 5 shows all the necessary support activities.
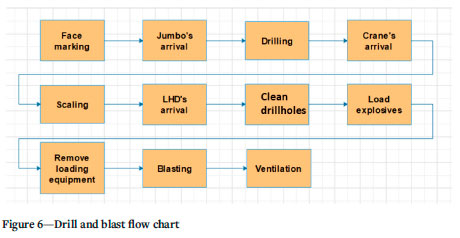
Blast-hole drilling is carried out by a twin-arm jumbo, which is responsible for drilling the face according to the previously designed blast pattern. For the case study, each blast-hole will have a length of 3.2 m. The loading of explosives requires the use of the lifting crane to load each of the previously drilled holes with the corresponding explosive according to the defined blast pattern. Once each hole is loaded and connected, the shift manager acquires authorization to perform the blasting. Scaling is performed to remove loose rocks from the roof and the face. Unlike other activities, scaling will be necessary whenever loose rock is found. Therefore, it is carried out throughout the development cycle. This activity is considered to be always performed after muck extraction, bolt drilling, blast-hole drilling, and blasting (Figure 6). The blast face is typically accessed 30 minutes after a blast due to ventilation regulations.
Data collection and input analysis
Data was collected for five days in a section currently in production at El Teniente to fit the execution times of each of the unit operations with a probability distribution. Raw data from similar studies in productive sections of DET (Ccatamayo, 2017; Chami, 2012) was used for validation during distribution fitting to select the appropriate distributions. It should be noted that mine production parameters such as productivity (normally distributed) typically follow known probability distributions.
The Arena® Input Analyser software was used to fit the data to different statistical distributions. Input Analyser considers the distribution with the least squared error as the best fit. The Kolmogorov-Smirnov test, goodness of fit test, and visual analysis were used to evaluate the quality of fit. The distributions and the parameters obtained for the unit operations are presented in Table I, and those for the LHD cycle in Table II. The distributions were selected based on data type, the number of data-points, and suitability to the variable type (Rockwell Automation, 2019).
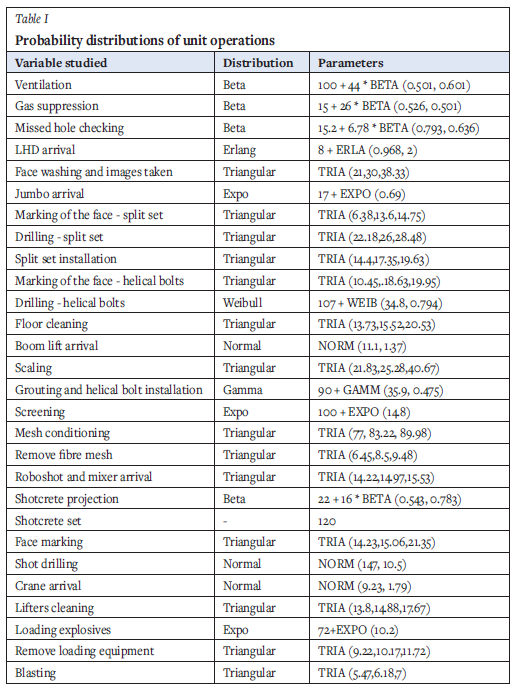
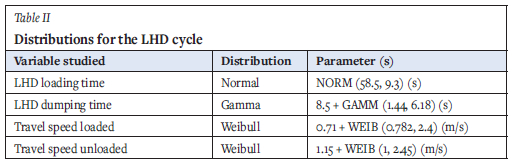
Among the theoretical distributions (Weibull, lognormal, and exponential distributions) used to model equipment failure, the Weibull distribution is the most versatile and better represents the life-cycle of the LHD equipment (Balaraju, Govinda and Murthy, 2018b). Historical data from an LHD of 7 cubic yards and an LHD of 10 cubic yards was taken and adjusted to a Weibull distribution to model the equipment failure rate to simulate the LHD failure. The failure parameter is defined as the number of failures per unit time that can be anticipated (Balaraju, Govinda and Murthy, 2018b). The equipment failure rate fitted with the Weibull distribution to historical data follows Equation [1].
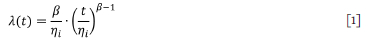
where β = 3.264 is the shape parameter, t is the hours of use of the LHD, and Ni is the characteristic life of the LHD, which depends on the number of overhauls i, following Equation [2]:

where an = 0.371 and μN= 2.875 are drift parameters, and er is Gaussian noise with mean zero and standard deviation σN = 0.095.
The failure of the LHD with hours of use in an interval dt occurs when the condition indicated in Equation [3] is met:

After every maintenance overhaul, t returns to zero, reducing the probability of failure compared to that before maintenance was performed. An LHD with i + 1 overhauls and t hours of use will have a higher probability of failure than an LHD with i overhauls and the same t hours of use, since ni+1< ni is more likely.
Model construction
The Arena simulation software (using discrete event simulation) presents a flexible modelling framework with a hierarchical structure to analyse the impact of changes to a system. A valid model can be used to conduct simulation experiments and predict the performance of the system based on key performance metrics (Rockwell Automation, 2019).
The objective of the simulation is to develop a model capable of predicting real development rates obtained in the current production sections of DET. Arena's high-level modelling modules were used to simulate the mining system following the operational logic in Figures 4, 5, and 6. The main equipment used in the mining cycle, such as the crane, roboshot, mixer and jumbos, and the orepasses, were modelled as resources. The progress throughout the mining cycle was modelled as an entity, and the LHDs for muck extraction were modelled as transporters. The input data for this model corresponds to the distributions listed in Table I in the previous section. The shift system was modelled for 10 hours, with two shifts per day.
One thousand simulations were run to simulate development at the production level for the first six years. A trial-and-error process based on the stability of the half-width was used to determine the optimum number of simulation runs. Using 100 simulations, the half-width obtained was 1.35% of the mean value. Since the computational cost to simulate this model was only a few minutes, it was decided to use 1000 simulations, obtaining a half-width of 0.46% over the mean value. The simulated time in each simulation was six years, as this is the planned time it takes to incorporate the first drawbell. Therefore, it can be assumed that during these first six years of construction, there are no operational interferences with Codelco's production LHDs. There are only interferences with Codelco's development crew, which is reflected in the availability of the orepass.
Model validation
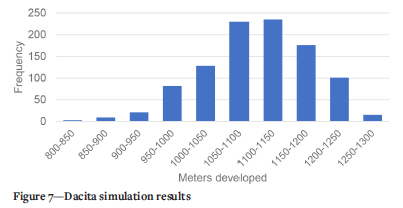
The system modelled was of the production level of the Dacita project in El Teniente, and the model was validated with the data collected from this area. The advances in this section were 3.1 m with a tunnel section of 4.1 x 3.9 m2. The average distance between the draw-points and orepasses was 325 m. The simulation results (Figure 7) showed that the model predicted the construction of 1,088.11 m in a single year, 2.31% less than the 1 113.86 m developed in the same period. Given that the difference is less than 3%, we determine that the model is valid for further experimentation. Figure 7 shows the distribution of results (metres developed) obtained from the simulation.
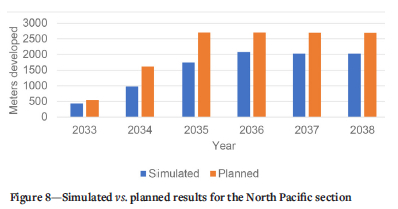
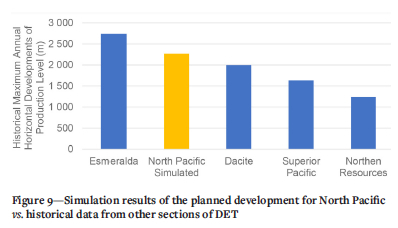
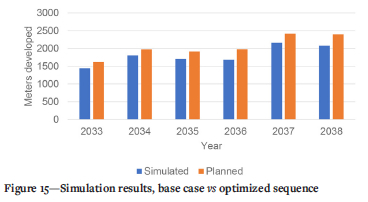
The results of the simulation are compared to the mine development plan for the North Pacific (planned) section (Figure 8) and to the sections of DET (existing) currently in production (Figure 9). From Figure 8, it can be seen that the simulated result is less than the planned development rate as the years pass for North Pacific (future development). This is because the simulation model considers an increase in equipment failure rate due to the accumulated hours of use, while the mine's long-term plan did not consider this aspect. Figure 8 shows the maximum performance achieved by the simulation, which occurs in 2038 with 2085 m and is compared with the maximum annual performance achieved in each of the most relevant mine sections in DET. Based on current development rates, only one section (Esmeralda) of DET has a higher development rate (in metres per year) than that planned for the North Pacific project (Figure 9). This was only possible because the Esmeralda project had already been in production for several years, and therefore much of the section was already developed, which enabled working with multiple fronts and crews.
Experimental analysis
According to Ccatamayo (2017), one of the most inefficient operations in the development cycle of El Teniente mine projects is muck extraction. Since much of the time used to carry out this work is non-productive time, it does not contribute to the advancement of the face. As a result, three scenarios are proposed for the experimental analysis, which seeks to reduce non-contributory and non-productive times. In so doing, muck extraction becomes more efficient, thereby improving the development cycle time.
LHD maintenance strategy
The first experimental scenario involves studying the effect that a change in the maintenance strategy for the LHD equipment has on the development rate. Currently, the strategy is to carry out preventive maintenance on the equipment every 250 hours, following the OEM's recommendations, and to carry out all necessary corrective maintenance whenever the equipment fails while in operation. The alternative strategy to be evaluated seeks to decrease the interval between preventive maintenance, to take advantage of the fact that once maintained, the equipment is in better condition than before, even if not as good as it was originally (Balaraj, Govinda, and Murthy, 2018a, 2018b; Soto and Pascual, 2018). In this case, the preventive maintenance interval for LHD equipment will be reduced to a constant rate k, following Equation [4].
where i is an index that indicates the number of overhauls that the equipment has undergone and Ts is the recommended interval between preventive maintenance overhauls. Different scenarios were generated for k values of 90%, 80%, and 70% in the simulation. The remaining input data stayed the same.
Orepass availability
In DET, the horizontal development is not carried out by Codelco, but is outsourced to contractors. This is to focus Codelco's efforts only on the production of ore and not on the preparation of the mine. The parallel work of Codelco and the contractors at the production level generates operational interferences since both tasks must share accesses, routes, and orepasses. Following the line of prioritizing production, the production level orepasses are mostly destined for mineral production, and only a few orepasses are assigned to the contractor to remove the muck. The purpose of this experiment is to study the effect of orepass availability to the contractors for muck removal on the development rate.
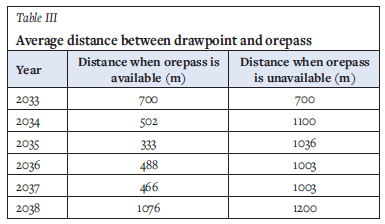
The input data used in the model is the same as for the base case, changing only the probability of available orepasses from 92%, which is the average value calculated in the current productive sections of DET, to 83% and 100%. These values correspond to the minimum and maximum values of orepass availability in the same section, respectively. Table III shows the average distance between the drawpoint and the dumping point when the assigned orepass is available and when it is not. It is expected that as the distance between the alternate route and the original route increases, there will be a greater impact on the developed metres as the availability of the orepass varies.
Planned development sequence
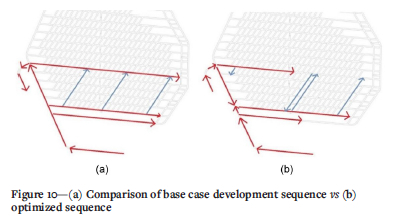
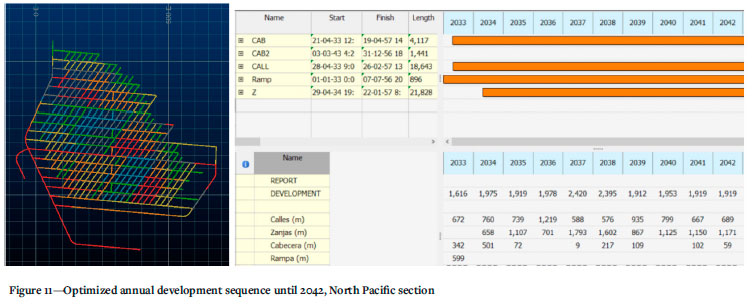
This experiment aims to study the effect of using a newly optimized development sequence on the annual development rate. Datamine Studio UG and EPS software were used to design and generate this sequence, which allows simulating and evaluating multiple developments and construction sequences quickly and easily. This new sequence considers starting the developments in the year 2033 by entering through two different accesses, and then between the years 2034 to 2036, the ability to open and work in three faces simultaneously. In 2037 and 2038, the number of faces that can be opened and worked will increase to five. Between the years 2039 to 2056, four active faces can be maintained, eventually decreasing to a single face from 2057 to the end of the development. This sequence is considered optimum since it reduces the average transport distance between the drawpoint and the orepasses while meeting operational requirements. It also allows the LHD equipment to work in a range of distances where it is more efficient. Furthermore, it allows multi-face work to be started from the first year of development, increasing the efficiency and effectiveness of the work. Therefore, it is expected that implementing the new sequence will increase the metres developed annually compared to the planned design. In Figure 10, the red arrows indicate the development direction of the main accesses, and the light blue arrows the development direction of the extraction drives.
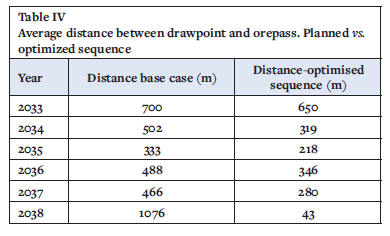
The Gantt chart (Figure 11) details the new sequence planned for the next ten years. The figure shows that in the year 2033, the optimized sequence is able to develop more than 600 m of extraction drive, which gives more flexibility in subsequent years by providing better routes that shorten the average hauling distance. Table IV shows the difference between the year-to-year mean distance for the planned sequence and the optimized sequence.
Results and discussion
LHD maintenance strategy
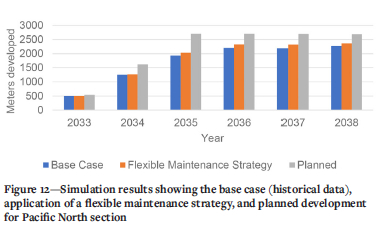
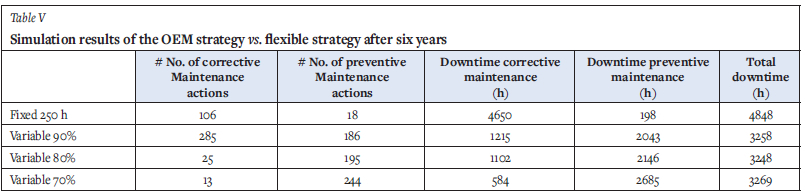
Table V shows the number of preventive and corrective maintenance actions and the corresponding downtime, derived from the simulation according to the parameter k used. Using the proposed maintenance strategy with a parameter of k = 80% gives the best results. Figure 12 compares the linear metres built between the OEM and the flexible maintenance strategy. It is noteworthy that after six years, the alternative strategy (k = 80%) has developed 457 m more than the base case, which corresponds to an increase of 4.42%. This reduces the difference between the simulated and the planned development rate from 20% to 16%. Figure 12, illustrates the benefit of the flexible strategy in the later years. In later years, the characteristic life of the LHD is shorter, which causes it to fail more frequently, therefore more frequent preventive maintenance helps reduce the failure rate.
Orepass availability
The simulation results indicate that as the availability of orepasses for muck extraction increases, the duration of the global muck extraction cycle decreases by an average of 13 minutes per cycle, while the duration of the complete development cycle decreases by 5 hours. Figure 13 compares the linear metres achieved year-by-year between the base case and the scenarios with 83% and 100% orepass availability. After six years, by increasing the availability of the orepass to 100%, it is possible to advance 194 more metres. Although this result can be considered of little significance, it should be noted that less orepass availability will mean longer mucking times. This will negatively affect the development rate since this material will have to be transported to further dumping points. The benefit of 100% orepass availability has already been seen in the mines currently in production at El Teniente. This, however, has required a greater planning effort by the Codelco.
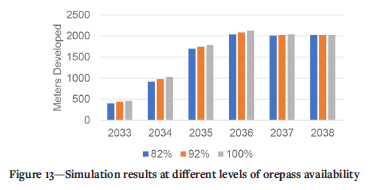
Figure 13 shows the probability density function for the three scenarios. It can be seen that the greater the orepass availability, the lower the variability presented since it decreases the probability that the LHD will have to travel greater distances to take an alternative route.
Planned sequence
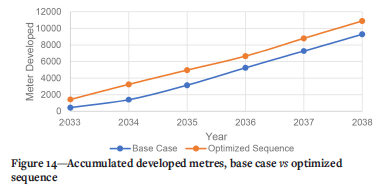
Figure 14 compares the linear metres achieved year-by-year between the base case (currently planned sequence) and the newly generated planning sequence. After six years, the new sequence enables the construction of 10 886 metres of tunnels, which is 1 598 metres more than the base case. This benefit is mainly obtained in the first year because the optimized sequence manages to work on an additional face. In the latter years, the optimized sequence performs better even when it works with the same number of faces as the base case, which is explained by the shorter distance between the drawpoint and orepass that is obtained each year. The new sequence is less demanding with the metres required for the first six years of development and better manages the use of work crews. Therefore, compliance with the planned development is more probable (Figure 14).
Estimating the optimal time to perform preventive maintenance depends on striking a balance between production loss due to downtime and unavailability of the equipment during maintenance. This is reflected in the simulation results obtained at a k value of 80% outperformed that at 70%. Although using a flexible maintenance strategy increased the orepass availability, and the optimized development sequence increased the development and the probability of achieving the planned development rate at the Pacific North section, it is important for the mine to perform a cost-benefit analysis prior to implementing the research findings. Based on the study of the mine, the authors, however, believe that the mine has the resources to carry out the recommended plans, especially since the existing planned development would require more resources to achieve it. The use of a more advanced tool such as Datamine Studio UG and EPS allows for quick changes in the optimal development sequence and would enable as a fast decision-making tool in the case of unwanted incidents such as collapses and temporary loss of access to productive areas.
Conclusion
A simulation model of the development cycle for the El Teniente New Mine Level was presented. The model considers the uncertainty in the execution times of each unit operation of the cycle and allows the evaluation of the development rate through multiple faces. The New Mine Level is a megaproject of DET, the world's largest underground copper mine. The operation aims to keep the Division's copper production at 137 000 t/d through deeper mining of the orebody A DES model was developed and validated with historical data from current sections in operation. Three experimental scenarios were analysed using the validated model in the production level of the future North Pacific section of the New Mine Level to evaluate the feasibility of obtaining the planned development target. The results from the simulation experiment are compared with historical data from existing sections. The following observations were made:
> The metres developed in the base case simulation using historical data are less than the metres planned for the Pacific North section. This is because operational uncertainties included in the model, such as LHD failure and orepass availability, were not considered in the initial planning sequence, resulting in an overestimation of the development rate.
> The metres developed in the base case simulation for the North Pacific section is at the upper limit of the ranges reached by the Division's current operating mines.
> A flexible maintenance strategy for LHDs increases the metres developed by 457 metres after six years.
> A 100% orepass availability allows the metres developed after six years to be increased by 194 metres.
> By using the proposed optimum development sequence, an increase of 1,598 meters can be achieved after six years as compared to the base case.
This work presents an initial base for evaluating the impact that the improvement of critical unit operations can have on the horizontal development cycle of an underground mine. Past research has not yet studied the relationship between underground mine development and unit operations in a disaggregated way. Reliability analysis of other equipment such as the jumbo and/or the impact of using different blast designs can be evaluated as part of future work. Future work should also include revaluation of the development rate in the New Mine Level sections using the developed model once operation commences. It is also recommended that more data be collected for future analysis.
Acknowledgment
The authors would like to thank Codelco - El Teniente Division for allowing us to work with them to obtain data from the development cycle and Datamine Software for giving us the software used in this paper.
Conflict of interest
The authors declare that they have no conflict of interest.
Funding statements
The authors received no financial support for the research, authorship, and/or publication of this article.
References
Ahmed, H.M., Scoble, M.J., and Dunbar, W.S. 2016. A comparison between Offset Herringbone and El Teniente underground cave mining extraction layouts using a discrete event simulation technique. International Journal of Mining, Reclamation and Environment, vol. 30, no. 2. pp. 71-91. [ Links ]
Anani, A. and Awuah-Offei, K.,2017. Incorporating changing duty cycles in CM-shuttle car matching using discrete event simulation: A case study. International Journal of Mining and Mineral Engineering, vol. 8, no. 2. pp. 96-112. [ Links ]
Anani, A., Nyaaba, W., Hekmat, A., and Cordova, E.A. 2019. Optimizing cut-out distance for maximum coal productivity. SIMULATION, vol. 95, no. 6. pp. 545-559. [ Links ]
Balaraju, J., Govinda Raj, M., and Murthy, C.H.S.N. 2018a. Estimation of reliability-based maintenance time intervals of Load-Haul-Dumper in an underground coal mine. Journal of Mining and Environment, vol. 9, no. 3. pp. 761-770. [ Links ]
Balaraju, J., Govinda, M., and Murthy, C. 2018b. Reliability analysis and failure rate evaluation of load haul dump machines using Weibull distribution analysis. Mathematical Modelling, vol. 5, no. 2. pp. 116-122. [ Links ]
Basu, A.J. and Baafi, E.Y. 1999. Discrete event simulation of mining systems: current practice in Australia. International Journal of Surface Mining, Reclamation and Environment, vol. 13, no. 2. pp. 79-84. [ Links ]
Ccatamayo Barrios, J.H. 2017. Aplicación de filosofía Lean en la preparación minera, mina El Teniente Codelco Chile. Application of lean philosophy in mining preparation, El Teniente Codelco Chile mine. Master's thesis, Universidad de Chile, Santiago, Chile. http://repositorio.uchile.cl/handle/2250/147376 [ Links ]
Chami, J. 2012. Optimización de los procesos de Desarrollo y Construcción en minería de block caving caso estudio mina El Teniente Codelco Chile Optimization of Development and Construction processes in block caving mining, case study El Teniente Mine Codelco Chile. Master's thesis, Universidad de Chile, Santiago, Chile. http://repositorio.uchile.cl/handle/2250/114467 [ Links ]
Cochilco. 2019. Anuario de estadísticas del cobre y otros minerales: 1999-2018 [Yearbook of Copper and Other Minerals Statistics: 1999-2018]. Santiago. [ Links ]
Codelco. 2020. Memoria Anual 2019 [Annul report 2019]. Santiago. [ Links ]
Dehghani, H. and Ataee-Pour, M. 2012. Determination of the effect of operating cost uncertainty on mining project evaluation. Resources Policy, vol. 37, no. 1. pp. 109-117. [ Links ]
Díaz, M., Rojas, P. and Vargas, M. 2019. Construction of mining projects in El Teniente. Campos, and Morales. The proceedings of the 6th International Conference on Geology and Mine Planning. Santiago, 7-9 August. Geomin, Santiago. [ Links ]
Dindarloo, S.R., Osanloo, M., and Frimpong, S. 2015. A stochastic simulation framework for truck and shovel selection and sizing in open pit mines. Journal of the Southern African Institute of Mining and Metallurgy, vol. 115, no. 3. pp. 209-219. [ Links ]
Greberg, J., Salama, A., Gustafson, A., and Skawina, B. 2016. Alternative process flow for underground mining operations: analysis of conceptual transport methods using discrete event simulation. Minerals, vol. 6, no. 3. p. 65. [ Links ]
Haque, M.A., Topal, E., and Lilford, E. 2014. A numerical study for a mining project using real options valuation under commodity price uncertainty. Resources Policy, vol. 39. pp. 115-123. [ Links ]
Hormazabal, E., Pereira, J., Barindelli, G., And Alvarez, R. 2014. Geomechanical evaluation of large excavations at the new level mine-El Teniente. 3rd International Symposium on Block and Sublevel Caving, Universidad de Chile. pp. 486-500. [ Links ]
Laubscher, D.H. 1994. Cave mining-the state of the art. Journal of the Southern African Institute of Mining and Metallurgy, vol. 94, no. 10. pp. 279-293. [ Links ]
Leiva, F. 2015. Desarrollo de una metodología para la obtención de la major configuración de turnos para la construcción de un túnel horizontal, Minera San Pedro [Development of a methodology to obtain the best configuration of shifts for the construction of a horizontal tunnel, Minera San Pedro]. Thesis, Universidad de Santiago de Chile, Santiago, Chile. [ Links ]
Lobiano Correa, C.H. 2016. Inclusión de interferencias operacionales de origen geotécnico en planificación minera de Panel Caving. [Inclusion of geotechnical operational interferences in panel caving mine planning], Master's thesis, Universidad de Chile, Santiago, Chile. http://repositorio.uchile.cl/handle/2250/139851 [ Links ]
MacNeil, J.A. and Dimitrakopoulos, R.G. 2017. A stochastic optimization formulation for the transition from open pit to underground mining. Optimization and Engineering, vol. 18, no. 3. pp. 793-813. [ Links ]
Manríquez, F., Pérez, J., and Morales, N. 2020. A simulation-optimization framework for short-term underground mine production scheduling. Optimization and Engineering, vol. 21, no. 3. pp. 939-971. [ Links ]
Memon, Z.A., Majid, M.Z.A., and Mustaffar, M. 2006. A systematic approach for monitoring and evaluating the construction project progress. Journal of Industrial Engineering, vol. 67, no. 3. pp. 26-32. [ Links ]
Musingwini, C. 2016. Optimization in underground mine planning - developments and opportunities. Journal of the Southern African Institute of Mining and Metallurgy, vol. 116, no. 9. pp. 809-820. [ Links ]
Navarro, C. 2012. Simulación de ciclos de construcción de labores subterráneas mediante el método de Montecarlo, Proyecto Olivo Minera San Pedro. Simulation of underground work construction cycles using the Montecarlo method, Olivo Project Minera San Pedro. thesis, Universidad de Santiago de Chile, Santiago, Chile. [ Links ]
Paravarzar, S., Pourrahimian, Y., and Askari-Nasab, H. 2018. Short-term underground mine planning: A review. Mining Optimization Laboratory, University of Alberta, vol. 780, no. 1. p. 305. [ Links ]
Park, S., Choi, Y., and Park, H.S. 2016. Optimization of truck-loader haulage systems in an underground mine using simulation methods. Geosystem Engineering, vol. 19, no. 5. pp. 222-231. [ Links ]
Ramírez, I.J.S. 2020. Simulación como herramienta para identificar y comprender las operaciones críticas en el ciclo de desarrollos horizontales [Simulation as a tool to identify and understand critical operations in the horizontal development cycle], Master's thesis, Pontificia Universidad Catolica de Chile, Chile. [ Links ]
Rocher, W., Rubio, E., and Morales, N. 2011. Eight-dimensional planning: construction of an integrated model for the mine planning involving constructability. Proceedings of the 35th International Symposium on Application of Computers in the Minerals Industry. Wollongong, Australia. Australian Institute of Mining and Metallurgy, Melbourne. pp. 393-406. [ Links ]
Rockwell Automation. 2019. Arena: User's guide. Milwaukee, WI. [ Links ]
Runciman, N., Vagenas, N., and Baiden, G. 1999. Evaluation of underground development mining systems using discrete-event simulation. Simulation, vol. 72, no. 1. pp. 4-11. [ Links ]
Salama, A., Greberg, J., and Schunnesson, H. 2014. The use of discrete event simulation for underground haulage mining equipment selection. International Journal of Mining and Mineral Engineering, vol. 5, no. 3. pp. 256-271. [ Links ]
Salama, A., Nehring, M., and Greberg, J. 2017. Financial analysis of the impact of increasing mining rate in underground mining, using simulation and mixed integer programming. Journal of the Southern African Institute of Mining and Metallurgy, vol. 117, no. 4. pp. 365-372. [ Links ]
Singer, D.A. and Kouda, R. 1999. Examining risk in mineral exploration. Natural Resources Research, vol. 8, no. 2. pp. 111-122. [ Links ]
Skawina, B., Greberg, J., Salama, A., and Gustafson, A. 2018. The effects of orepass loss on loading, hauling, and dumping operations and production rates in a sublevel caving mine. Journal of the Southern African Institute of Mining and Metallurgy, vol. 118, no. 4. pp. 409-418. [ Links ]
Skawina, B., Greberg, J., Salama, A., and Schunnesson, H. 2014. Mechanical excavation and drilling and blasting-A comparison using discrete event simulation. Proceedings of Mine Planning and Equipment Selection, Springer, Cham. pp. 367-377. [ Links ]
Soto, I. and Pascual, R. Using maintenance options to minimise the expected total cost of mining haulage fleets. Proceedings of the 3rd International Seminar on Operational Excellence in Mining, Santiago, 21-23 March 2018. Gecamin, Santiago. [ Links ]
Vagenas, N. 1999. Applications of discrete-event simulation in Canadian mining operations in the nineties. International Journal of Surface Mining, Reclamation and Environment, vol. 13, no. 2. pp. 77-78. [ Links ]
 Correspondence:
A. Anani
Email: angelinaanani@arizona.edu
Received: 8 Mar. 2022
Revised: 12 May 2022
Accepted: 14 Jun. 2022
Published: October 2022

