


Services on Demand
Article
 English (pdf)
 Article in xml format
 Article references
Indicators

Related links
-
 Cited by Google
 -
 Similars in Google
Share

 Permalink
Journal of the Southern African Institute of Mining and Metallurgy
On-line version ISSN 2411-9717
Print version ISSN 2225-6253
J. S. Afr. Inst. Min. Metall. vol.122 n.9 Johannesburg Sep. 2022
http://dx.doi.org/10.17159/2411-9717/1249/2022
PROFESSIONAL TECHNICAL AND SCIENTIFIC PAPERS
Evaluation of rockburst energy capacity for the design of rock support systems for different tunnel geometries at El Teniente copper mine
F.A. VillalobosI; S.A. VillalobosII; L.E. AguileraIII
IUniversidad Católica de la Santísima Concepción, Chile. https://orcid.org/0000-0002-5419-3958
IIBECHTEL G&HES - Mining & Metals, Chile
IIIConsorcio JEJ-CYGSA, Chile
SYNOPSIS
Rockburst events have been a serious problem for many years in many mines worldwide, and in particular at El Teniente mine in Chile. El Teniente is the largest copper mine in the world, located in the Andes Cordillera where high stress levels are present due to intensing mining activity in addition to complex geology. Consequently, the study and management of the rockburst threat are necessary. In this work, the case of the Diablo Regimiento (DR) mine within El Teniente is studied. The energy capacity of dynamic support systems is determined for different tunnel geometries based on two kinetic methodologies, using data from DR. Initially, rockburst potential is determined by means of a stress analysis around different tunnel geometries through the boundary elements method. In the first methodology a yielding zone (YZ) is estimated for each excavation geometry using the finite element method FEM. The second methodology involves the definition and determination of a critical strain energy (SE) around each excavation geometry using a FEM numerical analysis. In both cases, peak particle velocity PPV is estimated by a scaling law, which is subsequently adjusted due to tunnel amplification effects. According to the results, and knowing the working energy capacity applied in DR mine, it was found that the values of energy capacity for the rock dynamic supports were better estimated by the YZ-PPV approach than by the SE approach.
Keywords: rockburst, peak particle velocity, yielding zone, strain energy, dynamic rock support, energy capacity.
Introduction
The search for new orebodies has led several mining projects around the world to exploit much deeper underground (e.g. Stacey and Rojas, 2013). El Teniente mine in Chile is an example of this process. El Teniente is the largest underground copper-molybdenum mine in the world (Stern, Skewes, and Arevalo, 2011; Skewes et al, 2005), producing around 140 000 t/d and with more than 3000 km of galleries. The mine is located in the Andes Cordillera (34°05'S, 70°21'W) between 3200 and 2200 m above sea level. El Teniente is actually a group of production units, comprising Diablo Regimiento, Esmeralda, Dacita, Reservas Norte (RENO), Pipa Norte, Sur Andes Pipa, Pilar Norte, and Teniente Sur. A new and deeper extension of the current extraction levels at 1880 m is called the New Mine Level project (NMLP), which is a panel caving project around 1.2 km below ground surface (Jarufe and Vasquez, 2014). At El Teniente, mining at great depths, in addition to high regional tectonic forces combined with particular geological (e.g. discontinuities, faults, lithology) and geotechnical conditions (strong stiff rock mass) induces frequent seismic activity leading to rockbursting. Seismic activity and rockburst events have been recorded at El Teniente production mining levels (e.g. Kaiser, Tannant, and McCrete, 1996; Cai and Kaiser, 2018) and no exception is forecast in the deeper NMLP (Potvin, Jarufe, and Wesseloo, 2010b). Therefore, there is a need to ensure safe mining conditions by implementing adequate design practices to mitigate and control rockbursts. Although procedures and solutions for rock support systems have been proposed and applied at El Teniente (e.g. Kaiser, Tannant, and McCrete, 1996), it is important to verify these approaches. For instance, Jarufe and Vasquez (2014) presented procedures for the determination of the energy demand to be adopted in the dynamic support design at the NMLP. They carried out numerical analyses to calculate contours of a strength factor around a horseshoe excavation to define zones of fractured rock due to seismic events. However, the meaning of the strength factor and the numerical calculations were not clearly explained.
In the present work, a combination of different approaches, namely empirical, analytical, and numerical methods, is outlined and applied for the analysis of rockburst potential with the aim of designing dynamic support systems for the mining and geological conditions at Diablo Regimiento (DR) mine. Different excavation geometries are considered for comparison with the horseshoe tunnels usually adopted in DR mine.
The rockburst and strainburst phenomenon
Rockburst is defined as serious damage to an underground excavation that occurs in a sudden and violent form, which is associated with seismic events induced by mining activities (e.g. Kaiser, Tannant, and McCreath, 1996; Cai and Kaiser, 2018). Rockbursts can cause a sudden and severe bulking in the interior of an excavation or violent rock ejections from the contour of the excavation (e.g. Kaiser and Cai, 2013; Stacey and Rojas, 2013). The generic term rockburst is independent of the cause and process of failure, whereas the term 'strainburst' not only tries to explain the damage type, but also the reason for and process of failure (Gao et al., 2019; Kaiser, 2017).
A strainburst is a sudden and violent rock failure close to the excavation surface with a localized seismic source and damage (Gao et al., 2019; Kaiser and Cai, 2013). This may (or may not) cause material ejection. The majority of strainbursts are caused by mining-induced stresses, that is, the burst is caused by changes in the stress and stiffness regime as a result of tunnel advance or stope excavation. The damage may be related with the stored energy around the excavation, or affected by the energy associated with the seismic event. If the damage is caused only by the stored energy, the burst is self-activated and will trigger seismic events. On the contrary, in other bursts the activation is triggered and magnified by a seismic event (Kaiser and Cai, 2013). Depending on the triggering mechanism and type of event, the process that causes rockbursts can be differentiated among self-activated strainburst, mining-induced strainburst, seismically-triggered strainburst, and dynamically loaded strainburst (Gao et al., 2019; Kaiser 2017).
In practice, the seismic sources that cause rockbursts are measured using the moment magnitude (MW) or the local Richter scale (ML), which are based on the amplitude of the propagated P and S waves; or the Nuttli magnitude (MN), which is based on the amplitude of multiple reflected and refracted shear waves (Mendecki, 2016). Morrisette et al. (2012) demonstrated that there is not significant dependence on the severity of damage from an excavation in a rockburst event for ML magnitudes below 2.5 (MN < 3). But, for cases of events with magnitudes greater than that, the severity of the damage has been shown to be dependent on the seismic event.
Proposed methodology
Several methods have been proposed for the analysis of rockburst potential by means of an index or relationship. These methods broadly cover approaches of stress-strength ratios and energy using, for instance, the peak particle velocity (PPV) (see for example Bacha et al. 2020: Perez, 2015).
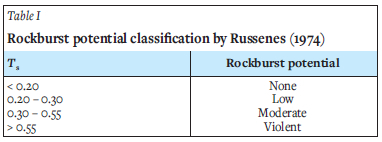
Among the different types of relationships proposed, that by Russenes (1974) offers a better prediction rate of rockburst occurrence (Perez, 2015). This criterion is based on the ratio Ts between the excavation-induced maximum tangential stress σ6 and the surrounded rock's uniaxial compression strength σc (Equation [1]). Table I presents the rockburst intensity or potential for different ranges of Ts values.

After obtaining the rockburst potential, two methods are implemented to obtain the kinetic energy from a possible rockburst. These are the yielding zone criterion (YZ-PPV) and the strain energy criterion (SE-PPV). The first method is based on the yielding zone of an excavation and the PPV experienced by rock fragments at the moment of ejection in a rockburst (e.g. Kaiser and Cai, 2012). The PPV parameter is obtained following the model proposed by Kaiser, Tannant, and McCreath (1996). The second method is based on the rock strain energy and the rock PPV (e.g. Kaiser and Cai, 2012; Weng et al., 2017). For the application of each methodology, the finite element method (FEM) was used to estimate the yielding zone (YZ) and the strain energy (SE) at the excavation contours. For both criteria the energy produced by the rockburst is considered as kinetic energy, which is a function of the rock mass that bursts and the ejection velocity:
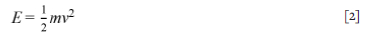
where E is the energy in kJ, m is the mass of the ejected rock in tons, and v is the particle maximum velocity in m/s. The mass is calculated as the rock area failing per metre of tunnel advance divided by the tunnel perimeter in contact with the lost area. In this way, the energy is expressed in kJ/m2.
Diablo Regimiento case study
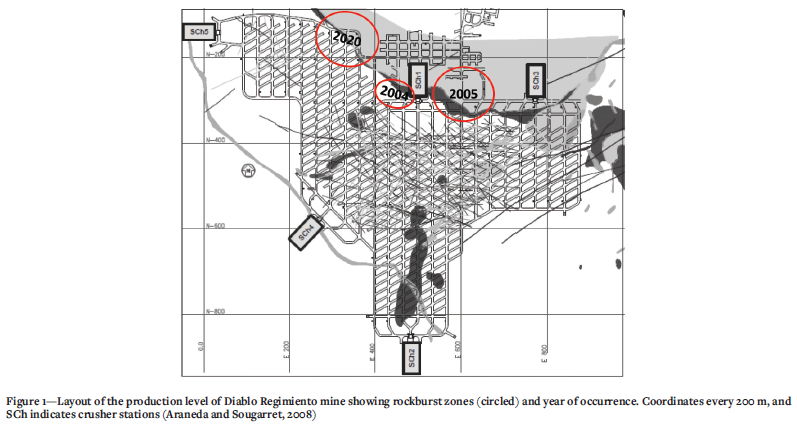
This study is based on data collected from the sublevel Diablo Regimiento (DR) at El Teniente mine, which is a mine with a long record of rockburst events (e.g. Kaiser, Tannant, and McCreath, 1996; Cai and Kaiser, 2018). Seismicity recordings at El Teniente mine since 1982 include severe seismic events (ML = 3.2 to 4.0), which have led to numerous major rockburst events. More than 50 rockburst events per year took place between 1983 and 1987, with around 130 and 100 in 1983 and 1987, respectively. Although, fewer than 50 rockburst events occurred at the end of the 1980s and beginning of the 1990s, events did not reduce in intensity. Some severe rockburst events destroyed extensive areas, resulting in stoppages to production (in 1987 and 1992). Since 1992, significant changes in operating procedures have been implemented. Hydrofracturing has been introduced to reduce the intensity of seismicity (Araneda and Sougarret, 2008; Valderrama and Saéz, 2015) and ground support considering energy dissipation capacity is part of the design procedures, which forms part of this study. From 1995 to 2007 there were several seismic events from 0.8 up to 3.2 magnitude, albeit mostly with slight to medium damage. However, a few seismic events were accompanied by significant damage due to rockbursts, for example the events in 2005 in Esmeralda, RENO, and DR (Alvina, 2008; Potvin, Jarufe, and Wesseloo, 2010b; Araneda and Sougarret, 2008) and Pilar Norte in 2011 (Malovichko, Cuello, and Rojas, 2018). In DR rockburst events occurred in 2004, 2005 and recently in 2020 (Figure 1).
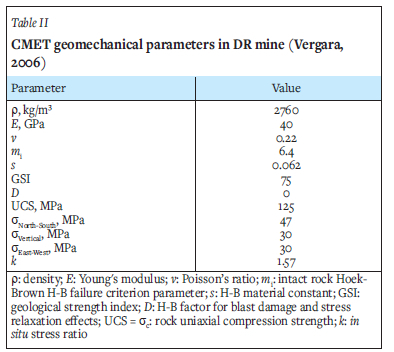
DR mine is located at an average level of 2192 masl. The lithology in DR corresponds mainly to andesite, referred to as the El Teniente Mafic Complex (CMET > 90%). The rock is massive with structures filled with quartz, sulphur and anhydrite due to hydrothermal activity (e.g. Stern, Skewes, and Arevalo, 2011; Brzovic and Leon, 2017). A view of the DR mine layout is shown in Figure 1. DR is composed of parallel galleries separated by a distance of 34 m with a horseshoe section of 4.5 m height and 4.5 m width (see Figure 3b). Table II presents CMET representative geomechanical parameters as well as the field stress values adopted in this study.
For the seismic analyses, the studies of Kaiser, Tannant, and McCreath (1996) and Estay (2014) in the Reservas Norte (RENO) mine at El Teniente were considered. In the latter study a records from 2003 to 2011 were used. Figure 2 summarizes the level of seismicity obtained from seismic sensors in terms of magnitude and event frequency as a function of altitude.
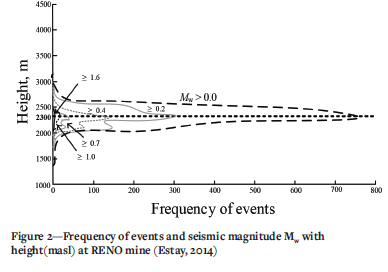
Figure 2 shows that the level where the seismicity is concentrated is at 2300 masl. Although not possible to see this in Figure 2, the largest recorded event corresponds to a moment magnitude Mw close to 3.1, which is equivalent to a Richter magnitude ML = 3.1 and Nuttli magnitude MN = 3.6. Kaiser, Tannant, and McCreath (1996) and Jarufe and Vasquez (2014) also reported seismic events at El Teniente with maximum moment magnitudes Mw of 3.0. Therefore, the whole horizontal plane at 2300 masl can be considered as a seismic source with a maximum event magnitude of 3.1.
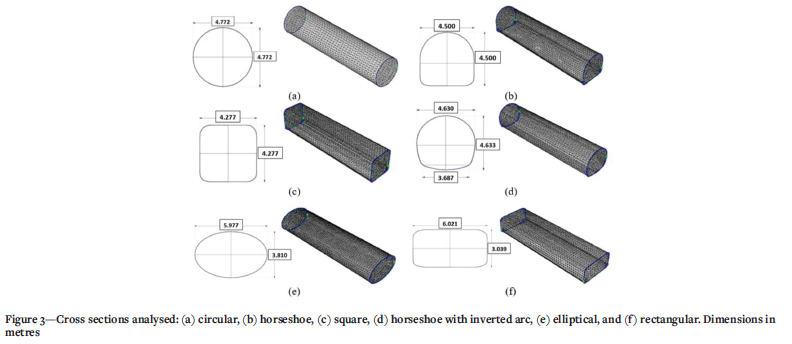
In this study the rockburst potential and response to rockbursts is investigated for different tunnel geometries under the loading regime and geomechanical conditions present in DR mine. The tunnel geometries considered in the study are circular, horseshoe, square, horseshoe with inverted arc, elliptical, and rectangular as shown in Figure 3. The tunnels were modelled based on a typical cross-section used in DR mine tunnels, with dimensions of 4.5 x 4.5 m (width and height) and a cross-section of area of 17.8 m2.
In the elliptical tunnel case the ratio adopted between the horizontal A and vertical B diameter of the ellipse is the same as the in situ stress ratio k = σh/σv. The reason behind this design criterion is based on elasticity theory and empirical evidence that the stress concentration and magnitude diminish around an elliptical excavation that follows A/B = k. This is also referred to as the optimal ellipse tunnel.
Results and analysis
Rockburst potential evaluation
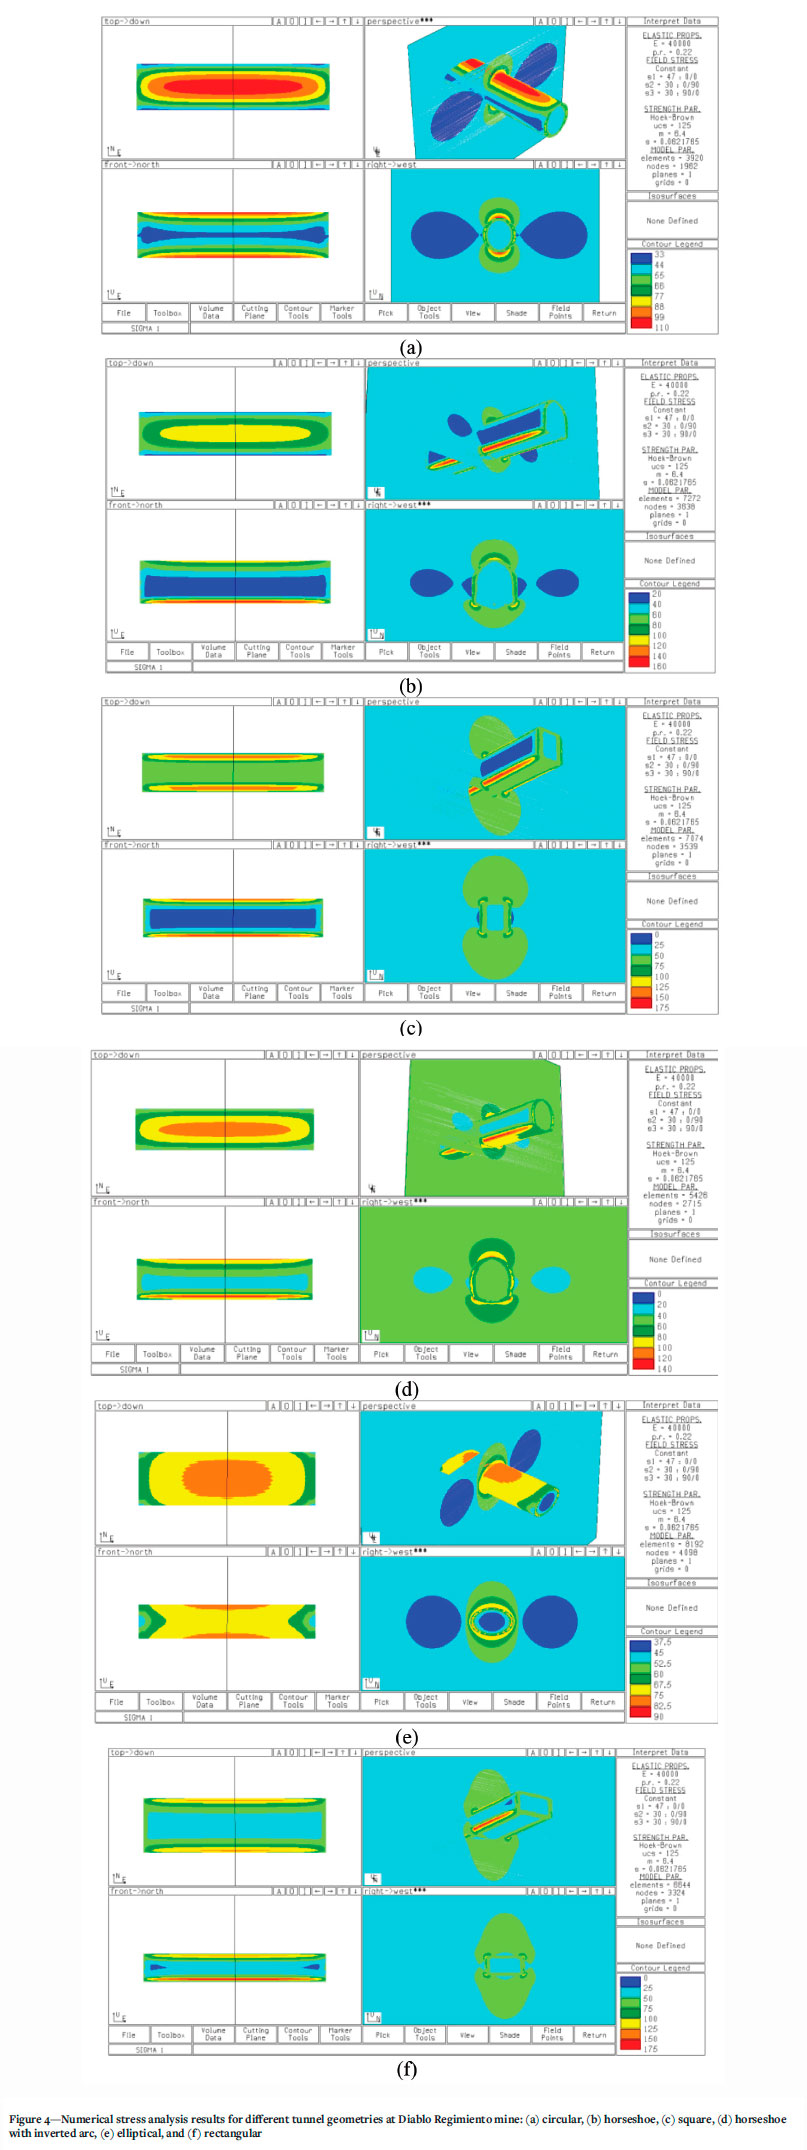
The evaluation of the zones of maximum induced stresses for each tunnel geometry was carried out using Examine 3D software (Rocscience, 2016), which is based on the boundary element model (BEM). Figure 4 shows results of the induced major principal stress (σ) analysis for each tunnel cross-section using as input the parameter values from DR mine summarized in Table II. From these results the maximum induced stress for each geometry was obtained, and this data was used in the rockburst potential assessment adopting the criterion of Russenes (1974).
From Figure 4a it can be observed that for a circular tunnel subject to the field stresses present at DR mine, the maximum induced σ1 of 110 MPa concentrates on the roof and floor of the tunnel. Moreover, stress relaxation takes place in the tunnel walls. For the horseshoe tunnel (Figure 4b) a maximum induced σ1 of 160 MPa was obtained in the bottom edges, whereas stress relaxation occurs in the tunnel walls also. The horseshoe geometry is that used in DR mine. Therefore, results for the horseshoe tunnel geometry are of particular interest, since they can be compared and applied to DR mine. For the square tunnel (Figure 4c), the numerical model estimated a maximum σ1 of 175 MPa, concentrating at the four corners of the cross-section. The relaxation zones, due to the direction of the increased in situ stresses, occur again in the tunnel walls with induced σ1 values between 20 to 40 MPa.
For the modified horseshoe inverted arc shape shown in Figure 4d, the maximum induced σ1 estimated by the numerical modelling is 140 MPa, concentrating in the bottom edges and tunnel roof.
Figure 4e shows that an elliptical tunnel induces the lowest σ1 value of 82.5 MPa, which agrees with the optimum ellipse design according to the elasticity theory mentioned previously for this geometry. This means that σ1 is distributed more regularly around the contour of the elliptical excavation, thus avoiding large stress differences, that is, without stress relaxation zones, which are found beyond the tunnel periphery. Consequently, elliptical tunnel geometries are convenient when dealing with a high stress field. However, it should be mentioned that achieving this geometry in practice is a complicated task. It requires that the geometry follows the principal directions of the stress field, and this is not always possible because the mine design is probably already fixed.
From Figure 4f it can be observed that the maximum induced σ1 for a rectangular tunnel is 175 MPa, which concentrates in the four corners of the tunnel section similar to the case of the square tunnel. Here again the relaxation is found in the tunnel walls. Furthermore, it is important to mention that for the square and rectangular tunnels the magnitude of the induced σ1 is greater than those for the other tunnel geometries analysed, since the right-angled corners tend to concentrate high stress levels.
Table III summarizes the results for induced σ1 and the ratio σ1/σc. It can be seen that there is a violent rockburst potential according to the criterion of Russenes (Table I). For all the tunnel geometries studied under the in situ stresses and geomechanical properties present in DR mine, Ts = σ1/σc = σO/σ1 > 0.55. This is mainly caused by the high in situ stresses at DR mine with a major principal stress of 47 MPa.
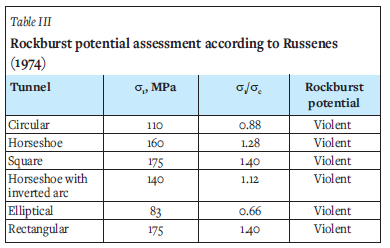
Even though the circular and elliptical tunnels are less favourable geometries for high stress concentrations, i.e., show less rockburst potential than the other geometries, they can still present a violent rockburst potential. For the horseshoe tunnel, which corresponds to the DR mine tunnel geometry, a violent rockburst potential is also estimated due to the high stress concentrations in the bottom corners and tunnel roof.
Estimation of the energetic demand by the YZ-PPV criterion
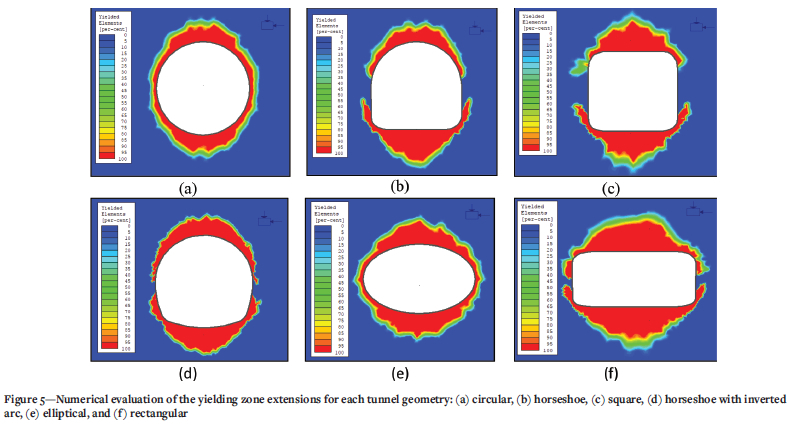
Since there is a violent rockburst potential at DR mine, an adequate design for the rock support is required to withstand or mitigate this type of event. To determine the needed support energy capacity the yielding zone criterion YZ was first adopted. Finite element method (FEM) modelling was carried out using the RS2 software (Rocscience, 2017) and input data from DR mine (Table II). The main purpose was to model the yielding zones for each excavation geometry, in other words, the amount of yielded or loose rock around the tunnel that could be ejected during a rockburst event. The yielding zones for each excavation geometry are shown in Figure 5 as a percentage of yielded elements, where red represents 100% of elements yielding. In this form, the rock mass that could possibly fail in a rockburst event is obtained. It is worth mentioning that the numerical modelling did not incorporate any kind of rock support, in order to visualize the real rock mass behaviour as a result of the excavation.
From Figure 5 it can be observed that each tunnel geometry results in different plastic areas around the excavation. Straight horizontal edges tend to generate more extensive yielding areas than curved contours. However, arc edges like those found in the elliptical tunnel generate a large yielded area too. In contrast, straight vertical edges tend to not generate yielding areas. Therefore, the generation or not of extensive plastic zones around tunnels depends largely on the horizontal extension of their edges, in other words, the longer the horizontal edge is, the greater the yielding zone generated. Therefore, the design of excavations with circular or arched edges is recommended to avoid the generation of thick plastic zones, with smooth and not straight vertices to avoid concentration of high stresses. Since all the cross-sections analysed have the same area, the dimensions of the yielding zones generated depends exclusively on the tunnel geometry. The determined values of the amount of yielding rock mass are presented in Table V, where it can be noted that the horseshoe tunnel geometry adopted at DR mine has the minimum yielding zone.
A reasonable peak particle velocity (PPV) should be established for the estimation of the kinetic energy caused by a possible rockburst, which is needed for the support design. For this purpose, the scaling law proposed by Kaiser, Tannant, and McCrete (1996) and subsequently modified by Potvin, Wesseloo, and Heal (2010a), is adopted.
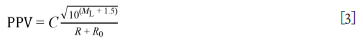
where R is the distance to the seismic focus, C is an empirical constant between 0.2 and 0.3, and R0 is the source influence radius expressed as:
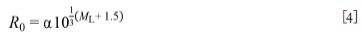
where ML is the magnitude of the seismic event on the Richter scale and a is an empirical constant varying between 0.53 and 1.14, although for El Teniente a value of 0.50 has been normally adopted (Kaiser, Tannant, and McCrete 1996).
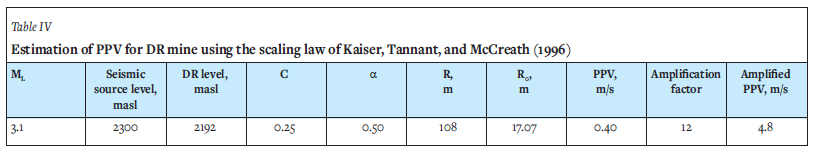
However, the presence of an underground opening can produce a wave amplification phenomenon that increases the values of PPV around the excavation perimeter by several times compared with the PPV from the same tremor measured some distance away in the rock mass. This PPV amplification depends mainly on the tunnel dimensions, modulus of elasticity, and wave propagation frequency. It has been found from measurements in deep mines that PPV amplification can be between 1 and 25 with an average value of 12, with significant variation (e.g. Milev et al., 2002; Milev and Spottiswood, 2005). Additionally, it has been determined from FEM numerical models of wave propagation that the PPV amplification can be between 6 and 12 for an isolated tunnel in an elastic, isotropic and homogeneous material (van Sint Jan and Alvina, 2008; Alvina, 2008). However, the PPV amplification can reach values up to 25 in the case of a damaged rock annulus or the presence of a nearby excavations. Jarufe and Vasquez (2014) adopted an amplification factor of 12 for the rock support design in the NMLP at El Teniente. A similar PPV amplification value of 12 is adopted in this study as a compromise between measured values and those obtained from FEM numerical studies. A precise value depends on site-specific conditions and calculating it will require sophisticated in situ measurement resources or complicated numerical analyses (or both) to obtain a reliable value. Table IV presents data and results for the determination of PPV using the scaling law and an amplification factor.
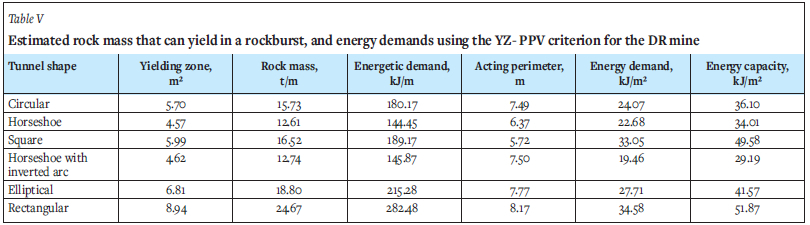
PPV values measured at El Teniente mine range from 4 to 7 m/s (Bravo-Haro et al., 2017). The PPV of 4.8 m/s obtained by means of the scaling law for DR mine is within that range. Using the kinetic energy expression (Equation [2]) it is possible to obtain rockburst event energetic demands, and by using an energy factor of safety (FS) and following the YZ-PPV criterion, the support design values to apply in DR mine can be obtained. Table V shows the results for an acting perimeter which corresponds to the perimeter to where the yielding zone around the excavation has expanded. The last column in Table V corresponds to the support energy capacity obtained after applying an energy factor of safety FS = 1.5, which corresponds to the FS value currently adopted at El Teniente mine. The energetic demand is obtained from Equation [2] using the rock mass and PPV. Then, the energetic demand is divided by the acting perimeter to obtain the energy demand, which is multiplied by FS = 1.5 to finally estimate the energy capacity. The results for yielded rock mass in Table V are below the range between 20 and 40 t/m reported as loose, overbreak, or damaged rock by Jarufe and Vasquez (2014) for the units NMLP, RENO, and Esmeralda.
Estimation of the energetic demand by means of the SE-PPV criterion
Rock failure occurs when the strain energy (SE) per unit volume exceeds the uniaxial compression strength (UCS). Analytically, SE depends on the in situ stresses, rock elasticity constants, and confinement variations. In view of the changes in the confinement equilibrium conditions, resulting in zones of stress accumulation and zones of stress relaxation, the rock in situ SE becomes modified (e.g. Krstulovic, 2017).
If σ1, σ2, and σ3 are the principal stresses in the rock, E is the Young's modulus, v is the Poisson's ratio, and assuming a homogeneous, isotropic rock, the strain energy can be obtained by the expression proposed by Love (1927):
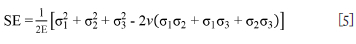
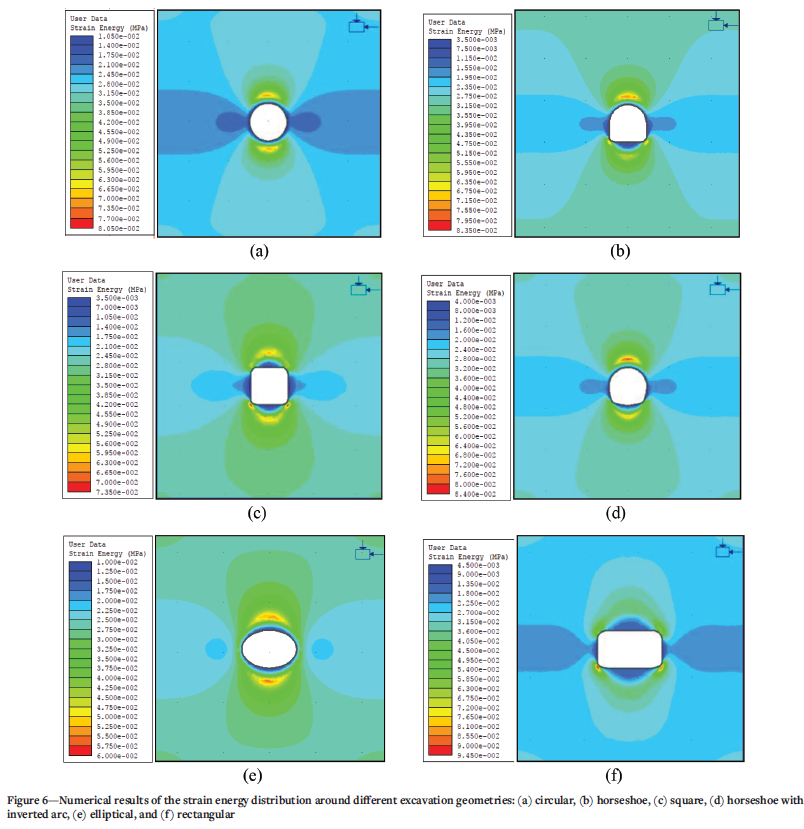
From uniaxial and triaxial tests, Krstulovic (2017) determined SE values for the CMET rocks. From the test results a minimum critical SE value of 0.045 MPa was determined for the CMET specimens, after which violent failure would occur. This SE value allows the determination of the acting perimeter, which surrounds the area with high rock energy levels. Figure 6 shows the results from the FEM modelling for each excavation geometry. The modelling was performed to determine the SE of the rock around the contour of the excavation. In this analysis Equation [5] was implemented in the Rocscience RS2 software since it is not part of the analysis options.
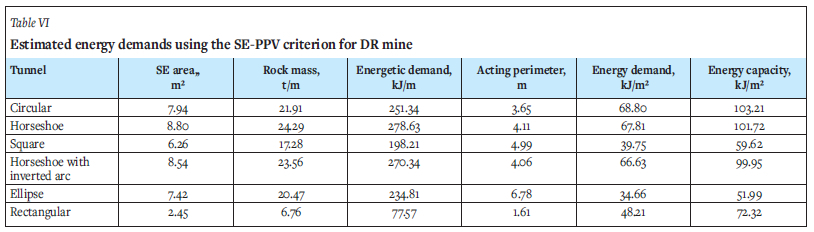
The SE distributions around each excavation geometry (Figure 6) tend to follow the σ1 distributions shown in Figure 4, and not really resemble the yielding zones shown in Figure 5. Therefore, it can be expected that the rock area under high SE which is likely to fail due to a seismic event will be rather different to that obtained from the YZ-PPV criterion. This may originate from the nature of plasticity modelling behind the yielding zone criterion, which is different from the elasticity modelling behind the strain energy criterion. Results summarized in Table VI may explain this difference in terms of rock mass area values associated with the defined limit of SE for each tunnel geometry, as well as acting perimeters and energy capacities obtained as before with a factor of safety FS = 1.5. Comparing these results with those in Table V, it can be noted that SE analysis results in higher energy capacities, mostly owing to the larger rock masses and smaller acting perimeters. The difference becomes significant (around three times larger) for circular, horseshoe and horseshoe, with inverted arc geometrics. For the other tunnel geometries the difference is less than 40%. The tunnel geometry that involves the least energy demand is the ellipse, and (surprisingly) the square and rectangular follow with less energy demand. This is because the square and rectangular sections generate a lesser amount of rock area subjected to high values of SE, due mainly to the accumulation of stress in the two bottom corners. Note again that the horseshoe is the tunnel geometry adopted in DR mine and the SE area and rock mass in this case are maximum obtained. Therefore, the elastic strain energy approach implies that the horseshoe geometry involves the largest amount of rock with accumulated elastic energy that could be released by a seismic event.
The energy capacity estimations obtained from the YZ-PPV and SE-PPV criteria for the horseshoe tunnel case (which is the excavation geometry employed in DR mine) were compared with the energy capacity values for the support currently used, the performance of which has been adequate so far. The comparison is shown in Table VII.
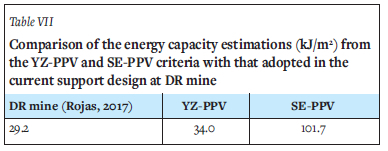
It is clear that the YZ-PPV estimation is much closer to the energy capacity value currently adopted. Moreover, there is evidence from rockburst back-analysis that for the NMLP at El Teniente the energy demand causing most of the damage is less than 50 kJ/m2, and that higher values are usually related to weak zones due to geometric singularities (Jarufe and Vasquez, 2014).
Conclusions
According to the rockburst potential assessment using the criterion of Russenes (1974), there is a high potential for rockburst occurrence in Diablo Regimiento DR mine, with events of violent intensity for all the evaluated excavation geometries (circular, horseshoe, square, horseshoe with inverted arc, ellipse, and rectangular). This is in agreement with the evidence from several rockburst events reported at El Teniente. Consequently, it is necessary that the rock support systems be able to withstand the dynamic energy demand imposed by a rockburst.
Two methodologies have been applied to DR mine for the estimation of the energy capacity for rock support for six different tunnel geometries. These methodologies rely on the peak particle velocity PPV. The first one is based on the amount of rock mass yielding around the excavation (yield zone YZ-PPV criterion), and the second one on the amount of strain energy stored in the rock mass (SE-PPV criterion). FEM numerical analyses were undertaken in order to determine the yield zones and strain energies. PPV was estimated using a scaling law and was further amplified by a semi-empirical factor, resulting in a value of 4.8 m/s.
From the YZ-PPV criterion, it was found that the energy capacity for a rock support system is higher for rectangular, square, and elliptical tunnels (in that order), and lower for the horseshoe with an inverted arc, horseshoe, and circular, (again in that order). Therefore, the horseshoe geometry seems to be a good choice. In fact, the estimated energy capacity of 34 kJ/ m2 for the horseshoe configuration is slightly higher than the value currently adopted at DR mine (29 kJ/m2), which has proved satisfactory. On the contrary, the SE-PPV criterion resulted in much larger values of the support energy capacity, where the elliptical tunnel had the minimum value of 51 kJ/m2, followed by the square and rectangular geometries, whereas the horseshoe had a value of 101 kJ/m2, almost three times that obtained using the YZ- PPV criterion. These results indicate that the YZ- PPV criterion represents a lower bound, closer to the current energy capacity that has been adopted in DR mine.
Future research should include calibration of volume and mass of damaged rock with the results from actual rockburst events, as well as 2D and 3D numerical modelling with DFN (discrete fracture network) to estimate the structural network in the rock mass (as in Villalobos, Cacciari, and Futai, 2017), which could generate wedges or blocks around the tunnel likely to be ejected in a rockburst event.
References
Alvina, N. 2008. Numerical analysis of the dynamic behaviour of tunnels under seismic events, the case of El Teniente rockburst. MSc thesis, P. Universidad Católica de Chile [in Spanish]. [ Links ]
Araneda, O. and Sougarret, A. 2008. Lessons learned in cave mining at the El Teniente mine over the period 1997-2007. Proceedings of the 5th International Conference and Exhibition on Mass Mining, Luleâ, Sweden, pp. 43-52. [ Links ]
Bacha, S., Mu, Z., Javed, A., and Al Faisal, Sh. 2020. A review of rock burst's experimental progress, warning, prediction, control and damage potential measures. Journal of Mining and Environment, vol. 11, no. 1, pp. 31-48. [ Links ]
Bravo-Haro, M., Muñoz, A., Rojas, E., and Sarrazin, M. 2017. Evaluation of kinetic energy on rocks ejected during rock bursting through image processing of compression tests. El Teniente mine case. Proceedings of the 9th International Symposium on Rockburst and Seismicity in Mines (RaSiM9), Vallejos, J. (ed.). 1517 November 2017, Santiago, Chile, pp. 168-173. [ Links ]
Brzovic, A. and Leon, I. 2017. Integrated photogrametry and discrete fracture network modeling to determine rock structure around excavation at the El Teniente mine. Proceedings of the 9th International Symposium on Rockburst and Seismicity in Mines (RaSiM9), Vallejos, J. (ed.). 15-17 November 2017, Santiago, Chile. pp. 209-216. [ Links ]
Cai, M. and Kaiser, P.K. 2018. Rockburst support. Vol. 1: Rockburst Phenomenon and Support Characteristics. Mirarco and Laurentian University, Sudbury, Ontario, Canada. [ Links ]
Estay, R. 2014. Methodology for the performance evaluation of seismic indicators in the mining induced seismicity. MSc thesis, University of Chile, Santiago, Chile [in Spanish]. [ Links ]
Gao, F., Kaiser, P.K., Stead, D., Eberhardt, E., and Elmo, D. 2019. Strainburst phenomena and numerical simulation of self-initiated brittle rock failure. International Journal of Rock Mechanics and Mining Sciences, vol. 116. pp. 52-63. [ Links ]
Jarufe, J.A. and Vasquez, P. 2014. Numerical modelling of rock-burst loading for use in rock support design at Codelco's New Mine Level Project. Mining Technology, vol. 123, no. 3. pp. 120-127. [ Links ]
Kaiser, P.K. 2017. Ground control in strainbursting ground - a critical review and path forward on design principles. Proceedings of the 9th International Symposium on Rockburst and Seismicity in Mining (RaSiMy), Vallejos, J. (ed.). 15-17 November 2017, Santiago, Chile, pp. 146-158. [ Links ]
Kaiser, P.K. and Cai, M. 2013. Critical review of design principles for rock support in burst-prone ground-time to rethink!. Proceedings of the 7th International Symposium on Ground Support in Mining and Underground Construction, Potvin, Y. and Brady, B. (eds.). Australian Centre for Geomechanics, Perth, Australia, Australian Cente for Geomachanics. 13-15 May 2013. pp. 3-39. [ Links ]
Kaiser, P.K. and Cai, M. 2012. Design of rock support system under rockburst condition. Journal of Rock Mechanics and Geotechnical Engineering, vol. 4, no. 3. pp. 215-227. [ Links ]
Kaiser, P.K., Tannant, D.D., and McCreath, D.R. 1996. Canadian rockburst support handbook. Geomechanics Research Centre, Laurentian University, Sudbury, Ontario, Canada. [ Links ]
Krstülovic, G. 2017. Evaluation of the rock deterioration criterion and the strain energy co-criterion to anticipate and mitigate rockbursts currently under mining by caving. Proceedings of the 9th International Symposium on Rockburst and Seismicity in Mines (RaSiM9), Vallejos, J. (ed.), Santiago, Chile, pp. 272-278. [ Links ]
Love, A.E.H. 1927. A Treatise on the Mathematical Theory of Elasticity. Cambridge University Press, UK. [ Links ]
Malovichko, D., Cuello, D., and Rojas, E. 2018. Analysis of damaging seismic event on 24 December 2011 in the Pilar Norte sector of El Teniente mine. Proceedings of the Fourth International Symposium on Block and Sublevel Caving. Potvin, Y and Jakubec, J. (eds). Australian Centre for Geomechanics, Perth, Australia, pp. 637-650. [ Links ]
Mendecki, A.J. 2016. Mine Seismology Reference Book. Seismic Hazard. Institute of Mine Seismology, Kingston, Tasmania. [ Links ]
Milev, A.M. and Spottiswood, S.M. 2005. Strong ground motion and site response in deep South African mines. Journal of the Southern African Institute of Mining and Metallurgy, vol. 105, no. 7. pp. 515-524. [ Links ]
Milev, A.M., Spottiswoode, S.M., Noble, B.R., Linzer, L.M., van Zyl, M., Daehnke, A., and Acheampong, E. 2002. The meaningful use of peak particle velocities at excavation surfaces for the optimisation of the rockburst criteria for tunnels and stopes. Division of Mining Technology, CSIR: project GAP-709 Report 305. Pretoria. [ Links ]
Morrisette, P., Hadjigeorgiou, J., and Thibodeau, D. 2012. Validating a support performance database based on passive monitoring data. Proceedings of the 6th International Seminar on Deep and High Stress Mining, Potvin, Y. (ed.). Australian Centre for Geomechanics, Perth, Australia, pp. 27-39. [ Links ]
Perez, J.R. 2015. Estudo do potencial de rockburst em túneis por análise de tensoes. (Study of rockburst potential in tunnels by means of stress analysis). MSc thesis, University of Brasilia, Brazil [in Portuguese]. [ Links ]
Potvin, Y., Wesseloo, J., and Heal, D. 2010a. An interpretation of ground support capacity submitted to dynamic loading. Mining Technology, vol. 119, no. 4. pp. 233-245. [ Links ]
Potvin, Y., Jarufe, J., and Wesseloo, J. 2010b. Interpretation of seismic data and numerical modelling of fault reactivation at El Teniente, Reservas Norte sector. Mining Technology, vol. 119, no. 3. pp. 175-181. [ Links ]
Rocscience. 2016. Examine 3D boundary element stress analysis for underground structures, Version 4.1, Rocscience Inc., Toronto, Ontario, Canada. [ Links ]
Rocscience. 2017. Rock and soil 2-dimensional analysis program RS2. Version 9.0, Rocscience Inc., Toronto, Ontario, Canada. [ Links ]
Rojas, E. 2017. Geotechnical aspects and technological development in the control of rockbursting for tunnelling. Geomechanical Division, CODELCO, Chile [in Spanish]. [ Links ]
Russenes, B.F. 1974. Analysis of rock spalling for tunnels in steep valley sides. MSc thesis, Norwegian Institute of Technology, Trondheim, Norway [in Norwegian]. [ Links ]
Skewes, M.A., Arévalo, A., Floody, R., Zúniga, P., and Stern, C.R. 2005. The El Teniente megabreccia deposit, the world's largest deposit. Super Porphyry Copper and Gold Deposits-A global Perspective, Porter, T.M. (ed.), Porter Geoscience Consultancy Publishing, Adelaide, Australia, vol. 1. pp. 83-113. [ Links ]
Stacey, T.R. and Rojas, E. 2013. A potential method of containing rockburst damage and enhancing safety using a sacrificial layer. Journal of the Southern African Institute of Mining and Metallurgy, vol. 113, no. 7. pp. 565-573. [ Links ]
Stern, Ch. R., Skewes, M.A., and Arévalo, A. 2011. Magmatic evolution of the giant El Teniente Cu-Mo deposit, Central Chile. Journal of Petrology, vol. 52, no. 7-8. pp. 1591-1617. [ Links ]
Valderrama, C. and Sáez, E. 2015. Numerical modelling and diagnostic techniques of hydraulic fractures based on their inlet behaviour. Obras y Proyectos vol. 18. pp. 56-62. [ Links ]
Van Sint Jan, M. and Alvina, N. 2008. Ground movement amplification around underground excavations. Australian Centre for Geomechanics Newsletter, no. 31. pp. 21-22 [ Links ]
Vergara, R. 2006. Analysis of the resistance and stability of pillars in the Diablo Regimiento mine, El Teniente. MSc thesis, University of Chile, Santiago, Chile [in Spanish]. [ Links ]
Villalobos, S., Cacciari, P., and Futai, M. 2017. Numerical modelling of the formation and instability of blocks around the Monte Seco tunnel excavated in a discontinuous rock mass. Obras y Proyectos, vol. 21. pp. 54-64 [in Spanish]. [ Links ]
Weng, L., Huang, L., Taheri, A., and Li, X. 2017. Rockburst characteristics and numerical simulation based on a strain energy density index: a case study of a roadway in Linglong gold mine, China. Tunnelling and Underground Space Technology, vol. 69. pp. 223-232. [ Links ]
 Correspondence:
F.A. Villalobos
Email: avillalobos@ucsc.cl
Received: 6 Jul. 2020
Revised: 1 Mar. 2022
Accepted: 8 Jun. 2022
Published: September 2022

