


Serviços Personalizados
Artigo
 Inglês (pdf)
 Artigo em XML
 Referências do artigo
Indicadores

Links relacionados
-
 Citado por Google
 -
 Similares em Google
Compartilhar

 Permalink
Journal of the Southern African Institute of Mining and Metallurgy
versão On-line ISSN 2411-9717
versão impressa ISSN 2225-6253
J. S. Afr. Inst. Min. Metall. vol.122 no.8 Johannesburg Ago. 2022
http://dx.doi.org/10.17159/2411-9717/2004/2022
COAL EDITION
Estimation of coal density using a 3D imaging system: RhoVol
F. Nakhaei; Q.P. Campbell; M. le Roux; S. Botlhoko
School of Chemical and Minerals Engineering, North-West University, South Africa. F. Nakhaei: https://orcid.org/0000-0001-8840-9772; Q.P. Campbell: https://orcid.org/0000-0003-0510-6018; M. le Roux: https://orcid.org/0000-0002-9330-426X
SYNOPSIS
The results of coal sink and float tests are plotted as washability curves. Analysis of these curves indicates the most effective method by which the coal can be cleaned. Sink and float experiments are sampling-dependent, destructive, and use toxic chemicals. The present research introduces an alternative method based on a 3D imaging system called RhoVol, in which the density of individual particles is determined from mass and volume measurements. A quantitative error analysis was conducted on coal sample density measurements obtained by RhoVol, and the main factors influencing the errors identified and investigated. The results show that the drawback of this technique is related to its not being able to detect hidden concavities in the particle, resulting in an overestimation of particle volume. Furthermore, it is difficult to capture the impact of porosity and cracks on the volume of coal particles obtained from 3D silhouette images. This mismatch between the RhoVol data and sink and float test results has led to attempts to apply neural network (NN) and linear regression techniques to produce a fully reliable model for correction and estimation of coal density. The NN approach offers superior predictive capability over linear regression, and the estimated density distribution is in line with the sink and float analysis. The root mean square error in estimation of density using the NN model was less than 0.05 g/cm3.
Keywords: coal, density, error, linear regression, neural network, RhoVol, sink and float, washability.
Introduction
Coal is a major fossil energy source for production of electrical power, which plays an important role in the economic development of many countries (Campbell, le Roux, and Nakhaei, 2021a,b). Coal requires to be processed to remove gangue minerals in order to increase its quality. Coal particles have different densities, affected by the maceral and mineral compositions, rank, volatile matter, and ash and moisture contents (Roux, 2021). Most coal cleaning processes are based on gravity separation. Coal washability data is vital for assessing the performance of coal preparation plants. The washability curves are expressed under optimal conditions in sink and float experiments in a graphic format (Korkmaz and Bentli, 2017; Botlhoko et al., 2021; 2022).
The sink and float method separates coal and gangue particles based on density by allowing particles to sink or float in dense liquid solutions of known density (Zhang et al., 2011). The particles of higher density sink in the liquid medium and are transferred to a solution of greater density, whereas the lighter ones float on the liquid surface (Callen et al., 2008). These dense liquids pose health and environmental hazards. Increasing concerns over the risks of heavy liquids have resulted in an alternative method of determining coal washability curves.
Sink and float tests are expensive and time-consuming. Coal washing plants usually perform a comprehensive sink and float experiment once a month. In daily operation, operators often conduct a rapid test every hour to optimize the processing conditions. Typically, results take a few hours to be returned, so it is not possible to accurately optimize the plant operation. Moreover, sink and float tests rely strongly on the expertise and experience of the operator, and the repeatability of the process can be poor. The rapid calculation of coal washability curves has therefore become a vital topic of investigation (Ze-Lin et al., 2011; Fofana and Steyn, 2019).
Some alternative methods, including magnetized fluids, dual energy X-ray transmission (DEXRT) systems, dense medium suspensions, gas pycnometry, and replacing organic liquids with salt solutions such as zinc chloride, have been reported in the literature (Forbes et al., 2003; Fofana and Steyn, 2019).
Although salt solutions are preferable to heavy organic liquids, they commonly need to be washed from the coal after the test. Furthermore, they are costly and hazardous in high concentration.
Lu (1996) studied the relationship between coal ash and its float and sink behaviour and presented a model to estimate the float and sink response of the raw coal. Liu and Lu (1998) estimated the washability of raw coal from the total ash content. Wang and Lu (1999) established a model to estimate the washability curve on the basis of the relationship between the ash content and density of the raw coal. Prediction of floating and sinking ratios from the ash content of the raw coal has been shown to resulting in a big difference between the estimated and the real values. Considerable work has been done by different investigators using advanced techniques, such as the DEXRT system (Zhang et al., 2021) to estimate coal sortability and washability. These systems are able to analyse the ash content and specific gravity of a given particle by measuring the X-ray attenuation for each sample.
Particle density is the ratio of the mass to volume. Since 3D imaging systems can analyse on a particle -by -particle basis, it is possible to estimate the volume and density of a certain particle, which can be applied to the washability analysis of a given coal sample. The RhoVol system, commercialized by De Beers Technologies (South Africa), calculates the density of particles by determining the mass and volume. The 3D model generated using the integrated seven-camera system enables an estimation of the volume of the particle. This technique provides a good estimation of the visual hull of a particle (Mangera, Morrison, and Voigt, 2016; Botlhoko et al, 2021).
Reliable density measurement is essential for characterizing raw coal and predicting the performance of a coal washing plant. A good measurement system allows for rapid processing and repeatability and produces reliable results. One concern for the RhoVol is that the volume calculation is based on apparent measurement, not a real measurement; therefore its accuracy depends on how well particle volume represents the true volume.
Mangera, Morrison, Voigt (2016) proposed a technique for correction of particle volume estimation by applying a shape-dependent scaling factor. They used a k-means algorithm to identify the shape classes and applied a class scale factor to each sample. This method reduces the volume error from 20% to 6%. This approach has proved successful in kimberlite analysis.
The goal of this study is to ascertain if RhoVol is able to sort coal particles based on density to determine the washability curve, as obtained by the sink and float method. The purpose is to understand the fundamentals of the RhoVol process, especially the errors associated with density measurement and the approaches known to minimize errors.
In this paper, the validity and reliability of a camera-based 3D imaging system for coal density measurement are investigated to improve the accuracy of RhoVol. Moreover, error correction methods for coal density obtained by RhoVol are proposed. We apply linear regression and neural network (NN) techniques as powerful functional approximators to correct the coal density obtained from RhoVol parameters so as to be close to sink and float test results. A model that decreases the errors is suggested and the applicability of RhoVol in coal sorting applications is verified.
Experimental
Materials
Fifty-seven coal particles in the size fraction -8+2.8 mm (RhoVol's size limitation) with significant shape variations were prepared and used in the experiments. The particles had ash contents ranging from 8% to 52%. These particles were chosen from coal samples obtained from mines in the Witbank and Molteno-Indwe coalfields (South Africa). Highveld is a low-rank bituminous coal while Molteno-Indwe is lean coal bordering on anthracite. These coal particles were individually sorted by float-sink testing and the Rhovol machine.
RhoVol measurements
Digital image processing is a fast, non-invasive, and low-cost technology for obtaining process-related information and is widely accepted in mineral processing (Nakhaei et al., 2018; 2019; Nakhaei, 2021). RhoVol is an image-processing-based measurement system that determines the size, shape and volume of particles. It is also equipped with a high-speed load cell to accurately measure the mass of particles. Figure 1 shows a schematic diagram of the RhoVol system. RhoVol is able to produce a density distribution of particles in a speedy and safe way. The system uses seven cameras at various angles to record seven silhouettes of a particle at a time. A 3D model of the sample is calculated as the intersection of silhouette cones obtained by back-projecting the silhouettes from the different viewpoints, so that any size and shape properties can be obtained, such as minimum circle diameter (MCD), minimum square sieve size (MSSS), roller gap size (RGS), compactness, elongation, and flatness. The 3D model produced in this way is termed the visual hull and is the maximal approximation of the object that is consistent with a given set of silhouette views (Laurentini, 1994; Mangera, Morrison, and Voigt, 2016).
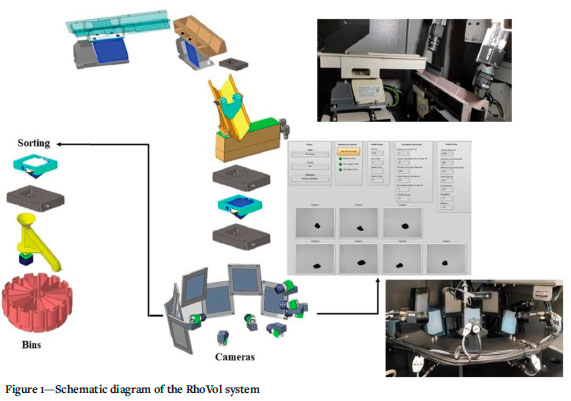
The RhoVol is also equipped with a sorting functionality in which samples are detected and sorted into twelve discrete bins based on any of the particle characteristics such as density, mass, size, or shape.
The accuracy of the density measurement would affect the sorting results and therefore it is essential to understand the errors associated with the RhoVol system. In this study, two main sources of error, termed the instrumental error or repeatability and heterogeneity error or accuracy, are investigated. Repeatability includes independent experimentaly results which are acquired the same way, using identical test parameters, for the same sample (Polakowski et al., 2021). Hence, repeatability represents the best accessible internal precision. The accuracy is the gap between a measured value and a true value.
The repeatability and accuracy of the measured density or volume rely greatly on the physical features and the orientation of a particle at the moment when the images are recorded (Forbes et al., 2006; Forbes, 2007).
In order to investigate the repeatability of the measurement system, each particle was passed through the machine seven times and the volume and density values compared. To assess the RhoVol accuracy, the average of seven replications is compared with the volume or density obtained through a sink and float test. In plain words, any calibration procedure is meant to fix the RhoVol parameters such that the results are as close as possible to the sink and float results.
Sink and float testwork
Coal density differs from seam to seam, based on the coal rank and purity. Sink and float experiments are used to sort coal samples according to their densities. In this work, coal density was determined using a series of solutions of different densities (ranging from 1.20 to 2.1 g/cm3 in incremental steps of 0.05 g/cm3). Nineteen consecutive vessels were used in these experiments. The densities of the solutions were measured using a hydrometer. After preparing the solutions, each particle was loaded into the solution of lowest density first. Then, the sink particle was collected and washed before being placed in the vessel with the next higher density, and so forth. Based on the sink and float experiments, the density of coal particles can be measured with probable error ±0.05 g/cm3. These tests helped to evaluate the feasibility of the successful application of RhoVol on the coal samples.
Methodology
Multi-layer perceptron (MLP)
The neural network (NN) is considered one of the most robust and practical methods for modelling of nonlinear systems in many fields of engineering. The NN is a nonlinear statistical data modelling tool that is used to establish the relationship between independent variables and the dependent variables of a process (Nakhaei, Irannajad, M., and Yousefikhoshbakht, 2016; Nakhaei, Irannajad, and Mohammadnejad, 2019).
Fundamentals of NNs can be found in Nakhaei et al., (2010; 2012). The multi-layer perception (MLP) is a type of feed forward NN that includes an input layer, one or more hidden layers, and an output layer. The structure of NNs comprise a set of processing elements, typically organized in layers, known as neurons. These neurons are connected to each other by synaptic weights. Connection weights are the coefficients of the NN and have to be adjusted in order to minimize the prediction errors.
The neurons in the MLP are trained using a backpropagation (BP) learning algorithm. In the forward stage the random weights are fixed as the signal is transmitted layer-by-layer through the network. In the backward stage, if the output layer cannot obtain the expected value, the connection weights of the hidden layer are modified before the output layer (Lorencin et al., 2020).
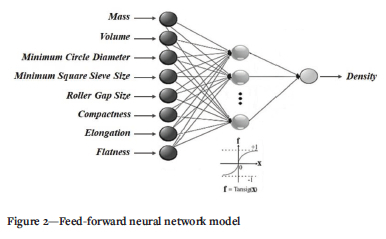
Apart from the input nodes, each node uses a nonlinear activation function. A three-layer NN was considered in this study for the density estimation, as shown in Figure 2. The aim of NN algorithm is to find the best density in terms of accuracy, authenticity, and expedition.
Initially, the input variables were inserted into the NN, and the proposed NN was trained based on the inputs and output data using a portion of the data called a training set. Then, to reveal the authenticity and practicality of the model, a comparison of the estimated values and desired values was performed on a test set. Seventy-five per cent of the data-set was used in the model training and the rest of the data-set was used in the testing stage for evaluating the model. The testing phase was conducted using the data that was not used in the training process.
Results and discussion
RhoVol repeatability and accuracy
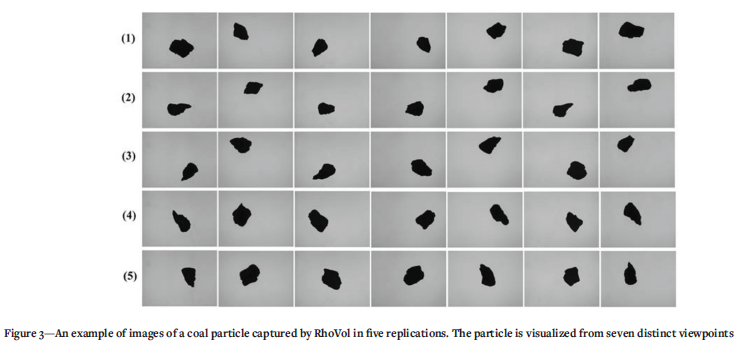
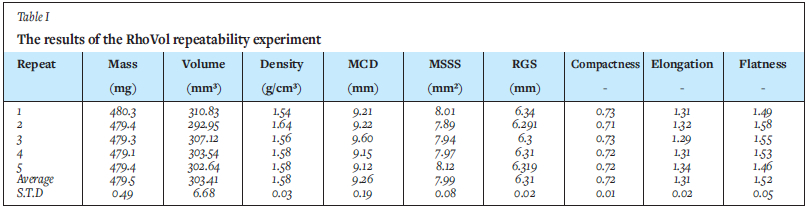
The accuracy and repeatability of the calculated coal density rely on the physical features of particle and the orientation of the particle within the RhoVol at the moment when the images are captured (Mangera, Morrison, and Voigt, 2016). Figure 3 shows seven distinct viewpoints of a coal particle captured by seven cameras in five replications. Measurements of the first to fifth runs are given in Table I. Repeatability indicates the error in successive measurements of a variable under identical operating conditions, and beyond certain limits the error is unacceptable. Repeatability is usually manifest as the standard deviation of the measured values. In this study, it is considered as instrumental error.
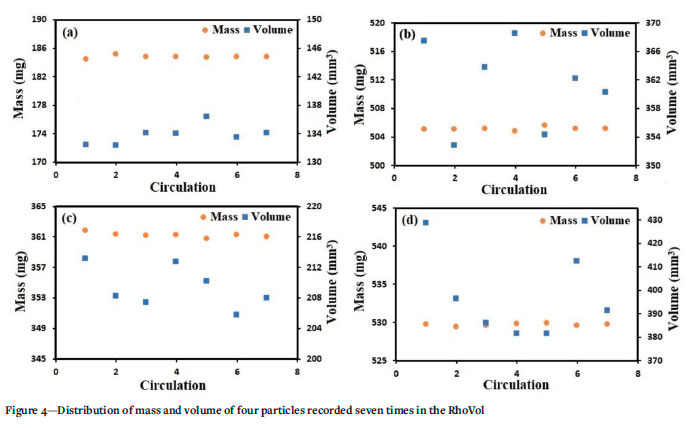
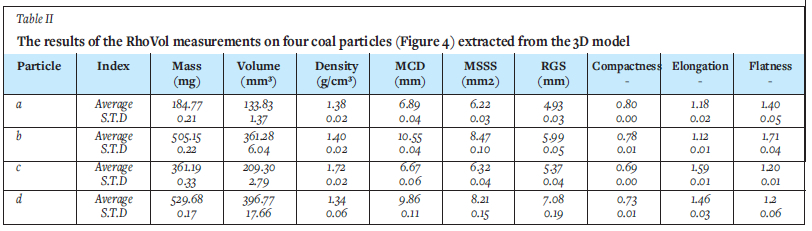
As a result, the appearance of the coal particle changes slightly depending on its orientation and position relative to the camera when the images are captured. All particles were imaged in the RhoVol seven times. The results for four types of coal particles are presented in Figure 4 and Table II.
The results show that the repeatability of the density (volume) estimation does not depend on the shape of the coal particle. For example, the volumes and densities of coals (c) and (d) with similar shape characteristics show different repeatabilities. However, for most of the coal particles, instrumental error (standard deviation) for density was less than 0.06 g/cm3. Since the sink and float tests were carried out in incremental steps of 0.05 g/cm3, the instrumental error can be considered small. In conclusion, instrumental error would not significantly affect the accuracy of the density measurement and it can be ignored.
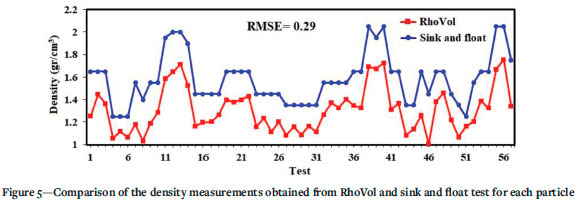
The heterogeneity errors (accuracy) for all 57 coal samples are shown in Figure 5. It can be observed that for most of the particles, the error accounted for over 20% of the measured value, indicating that the heterogeneity error has a significant impact on density measurement. The most important reason why the reliability of RhoVol in coal sorting application has been questioned is that the particle volume is estimated from the visual hull of the object. The shape measurements from the silhouette technique do not take into account hidden concavities of a particle, resulting in an overestimation of the particle volume. Moreover, it is impossible to capture the impact of porosity and cracks on the volume of coal samples obtained from 3D images. The difference between the RhoVol measurements and sink and float data is not necessarily constant over all particles (Botlhoko et al., 2021; 2022). This mismatch is termed the heterogeneity error in this paper. Thus, the calculation of accurate density values on the basis of 3D imaging systems requires a correction factor (CF) or other techniques that produce fully reliable models.
Error correction models
Linear regression
Although the RhoVol method is repeatable, it has been shown that there is a considerable difference between coal density measured by the RhoVol and the sink and float test results. A linear regression model for correction and estimation of the coal density is proposed here.
In practice, a linear regression model is applied to convert the RhoVol measurements to values close to the sink and float tests. The model is y = ax+b, where y is the true density of the target particle; x is the measured density by RhoVol; and a and b are model-fitted slope and intercept coefficients.
Figure 6 displays the correlation between the RhoVol densities (average of seven observations) and the densities by sink and float tests for coal particles. The high correlation coefficient of the model equation (R2 = 0.89) indicates the strong correlation between RhoVol and sink and float densities of the coal particles.
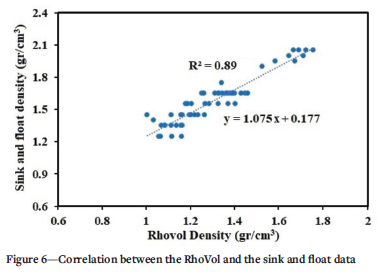
A linear correction factor was fitted using this data. For coal particles the correction function can be expressed as follows:

This equation was applied to the RhoVol results to estimate the density closeness to the sink and float test and to ensure that the output data is not erroneous.
The root mean square error (RMSE) is a standard index to compute the error of a model in forecasting data (Nakhaei et al., 2011). The RMS error for the density estimate was computed using the equation:
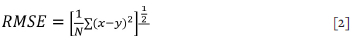
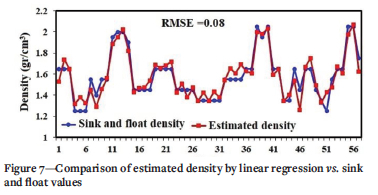
where x is the estimated density and y is the density on the basis of sink and float tests. The comparison between sink and float density and estimated density of the linear model is presented in Figure 7. The proposed model provides density estimates close to those obtained by the sink and float experiments (RMSE =0.08). Results show that the linear regression model provided improvements in the accuracy of density measurement and the estimated densities are sufficiently close to those from the sink and float test.
Neural network
As mentioned earlier, seven parameters, namely mass, volume, minimum circle diameter, minimum square sieve size, roller gap size, compactness, elongation, and flatness were considered as input parameters. The MLP was trained according to these parameters.
To find the best structure and parameters of the NN, numerous combinations of network geometry with different numbers of neurons in the hidden layer (NHL) and different values of learning coefficients during the training phase were analysed. The selected model was validated using 15 sets of experimental data.
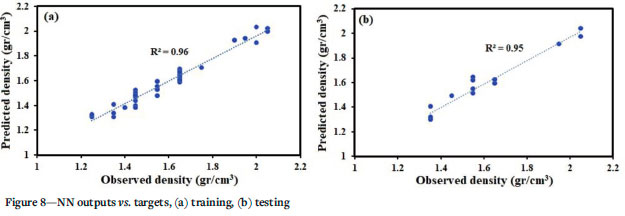
Since minor improvements did not justify increasing the complexity of the NN, the structure with NHL = 11 was selected. Figures 8 and 9 indicate the results of the NN training and testing processes.
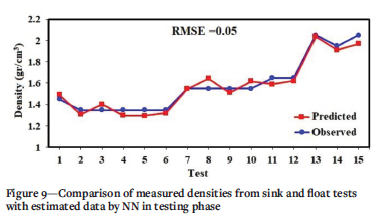
Figure 8 shows sink and float and predicted densities obtained in the NN testing stage on 15 data-sets that were not used for the training stage. Results of the testing process showed that the NN model provides a quite satisfactory approximation of density.
The density predictions made using an NN model seem to be more reliable than those made by the linear equation. Practically speaking, the RMSE value in the prediction by the regression model was greater than that in the NN model; therefore, the NN for predicting coal density is more effective than the regression method. The proposed NN model can be used to estimate the coal density with a reasonable error (RMSE = 0.05). The results of this study can be used as a soft sensor in RhoVol for estimation of coal density and washability curves.
Conclusion
The coal washability curves are usually determined using laboratory sink and float tests. The motivation of this study was to assess an alternative technique to sink and float tests due to the time-consuming process as well as the costly and toxic heavy liquids used. We presented a novel 3D imaging system (RhoVol) for measuring density of individual coal particles.
The coal particles (-8 +3 mm) were individually subjected to sink and float (1.2-2.1 g/cm3) and RhoVol experiments. The results showed that there are differences between sink and float test data and the RhoVol measurements. The shape-from-silhouette technique fails to record hidden concavities in a particle, resulting in a particle volume overestimation. Besides, it is impossible to consider the impact of porosity and cracks on the volume of coal particles obtained from 3D images. Therefore, linear regression and neural network models were used to correct the densities obtained by RhoVolso that they corrosponded to the sink and float test data. The results indicated that for prediction of coal densities, a BPNN model with RMSE of 0.05 g/cm3 perform better than the regression method.
It has been demonstrated that RhoVol, a non-destructive and non-toxic method, has the potential to be an alternative to traditional sink and float tests, provided that it is integrated with a NN model.
References
Botlhoko, S., Campbell, Q.P., le Roux, M., and Nakhaei, F. 2021. Application of RhoVol information for coal washability analysis. Proceedings of the Coal Processing Conference 2021, Secunda, South Africa. [ Links ]
Botlhoko, S., Campbell, Q.P., le Roux, M., and Nakhaei, F. 2022, Washability analysis of coal using RhoVol: a novel 3d image-based method. Mineral Processing and Extractive Metallurgy Review. https://doi:10.1080/08827508.2022.2027769 [ Links ]
Callen, A.M., Patel, B., Zhou, J., and Galvin, K.P. 2008. Development of water-based methods for determining coal washability data. International Journal of Coal Preparation and Utilization, vol. 28. no. 1. pp. 33-50. [ Links ]
Campbell, Q.P., le Roux, M., and Nakhaei, F. 2021a. Coal moisture variations in response to rainfall event in mines and coal-fired power plant stockpiles-Part 1: Runoff, infiltration, and drainage. Minerals, vol. 11. p. 1365. [ Links ]
Campbell, Q.P., le Roux, M., and Nakhaei, F. 2021b. Influence of rainfall events on coal moisture content in mine stockpiles. International Journal of Coal Preparation and Utilization, 2021. https://doi:10.1080/19392699.2021.2011724 [ Links ]
Fofana M. and Steyn, T. 2019. Monitoring the performance of DMS circuits using RhoVol technology. Journal of the Southern African Institute of Mining and Metallurgy, vol. 119. no. 2. pp. 133-125. [ Links ]
Forbes, K., Voigt, A., and Bodika, N. 2003. Using silhouette consistency constraints to build 3D models. Proceedings of the Fourteenth Annual Symposium of the Pattern Recognition Association of South Africa (PRASA 2003). South African Institute of Electrical Engineering. pp. 33-38. [ Links ]
Forbes, K., Nicolls, F., Dejager, G., and Voigt, A. 2006. Shape-from-silhouette with two mirrors and an uncalibrated camera. Proceedings of the 9th European Conference on Computer Vision (ECCV2006), Graz, Austria, 7-13 May, 2006. Springer. pp. 165-178. [ Links ]
Forbes, K. 2007. Calibration, recognition, and shape from silhouettes of stones, PhD dissertation, University of Cape Town, South Africa. [ Links ]
Korkmaz, A. and Bentli, A. 2017. Determination of washability characteristics of Arguvan- Malatya lignite by different washability index methods. Energy Sources, Part A: Recovery, Utilization, and Environmental Effects, vol. 39, no. 14. pp. 1572-1580. [ Links ]
Laurentini, A. 1994. The visual hull concept for silhouette-based image understanding. IEEE Transactions on Pattern Analysis and Machine Intelligence, vol. 16, no. 2. pp. 150-162. [ Links ]
Liu, J. and Lu, M.X. 1998. Predicting the washability of raw coal from its total ash content. Proceedings of the XIII International Coal Preparation Congress. Brisbane, Australia. Volume II. Australian Coal Preparation Society. [ Links ]
Lorencin, I., Anbelic, N., Spanjol, J., and Car, Z. 2020. Using multi-layer perceptron with Laplacian edge detector for bladder cancer diagnosis. Artificial Intelligence in Medicine, vol. 102. 101746. [ Links ]
Lu, M.X. 1990. Computer application in coal preparation industry in China. Proceedings of the XXII International APCOM Symposium. Technische Universität Berlin, Berlin. [ Links ]
Mangera, R., Morrison, G., and Voigt, A.P. 2016. Particle volume correction using shape features. Proceedings of the Pattern Recognition Association of South Africa and Robotics and Mechatronics International Conference (PRASA-RobMech). pp. 1-6. [ Links ]
Nakhaei, F., Sam, A., Mohammadi, M.A., and Mosavi, M.R. 2011. Application of neural network technique for metallurgical performance prediction of flotation column (case study: Sarcheshmeh Copper Pilot Plant). Proceedings of the 1st Copper World Congress, Tehran, Iran, October 2011. [ Links ]
Nakhaei, F., Sam, A., Mosavi, M.R., and Zeidabadi, S. 2010. Prediction of copper grade at flotation column concentrate using artificial neural network. Proceedings of the IEEE 10th International Conference on Signal Processing, IEEE, New York. pp. 1421-1424. [ Links ]
Nakhaei, F., Hajizadehomran, A. Irannajad, M., and Mohammadnejad, S. 2018. Relationship between froth behavior and operating parameters of flotation column. Proceedings of the XXIX International Mineral Processing Congress (IMPC 2018), Moscow, Russia. [ Links ]
Nakhaei, F., Irannajad, M., and Yousefikhoshbakht, M. 2016. Flotation column performance optimisation based on imperialist competitive algorithm. International Journal of Mining and Mineral Engineering, vol. 7, no. 1. pp. 1-17. [ Links ]
Nakhaei, F., Irannajad, M., and Mohammadnejad, S. 2019. Column flotation performance prediction: PCA, ANN and image analysis-based approaches. Physicochemical Problems of Mineral Processing, vol. 55, vol. 5. pp. 1298-1310. [ Links ]
Nakhaei, F., Mosavi, M.R., Sam, A., and Vaghei, Y. 2012. Recovery and grade accurate prediction of pilot plant flotation column concentrate: Neural network and statistical techniques. International Journal of Mineral Processing, vol. 110-111. pp. 140-154. [ Links ]
Nakhaei, F. and Irannajad, M. 2012. Design of neural network using genetic algorithm for recovery and grade prediction of pilot plant flotation column concentrate. Proceedings of the 2th Mining Industries Conference, Shahid Bahonar Kerman University, Iran. [ Links ]
Nakhaei, F., Irannajad, M., and Mohammadnejad, S. 2019. A comprehensive review of froth surface monitoring as an aid for grade and recovery prediction of flotation process. Part A: structural features. Energy Sources, Part A: Recovery, Utilization, and Environmental Effects. https://doi:10.1080/15567036.2019.1663313 [ Links ]
Nakhaei, F. 2021. Performance recognition of column flotation process using K-means clustering algorithm based on froth image analysis. Proceedings of the 5th Young Professionals Online Conference, 20-22 September 2021. Southern African Institute of Mining and Metallurgy, Johannesburg. [ Links ]
Polakowski, C., Ryzak, M., Sochan, A., Beczek, M., Mazur, R., and Bieganowski, A. 2021. Particle size distribution of various soil materials measured by laser diffraction. The problem of reproducibility. Minerals, vol. 11. p. 465. [ Links ]
Roux, L. 2021. Density - A contentious issue in the evaluation and determination of Resources and Reserves in coal deposits. Journal of the Southern African Institute of Mining and Metallurgy, vol. 121, no. 5. pp. 227-250. [ Links ]
Wang, Z.C. and Lu, M.X. 2002. On-line forecast of raw coal washability curves. Mining Science and Technology, vol. 99. pp. 485-488. [ Links ]
Ze-Lin, Z., Jian-guo, Y., Yu-ling, W., Wen-Cheng, X., and Xiang-yang, L. 2011. A study on fast predicting the washability curve of coal. Procedia Environmental Sciences, Part C, no. 11. pp. 1580-1584. [ Links ]
Zhang, Q., Tian, Y.Z., Qiu, Y.Q., Cao, J.X., and Xiao, T.C. 2011. Study on the washability of the Kaitai coal, Guizhou province China. Fuel Processing Technology, vol. 92. pp. 692-698. [ Links ]
Zhang, Y.R., Yoon, N., and Holuszko, M.E. 2021. Assessment of coal sortability and washability using dual energy X-ray transmission system. International Journal of Coal Preparation and Utilization. https://doi:10.1080/19392699.2021.1914024 [ Links ]
 Correspondence:
F. Nakhaei
Email: 36598704@nwu.ac.za
Received: 26 Jan. 2022
Revised: 21 Jun. 2022
Accepted: 13 Jun. 2022
Published: August 2022

