


Services on Demand
Article
 English (pdf)
 Article in xml format
 Article references
Indicators

Related links
-
 Cited by Google
 -
 Similars in Google
Share

 Permalink
Journal of the Southern African Institute of Mining and Metallurgy
On-line version ISSN 2411-9717
Print version ISSN 2225-6253
J. S. Afr. Inst. Min. Metall. vol.122 n.7 Johannesburg Jul. 2022
http://dx.doi.org/10.17159/2411-9717/1989/2022
PROFESSIONAL TECHNICAL AND SCIENTIFIC PAPERS
Economic analysis of rare earth element processing methods for Mountain Pass ore
T. Uysal
Rare Earth Elements Application and Research Center, Munzur University, Tunceli, Turkiye. https://orcid.org/0000-0003-1643-6725
SYNOPSIS
The increasing demand for rare earth elements (REE) in highly strategic sectors such as hybrid electric vehicles, renewable energy, communication technologies, and the defense industry has made REE production methods important. In recent years, studies on REE have increased rapidly; however there are many studies on REE, there are not enough studies in the literature on the economics of the beneficiation process. RE ores are generally leached after beneficiation by gravity, magnetic and flotation methods. In this study, direct leaching, attrition scrubbing and leaching, and flotation and leaching methods are evaluated economically based on the data for the Mountain Pass (MP) facility. According to the sensitivity analysis performed as a function of capital cost (CAPEX), operating cost (OPEX), and rare earths oxides (REO) recovery, REO recovery has the biggest effect on the process economies. Although the flotation method entails additional investment and operating costs, transportation and operating costs are significantly reduced result of the higher grade and recovery. The flotation method is more profitable, with larger NPV and IRR values and a shorter payback period.
Keywords: economic analysis, rare earth elements, flotation, attrition scrubbing.
Introduction
The rare earth elements lanthanide group includes 17 elements consisting of scandium and yttrium. Rare earth elements, with their light emission, magnetism, and electronic properties resulting from their unsaturated 4f electronic structure, are used in the production of permanent magnets, the production of rare earth phosphors, in hydrogen storage materials and in the production of catalysts. In addition, owing to their different chemical, metallurgical, optical, electrical, and catalytic properties, the REE have different uses in high-technology industries such as, hybrid electric vehicles, rechargeable batteries, mobile phones, wind turbines, medical imaging devices, radar systems, catalytic converters, metal alloys, aircraft engines, ceramics, and defense (Adibi et al., 2014; Dushyanthaa et al., 2020; Suli et al., 2017).
Although the REEs are included in more than 250 discrete minerals, 95% of commercial production from bastnasite [Ce, La, Nd](CO3)F, monazite [Ce, La, Nd](PO4), and xenotime (YPO4) ores. The most important REE producers are China and the USA. It is estimated that China produced 132 000 t rare earths oxides (REO) in 2019, while the USA produced 26 000 t (REO equivalent) of ores and compounds. The estimated global total REO production is 210,000 metric tons (USGS, 2020). China imposed export restrictions on REE between 2010 and 2014, resulting in dramatic increases in REE prices in those years. These high prices accelerated exploration for new deposit on a global scale and increased the number of active REE facilities (Laurent, 2014).
Bayan Obo (China) and Mountain Pass (USA) are the world's largest REE deposits. The Mountain Pass (California, USA) deposit, the second largest REE deposit in the world, is operated by MP Materials. In this deposit, the main REE minerals are bastnasite and monazite, and gangue minerals are barite, calcite, silicate, apatite, and dolomite (Abaka-Wood, Addai-Mensah, and Skinner, 2016; Yang et al., 2015).
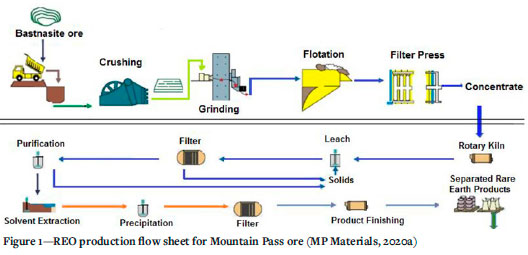
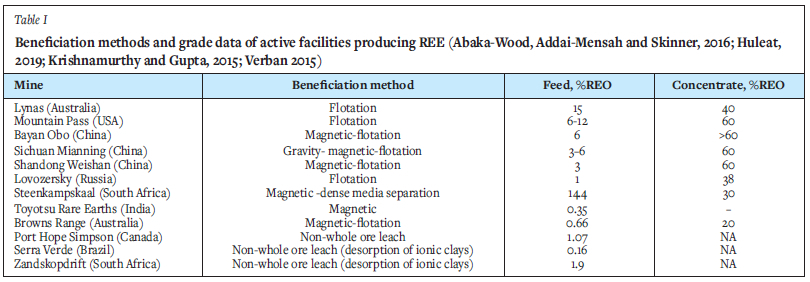
REE ores are beneficiated by physical and/or chemical (leaching) methods. Physical REE beneficiation methods are gravity, magnetic, electrostatic, and flotation, or combinations of these methods (Jordens, Cheng, and Waters, 2013; Zhang and Edwards, 2012). Gravity beneficiation is widely used for the separation of REE minerals with relatively high densities (4-7 g/cm3) and gangue minerals with low specific gravity such as quartz, calcite and fluorite (Ferron, Bulatovic and Salter, 1991). In the attrition scrubbing method, the different resistance of the minerals to abrasion leads to a significant upgrading in the coarse or fine sizes. Pre-concentrate or concentrate is obtained by size classification of the attrition scrubbing product. Flotation vital in the beneficiation of low-grade and complex ores, which were previously uneconomic to mine and process (Wills, 2006). As the particle size decreases, beneficiation by gravity methods becomes more difficult and mineral losses increase. For this reason, flotation is used to beneficiated the minerals that are liberated between 100 μm and 15 μm. For selective flotation, the surfaces of REE minerals are rendered hydrophobic, while the gangue minerals are coated with depressants to increase surface hydrophilicity (Jordens, Cheng, and Waters, 2013). Beneficiation methods and feed and concentrate grades of active facilities producing REE are given in Table I. MP ore is beneficiated by flotation and leaching method, and the flow sheet of the facility is depicted in Figure 1.
In the chemical beneficiation methods, raw ore and/or concentrate is leached with acidic or alkaline solutions. The pregnant leach solution is generally purified by solvent extraction (SX) and precipitation methods, and REO are obtained by calcining the purified product (Demol et al., 2019; Qi, 2018; Wang et al., 2017).
Direct leaching of the ore avoids beneficiation methods such as gravity and flotation will be eliminated, thus reducing the cost. However, direct leaching of raw ore will increase reagent, and transportation costs, and valuable mineral losses, while reducing the efficiency of chemical beneficiation. In this case, preconcentration by physical beneficiation becomes necessary both technically and economically. The main purpose of this study is to assess the economic importance of beneficiation and the selection of the economic beneficiation method. Direct leaching, attrition scrubbing, leaching, and flotation and leaching were investigated economically. Attrition scrubbing method is given as an example because it is generally used in the pre-beneficiation of minerals with different abrasion resistances. The profitability of these beneficiation methods was evaluated together with the economic analysis.
Materials and methods
Crushing, grinding, classification, and attrition scrubbing methods are used to obtain pre-concentrate from the raw ore. Crushing, grinding, classification and flotation are used to obtain concentrate from raw ore. The data is based on data from the MP facility and published (preliminary) feasibility studies. In the absence of data on individual items, reasonable assumptions have been made using information from similar studies in the literature.
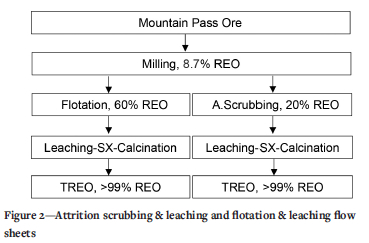
According to the report published by MP Materials, (2020a), MP raw ore with 8.7% REO content is upgraded to an average REO grade of 60% by flotation. Since attrition scrubbing is not applied to the MP ore, an assumption was made based on attrition scrubbing of carbonatite ore similar to this deposit. According to Noble et al. (2014) Bear Lodge REE ore was upgraded to 19.0620.51% TREO (total REO) with 60-90% recovery in the -500 mesh size. Similarly, Ozbayoglu and Atalay (1995) state that Eskisehir (Turkey) REE ore reached a grade of 23.5% REO as a result of beneficiation by attrition scrubbing. Based on these results, it is assumed that MP ore can be upgrade to 20% REO by attrition scrubbing. The flow sheets for attrition scrubbing and leaching and flotation and leaching for REO production are given in Figure 2. The production and beneficiation data for the years 2018-2020 are given in Table II.
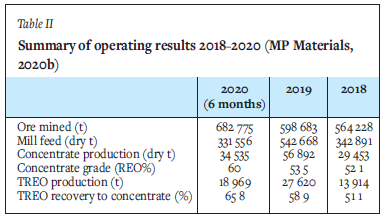
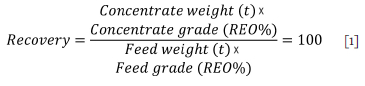
According to MP Materials (2020b), the overall flotation recovery was 72%, calculated by the formula given in Equation [1]. The attrition scrubbing recovery is assumed to be lower than flotation recovery and it was taken as being 62% after evaluating the literature data (Noble et al, 2014). The ore beneficiation and chemical beneficiation losses, which are not included in the literature or published reports, are also assumed to be approximate. Accordingly, the ore beneficiation losses are taken as 10%, the chemical beneficiation loss of the raw ore is 10%, and the chemical beneficiation loss of the concentrate is 5%.
Cost and revenue analysis
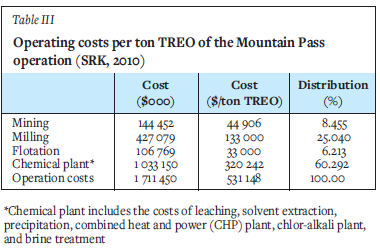
In the cost analysis, CAPEX and OPEX were determined separately. CAPEX inputs mainly include machinery and equipment, installation, piping, instrumentation, engineering, construction, and contingency costs. For CAPEX, data from Williams (2018) was used. The investment cost for the chemical plant is taken as 60% of that of the physical beneficiation plant. OPEX inputs are mainly reagents, energy, transportation and labour costs. These costs are given on the basis of the current reports and are included in the facility costs. The operating costs per ton TREO for the Mountain Pass operation are given in Table III, and the key performance indicators in Table IV.
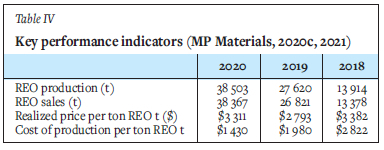
As seen in Table IV, the operating cost per ton REO in 2020 was $1 430. Operating cost per ton in the REO metric excludes costs attributable to selling obsolete stocks, shipping, freight, and depreciation. It has been added to OPEX costs as a separate item since shipping cost is not included. In this study, the transportation cost of raw ore and concentrate was taken as $8 per ton, based on the average cost in the mining industry (Sterba et al., 2019).
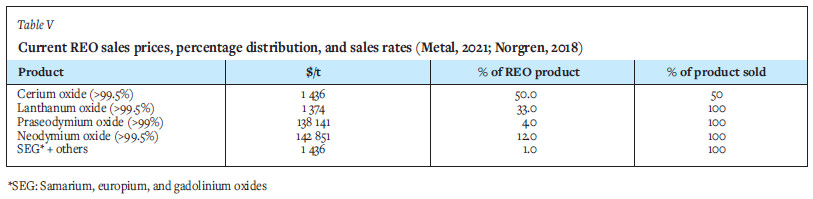
The data from Norgren ( 2018) wase used for income analysis. Current sales prices, percentage distribution ratios and sales percentages of REOs produced from MP ore are shown in Table V. Income was calculated based on these figures and prices.
Economic analysis
Different static and dynamic capital budgeting methods and a combination of these methods are applied to compare the profitability of projects. The first method is the payback period, a static method. This is a simple method often used for initial estimation, but does not provide an adequate basis for deciding between different investment projects. The second method is net present value (NPV) and internal rate of return (IRR), the most common dynamic capital budgeting method, for more detailed analysis. The NPV method is used to decide which project will be most profitable from an investor's point of view, as the IRR method alone is not always suitable for making the right investment decisions (Jaroni, Friedrich, and Letmathe, 2019). In this study, NPV, IRR, and payback period values were calculated and evaluated together.
Sensitivity analysis is a risk analysis technique that measures the extent to which NPV changes as a result of changes in the key variables that can affect the NPV of the project. In this context, sensitivity analysis is used to identify and estimate potential risk in project efficiency. It is used to estimate the effects of variables on NPV rather than finding the risk value. The greater the change in NPV, the greater the risk. Sensitivity analysis provides important information about which inputs have the greatest impact on the project. In this study, the changes in NPV as a function of CAPEX, OPEX, and REO recovery were investigated.
Results and discussion
Cost and revenue analysis
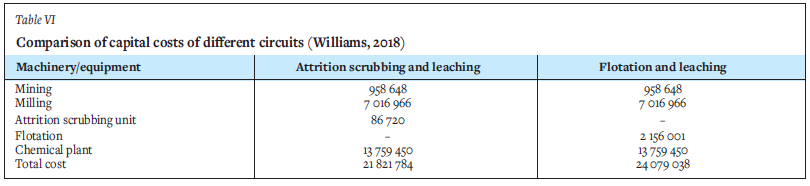
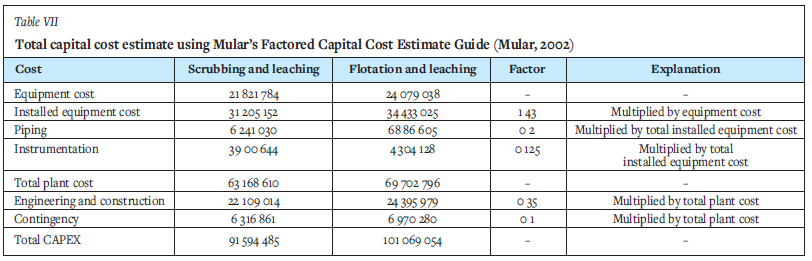
CAPEX and OPEX values for Attrition Scrubbing & Leaching and flotation & leaching circuits were determined. The investment costs for both circuits are compared in Table VI, and the estimated total investment cost using the Mular factor is given in Table VII.
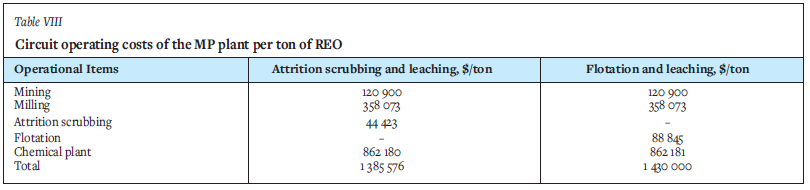
According to Table VII, capital costs are calculated as $91 594 485 for Attrition scrubbing & leaching and $101 069 054 for flotation & leaching. The operating cost is calculated by adapting the percentage cost rates of each input in the SRK (2010) report to the REO operating cost (1 430 $/per ton) in the MP (2020) report and is given in Table VIII. Since the operating cost of attrition scrubbing is unknown, it is assumed that it will be half of the flotation cost.
The operating cost of the flotation and leaching circuit is $44 423 higher per ton raw ore than that of the attrition scrubbing and leaching circuit. The 10-year operating cost calculation, is based on the data in Table VIII.
Economic analysis
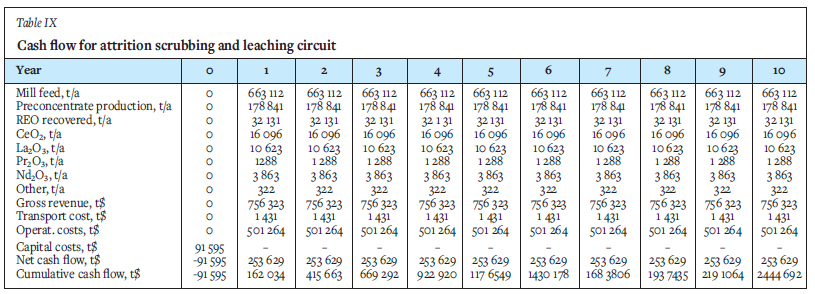
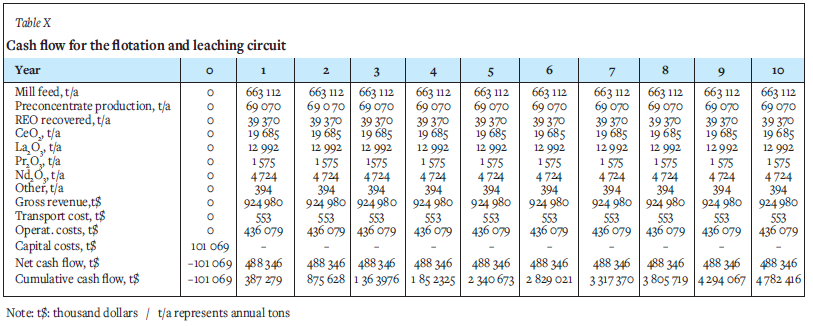
The 10-year pre-tax cash flow models the two circuits are shown in Table IX and Table X. No acceleration period is included in this analysis, although it is likely to exist in practice. NPV, IRR, and payback periods were calculated using the information in Tables IX and X. These values are shown in Table XI, assuming a discount rate of 8%.
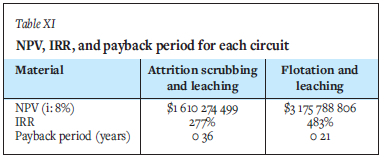
Table XI shows that the NPV and IRR values of the flotation & leaching circuit are greater and the payback period is lower. The difference between the NPVs was found to be $1 565 498 542 and it is clearly seen that the flotation & leaching circuit is more profitable from these values. Economic analysis of the direct leaching circuit revealed that the NPV value is -$365 019 511. This is not an economical method and physical beneficiation is required for this ore. Sensitivity analyses as a function of CAPEX, OPEX, and REO recovery for both circuits are given in Figures 3 and 4.
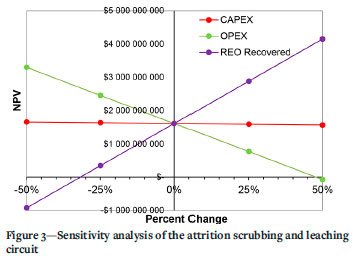
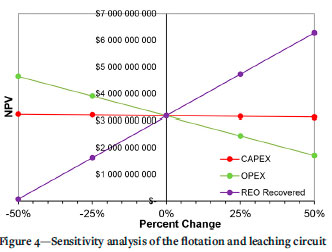
Figurs 3 and 4 show that for both circuits NPV is most sensitive to the total REO recovery. The most important parameters affecting the total REO recovery are the REO grade and recovery. In both beneficiation circuits, OPEX was severely affected, while CAPEX showed no significant effect. In addition, it was determined that NPV increased linearly as the REO recovered increased for both circuits, and decreased linearly as OPEX amount increased. In the attrition scrubbing and leaching circuit, the REO recovery amount is below -32%, while the NPV is negative. The NPV for the flotation and leaching circuit is positive at all rates of change. From this, it was determined that the attrition scrubbing and leaching circuit is more affected by the REO recovery and OPEX value.
Conclusions
An economic analysis was carried out on attrition scrubbing and leaching and flotation and leaching circuits used in the beneficiation of REE ores. It was found that the NPV and IRR values for the flotation and leaching circuit were higher and the payback period was lower. Accordingly, the flotation and leaching circuit is the more profitable investment. Sensitivity analyses as a function of CAPEX, OPEX, and REO recovery were also performed. Iit was determined that while REO recovery amount and OPEX were seriously affected in both circuits, CAPEX did not show a significant effect. The sensitivity analysis indicated that the biggest effect was due to the amount of REO recovery, and this value was significantly affected by the REO grade and recovery values.
Acknowledgement
The authors are thankful to the authorities of Munzur University Rare Earth Elements Application and Research Center (MUNTEAM) for the encouragement to prepare this research article.
References
Abaka-Wood, G.B., Addai-Mensah, J., and Skinner, W. 2016. Review of flotation and physical separation of rare earth element minerals. Proceedings of the 4th UMaT Biennial International Mining and Mineral Conference, Tarkwa Ghana. https://www.academia.edu/29740349/revier_of_flotation_and_physical_separation_of_rare_earths_element_minetals [ Links ]
Adibi, N., Lafhaj, Z., Gemechu, E.D., Sonnemann, G., and Payet, J. 2014, Introducing a multicriteria indicator to better evaluate impacts of rare earth materials production and consumption in life cycle assessment. Journal of Rare Earths, vol. 32, no. 3. pp. 288-292. [ Links ]
Demol, J., Ho, E., Soldenhoff, K., and Senanayake, G. 2019. The sulfuric acid bake and leach route for processing of rare earth ores and concentrates: A review. Hydrometallurgy, vol. 188. pp. 123-139. https://doi.org/io.ioi6/j.hydromet.2019.05.015 [ Links ]
DUSHYANTHA, N., BATAPOLA, N., ILANKOON, I., ROHITHA, S., PREMASIRI, R., Abeysinghe, B., and Dissanayake, K. 2020. The story of rare earth elements (REEs): Occurrences, global distribution, genesis, geology, mineralogy and global production. Ore Geology Reviews, vol. 122. pp. 1-17. [ Links ]
Ferron, C.J., Bulatovic, S.M., and Salter, R.S. 1991. Beneficiation of rare earth oxide minerals. Prince Songkla University pp. 251-269. https://www.scientific.net/MSF.70-72.251https://www.sec.gov/Archives/edgar/data/1489137/000095012310065239/d74323fwfwp.htm [accessed July 2021]. [ Links ]
Huleatt, M.B. 2019. Australian resource reviews: Rare earth elements. Geoscience Australia, Canberra. http://dx.doi.org/10.11636/9781925848441 [ Links ]
Jaroni, M.S., Friedrich, B., and Letmathe, P. 2019. Economical feasibility of rare earth mining outside China. Minerals, vol. 9. p. 576. doi:10.3390/min9100576 [ Links ]
Jordens, A., Cheng, Y.P., and Waters, K.E. 2013. A review of the beneficiation of rare earth element bearing minerals. Minerals Engineering, vol. 41. pp. 97-114. https://doi.org/10.1016/j.mineng.2012.10.017. [ Links ]
Krishnamurthy, N. and Gupta, C.K. 2015. Extractive Metallurgy of Rare Earths. Taylor&Francis, Boca Raton, FL. 848 pp. [ Links ]
Laurent, A. 2014. Commodities at a glance: Special issue on rare earths http://unctad.org/en/PublicationsLibrary/suc2014d1_en.pdf [accessed 29 December 2021]. [ Links ]
Metal. 2021. Rare earth oxides https://www.metal.com/Rare-Earth-Oxides [accessed 29 December 2021]. [ Links ]
MP Materials. 2020a. Powering process. Investing in America's next generation supply chain, July, 15. https://mpmaterials.com/uploads/2020.07%20MP%20MaterialsX20TransactionX20Deck.PDF [accessed 27 December 2021]. [ Links ]
MP Materials. 2020b. Prospectus, Filed Pursuant to Rule 424(b)(3), Registration No. 333-251239. [ Links ]
MP Materials. 2021a. Annual Reports, 10-K, March 22. https://d18rn0p25nwr6d.cloudfront.net/CIK-0001801368/7c83b453-4580-4c19-935a-5d198af27e58.pdf [accessed 27 December 2021]. [ Links ]
MP Materials. 2020c. Annual Reports, 8-K, November 23, https://www.sec.gov/Archives/edgar/data/1801368/000114036121015592/nt10023881x1_424b3.htm [accessed 29 December 2021]. [ Links ]
Mular, U.A. 2002. Major mineral processing equipment costs and preliminary capital cost estimations. Mineral Processing Plant Design, Practice, and Control. Society for Mining, Metallurgy and Exploration, Englewood.co. pp. 310-326. [ Links ]
Noble, A.C., Jaye, T.P.E., Pickarts, P.E., and Richard, K.L. 2014. Technical report on the mineral reserves and resources and development of the Bull Hill mine, Wyoming. Canadian National Instrument. pp. 43-101. October 9th. http://www.rareelementresources.com/App_Themes/NI43101PreFeasibilityStudyReport/HTML/files/assets/common/downloads/publication.pdf [accessed 18 Jully 2022]. [ Links ]
Norgren, A. 2018. Ultra-fine gravity separation of rare earth minerals. MSc thesis, Colorado School of Mines, Golden, co. [ Links ]
Õzbayoglu, G. and Atalay, U.M. 2000. Beneficiation of bastnasite by a multi-gravity separator. Journal of Alloys and Compounds, vol. 303-304. pp. 520-523. https://doi.org/10.1016/S0925-8388(00)00639-3 [ Links ]
Qi, D. 2018. Extraction of rare earths from RE concentrates. Hydrometallurgy of Rare Earths. 1stedn. pp. 1-185. Elsevier, Cambridge. [ Links ]
SRK Consulting. 2010. Engineering study for the re-start of the Mountain Pass rare earth element mine and processing facility, Mountain Pass, California (U.S.A). [ Links ]
Sterba, J., Krzemien, A., Riesgo, ER, Escanciano García-Miranda, C., Fidalgo, and Valverde, G. 2019. Lithium mining: Accelerating the transition to sustainable energy. Resources Policy, vol. 62. pp. 416-426. https://doi.org/10.1016/j.resourpol.2019.05.002 [ Links ]
Suli, L.M, Ibrahim, W.H.W., Aziz, B.A, Deraman, M.R., and Ismail, N.A. 2017. A review of rare earth mineral processing technology. Chemical Engineering Research Bulletin, vol. 19. pp. 20-35. https://doi.org/10.3329/cerb.v19i0.33773 [ Links ]
USGS. 2020. Rare earths. US Geological Survey, Mineral Commodity Summaries. pp. 132-133. https://pubs.usgs.gov/periodicals/mcs2020/mcs2020-rare-earths.pdf [accessed 14 June 2021]. [ Links ]
Verbaan, N., Bradley, K., Brown, J., and Mackie, S. 2015. A review of hydrometallurgical flow sheets considered in current REE projects. Proceedings of the Symposium on Critical and Strategic Materials. [ Links ]
Wang, L., Huang, X., Yu, Y., Zhao, L., Wang, C., Feng, Z., Cui, D., and Long, Z. 2017. Towards cleaner production of rare earth elements from bastnaesite in China. Journal of Cleaner Production, vol. 165. pp. 231-242. https://doi.org/10.1016/j.jclepro.2017.07.107 [ Links ]
Williams, N. 2018. Bastnasite beneficiation by froth flotation and gravity separation. MSc Thesis Colorado School of Mines, co. [ Links ]
Wills, B.A. 2006. Wills' mineral processing technology. Elsevier Science & Technology, Oxford. [ Links ]
Yang, X., Satur, J.V., Sanematsu, K., Laukkanen, J., and Saastamoinen, T. 2015. Beneficiation studies of a complex REE ore. Minerals Engineering, vol. 71. pp. 55-64. https://doi.org/10.1016/j.mineng.2014.10.005 [ Links ]
Zhang, J. and Edwards, C. 2012. A review of rare earth mineral processing technology. Proceedings of the 44th Annual Meeting of the Canadian Mineral Processors, Ottawa, CIM, Montreal. pp. 79-102. https://www.gbv.de/dms/tib-ub-hannover/715544179.pdf [accessed 18 Jully 2022]. [ Links ]
 Correspondence:
T. Uysal
Email: turan.uysal@inonu.edu.tr
Received: 18 Jan. 2020
Revised: 1 Apr. 2022
Accepted: 3 Jun. 2022
Published: July 2022

