


Servicios Personalizados
Articulo
 Inglés (pdf)
 Articulo en XML
 Referencias del artículo
Indicadores

Links relacionados
-
 Citado por Google
 -
 Similares en Google
Compartir

 Permalink
Journal of the Southern African Institute of Mining and Metallurgy
versión On-line ISSN 2411-9717
versión impresa ISSN 2225-6253
J. S. Afr. Inst. Min. Metall. vol.122 no.7 Johannesburg jul. 2022
http://dx.doi.org/10.17159/2411-9717/1245/2022
PROFESSIONAL TECHNICAL AND SCIENTIFIC PAPERS
A review of readiness assessments for mining projects
H. Mulder; M.C. Bekker
Graduate School of Technology Management, University of Pretoria, South Africa. M.C. Bekker: https://orcid.org/0000-0002-4837-2677
SYNOPSIS
The objective of this paper is to describe the research followed in creating a generalized, readiness assessment tool for mining projects. We start by highlighting the need for the assessment tool and then progress towards explaining the methodology followed during the study. The selection and finalization of the list of elements, sections, and categories that make up the unweighted values are described, followed by a summary of the weighting process applied. The outcome of this process is a weighted readiness assessment tool for mining project studies. The main benefits of the tool are that it will guide decision-makers and project managers through the definition phases of the project and improve the likelihood of project success.
Keywords: project readiness, mining projects, front-end planning, project evaluation, project assessment.
Introduction
The mining industry contributes approximately 11.5% to the global gross domestic product (GDP). When the mining service industry (which include construction, fuel, and fertilizer production) is included, the total contribution to the global GDP is 45% (Creamer, 2012). The contribution of mining in low-and middle-income countries towards foreign direct investment, exports, government revenue, gross domestic production and employment is depicted in Table I.
Figure 1 shows the growth in mining production since 1995, together with the growth of revenue contributed to governments in the form of mineral rents over the same period, along with minerals exports.

Ericsson and Lof (2018, p. 226), while examining the contribution of mining in various nations, found that in the Democratic Republic of the Congo (DRC), mining made up as much as 86% of total exports and constituted 12% of GDP. Carvalho (2018, p. 62) noted that production of mined ore increased by a factor of 27 during the 20th century.
The top 40 mining companies had revenues of US$642 billion in 2018 and paid US$31 billion in direct taxes (PWC, 2018). This grew to US $ 683 billion and US $ 33 billion in 2019 respectively (PWC, 2019, p. 9). Mining companies distributed around 22% of their revenue to employees, 23% to capital, and 21% to governments. It is noted that mining firms pay a bigger portion of their income to governments than most other industries, as they pay direct and indirect taxes, as well as substantial royalties. The introduction of carbon taxes and emission trading schemes have further contributed to the higher contribution of mining firms to the national fiscus. Addison and Roe (2018, p. 15) found that investment in the mining industry was expected to increase relative to historical averages, which would lead to an even higher dependency on the extractive in industries middle- and low-income countries. McKinsey (2020) predicts capital expenditure in the mining will grow from a low of less than US$1 trillion per year in 2018, to in excess of US$1.5 trillion in 2026.
Despite the significant role which mining plays in the global economy and the large amounts of capital spent in the industry, the success rate of mining projects remains low. Only 2.5% of large capital mining projects are considered successful when evaluated on scope, schedule, cost, and business benefits (Motta, et al., 2014, p. 402). More than 80% of mining projects are over budget and behind schedule by an average of 43%. (McKinley, 2017). Since 1965, cost overruns on mining projects averaged between 20% and 60% (Mining Markets Magazine, 2014). There are numerous examples of mining projects that have underperformed, with many failing to reach the intended outcome.
The mining industry poses some unique challenges as far as projects are concerned. Accenture (2012) found that the scale and complexity of mining projects, which are often multi-billion-dollar investments, often lead to budget and schedule overruns. They also found that insufficient detail during the planning stage was the third most significant contributor to project delays, behind the availability of skills and unconsidered regulatory requirements. Jamasmie (2012, p. 1) observed that according to 31 executives responsible for global mining projects, only a third of the projects were completed within 25% of the approved budget, and less than 20% within 10% of the approved budget. In total 42% of respondents regarded insufficient definition during the study of the project as the main reason for the overruns.
Ernst and Young (2020) list various risks faced by mining project, including failure to gain a social licence to operate, increasing complexities in mining, and additional needs for innovative approaches due to remote locations, declining ore grades, and access to and cost of energy and infrastructure. McKinsey (2017) adds that commodity prices are low and volatile, and that there is less room for error than in the past, as margins are slim. Schneider (2017) lists various factors that contribute to mining project failures, such as protests by the local population over pollution, concerns regarding sustainable water supplies, and other environmental problems.
McCarthy (2020) notes some contributors to project failure in mining. These include:
> Higher capital cost than anticipated
> Operating cost that exceeds expectations
> Lower recovery grade than predicted
> Less revenue from sales than anticipated during the front-end loading phase
> Longer construction and ramp-up periods than anticipated.
According to McCarty (2020) 25% of mining projects fail. Some of the most common reasons for project failure include:
> Underestimating the ramp-up duration
> Overestimating production schedules
> Incorrect resource and reserve estimates
> Inadequate understanding of the orebody
> Failure to identify contaminants in the deposit
> Not understanding the composition of process water chemistry.
These misunderstandings are attributed to insufficient time, budget, and skilled personnel allocated during the front-end loading phases of the project, as well as human factors, which include 'prescient CEO syndrome' - the CEO has already announced the project, therefore it must be feasible. Other human factors include pressure on engineering, procurement, construction, and management (EPCM) firms to 'make' the project viable in order to secure work during the construction phase and the nature of project employment contracts and bonusses, which means that executives and project managers receive payments and have moved on from the organization by the time a project fails.
Dussud, et al., (2019) found that a lack of rigour during the feasibility stage of a mining project was a major contributor to failure. Of the more than 40 mining projects investigated, only 20% delivered the predicted returns. Dussud et al. state that if, by progressing a feasibility study from 'good' to 'best', 10% additional value can be created, it would translate into additional value of US$100 billion to the industry over the period between 2020 and 2025. One of the findings of Dussud et al. (2020) is that the industry does not use standard criteria for determining project maturity, and the studies therefore fail to ensure a narrow estimate band and predictable outcome. Some standards exist for Resource estimating and reporting, but many other elements are open to interpretation and companies apply their own standards inconsistently. These elements include engineering definition, operational readiness, commodity price predictions, and execution readiness, all of which could change the business case outcome of a project significantly. Some of the remedies for this situation which Dussud et al. propose include:
> Mining companies should set comprehensive standards for a Feasibility Study. They also add 11 criteria which they believe should always form part of a mining Feasibility Study.
> Assumptions during the Feasibility Study must be stress-tested by comparing them with detailed capex and opex benchmarks and then deciding on the correct combination of the two cost components.
This article focuses on the process used to create a project readiness assessment tool that can be utilized to evaluate the maturity and readiness of a mining project study or front-end planning phase. Using such a tool, a mining company can determine if the required rigour has been exercised in the frontend loading and the status of individual elements or the overall study.
Research problem
No generally accepted readiness assessment tool is available for mining projects. To address this shortcoming, a study was undertaken to develop a Readiness Assessment Tool (RAT) for mining projects by researching what constitutes a RAT and how it should incorporate mining elements.
Methodology
The methodology study was based on the approach taken by the Construction Industry Institute (CII) in developing the Project Definition Rating Indexes (PDRIs) for other industries. A PDRI is a readiness assessment tool that measures the level of maturity of several elements, to determine the overall readiness of a project study to proceed into detail design and execution. Since the middle 1990s CII had developed four PDRIs, for building, industrial, infrastructure, and small industrial projects. The development of these PDRI tools included a combination of literature reviews, focus group discussions, workshops, scrutiny of project documentation, and one-on-one discussions with experts (Gibson and Dumont, 1996, p. 21; Cho, Furman, and Gibson, 1999, p. 35; Bingham, 2010, p. 28; Collins, 201, p. 78). Compiling a RAT for mining projects followed the same approach as for the PDRIs.
Figure 2 illustrates the process followed. The first step was to examine the existing literature, both on the CII's PDRIs and on mining projects. The aim was to define specific variables and elements that apply to projects in the mining industry.
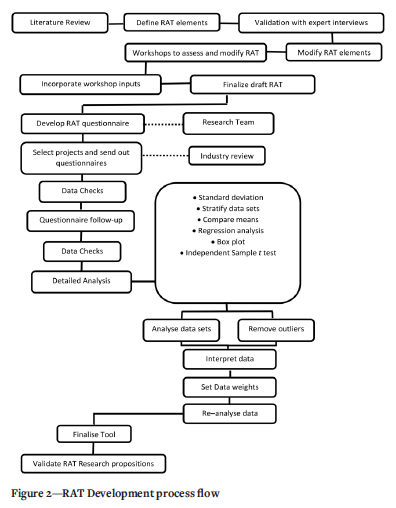
The identified elements were listed and arranged to form a draft, unweighted RAT. This was then used to facilitate discussions, gather inputs, and validate the elements listed, with participation by 66 professionals from three mining companies and five companies involved in design and implementation of projects (EPCMs). A pro-forma, semi-structured questionnaire was drafted, and inputs were obtained via telephonic interviews as well as emails. From these inputs a final list of well-defined, unweighted elements was compiled. During this process the elements were also arranged in sections and categories. Typically, elements that addressed a specific discipline or associated component of a project would be clustered into a category. Several categories would be combined into a section.
The third step in creating the RAT, was to allocate weights to the elements. The unweighted RAT for mining projects was distributed via email to 66 selected mining project professionals, both in mining operations and EPCM companies. The participants were asked to weight and asses the various elements that pertain to the front-end planning phase of mining projects. These role-players were situated mainly in North America, Africa, and Australia. The outcome of this exercise was a weighted RAT for mining projects.
Assigning weights to the individual elements
The final unweighted RAT check-sheet consisted of 180 elements, which were divided into four sections and 18 categories. This check-sheet was used as the basis of the survey to assign weights to the various elements. A literature review was conducted to assign definitions to the various elements. The definitions would be useful in assisting participants in the survey, but also when the tools were completed, as project professionals could use the definitions to avoid any misunderstanding regarding terminology when using the tool.
The four sections which the RAT is divided into are:
I Basis of project Decision
II Project Details
III Design for Construction
IV Execution Approach.
The four sections are further divided into numerous categories. The Basis for Project Decision section is made up of seven categories, The Projects Details section is divided into three categories, the Design for Construction section into three categories, and the Execution Approach section into five categories.
Assigning weights to the elements makes provision for the variance and unequal impact that different elements can have on project definition. For example, elements addressing the quality and quantity of the orebody will be more important than those addressing stormwater drainage. Both elements are important, and should be considered during the study, but if the orebody is not confirmed, the negative effect on the project viability could be more significant than the channelling of stormwater.
To determine the individual element weights, the opinions of experts in mining project management were sought. Due to the geographical spread of individuals with adequate experience in mining projects, it was decided to obtain the inputs via emailed questionnaires. In total, the survey was sent to 66 individuals who had significant experience in mining projects. These individuals represented project managers, engineers, and quantity surveyors working for large mining companies as well as EPCM companies. The email contained instructions on how to complete the questionnaire, as well as the contact details of the researcher, should any instructions be unclear. The unweighted RAT for the mining check-sheet was attached to the email. Instructions on how to complete the questionnaire, along with an example of a completed section, were included. There was also a section to be completed by the participants indicating their number of years of experience, as well as the value of projects in which they had been involved.
Participants were asked to assign two weights to each of the 180 elements. The first weight reflected the amount of contingency (in percentage) if an element has been completely defined during the front-end loading phase. This weight was captured on a blank weighting sheet, under definition level 1. Similarly, participants were asked to assign an amount of contingency (in percentage) if an element had little to no definition. This contingency was entered on the blank weighting sheet under definition level 5. The request that was sent out, along with an example of how to complete the weighting sheet, is depicted in Figure 3.
(a) Consider a typical project in the mining industry. Assume that you have been asked to estimate the project cost just prior to the detail design phase of the project.
(b) Assign a contingency amount to each element. If the element had been completely defined, note the contingency amount under definition level 1.
(c) If little to no definition exists, assign a contingency amount to each element under level 5.
(d) Do not assign contingencies for definition levels 2, 3, and 4, as these will be interpolated.
(e) The contingency should represent the amount of money (as a percentage of total project cost) that would be necessary to offset uncertainties related to project execution.
Participants completed the weighting sheet by assigning weights to definition levels 1 and 5. The inputs from the various parties were normalised, which meant that the data points were all brought within the same range. All the participants used zero as the absolute minimum. Thus, the lower end of the scale was fixed. However, the upper end of the scale varied significantly between the individual participants. To enable the responses to be compared, the individual data-sets had to be normalized to within the same range, between zero and 100. The first step in this process entailed the calculation of individual modifiers for each of the participants. This was done by dividing the largest value used by the participant, into 100. This individual modifier was then multiplied with all the weights assigned to the individual elements, thereby bringing all the responses to within the same range of between zero and 100.
Before the normalized values could be used to calculate the weights of the various elements, it was important to analyse the individual contributions to determine if any of these were skewing the data. This was done by calculating the descriptive statistics of each element, namely the mean, median, standard deviation, variance, and skewness. Further analysis of the data showed that the inputs from some of the participants were skewing the data.
In previous studies (Bingham, 2010, p. 66), box-plots were used to determine the outliers and extremes. A box-plot is a graphical representation of the data and some of the descriptive statistics. A typical box-plot will indicate the data on a vertical or horizontal line. The median of the data, as well as the 25th and 75th percentile values, will be indicated. The difference between the 75th percentile and 25th percentile values is the box length. Outliers and extremes fall outside of the box. These values typically skew data, and the number of such values could be used to determine if only certain data-points, or entire data-sets should be eliminated to ensure that data was not skewed.
For all the elements, the medians, interquartile range, and outlier, and extreme boundaries were calculated. These values were then used to determine the number of outliers and extremes for all data-sets. In total, 66 outliers and six extremes were identified in this manner. To identify individual contributions which could be skewing the results, individual contribution scores were calculated for each participant, using the formula:
Contribution score = 3 x (Number of extremes) + 1 x (Number of outliers)
Those participants with a low contribution score had few or no outliers or extremes in their data-sets and were thus not contributing significantly to skewing the data. Participants with a high contribution score were contributing significantly to skewing the data.
Bingham (2010, p. 67) mentions several options to deal with participants who are identified as skewing the data. These include:
(a) Not removing the data supplied by any participants, by deciding that those contributions were still valid.
(b) Removing the entire contribution (data-set) of those individuals with a very high contribution score.
(c) Keeping all the individual contributions but removing those individual data-points that were skewing the data-sets. This would entail removing outliers and extremesfrom the data-set.
(d) A combination of (b) and (c) above, where the entire contribution of individuals with high contribution scoreswas removed, as well as those individual data-points from other contributors that were outliers or extremes.
(e) Leave the data-points calculated as outliers and remove only those data-points identified as extremes.
It was decided to go with option (d). This meant removing the entire contribution of some individuals who had a high individual contribution score, as well as the extreme and outlier data-points of all other contributors. The input of one individual with an individual contribution score of 39 was removed, as well as a total of 66 outliers and six extremes.
Once the extremes and outliers were dealt with, the final RAT scores for the various elements could be calculated. This was done in two stages. The first stage entailed calculating the final values for all level 5 scores, and in the second stage the values for levels 1 to 4were interpolated.
To calculate the final level 5 scores, the average of all the remaining data-sets had to be calculated. As some data-points had been removed as outliers or extremes, this had to be accounted for when calculating the average weights of the individual elements. To overcome this, the sums of the individual elements were divided by the number of remaining individual data-points, considering that some of the data-points had been removed. On average the upper (definition level 5) value for each element was reduced by 0.6% through this exercise.
At this stage the potential RAT score of any project ranged between 180 (full definition) and 1000 (no definition). The RAT for mining projects could be used to determine the maturity of any single element, category, or section as well as to calculate an overall RAT score, which was an indication of the overall readiness of the project to proceed into detail design and construction. Because the tool would potentially be used by project participants who are familiar with the PDRI tools of the CII, it was decided to bring the potential RAT score to within the limits of 70 and 1000, which is the norm in the PDRIs. This meant that when there is no definition yet to any of the elements, a project study will have a PDRI score of 1000. When all the elements have been completely studied, the PDRI score would be 70. The weighted RAT was adjusted to fit within the range of 1000 and 70 in the following manner: The sum of all level 1 weights was divided by 70. This constant was then multiplied by the level 1 weight of each element. The sum of all the level 5 weights was divided by 1000. This constant was then multiplied by the level 5 weight of each element. Thus the weights were modified to fit between 70 and 1000.
Once the final values for all the level 5 and level 1 scores had been calculated, the values for levels 2, 3, and 4 could be interpolated. This was done by basic interpolation of the data. The result of this process was a weighted RAT for mining projects.
Results
In total, 20 responses were received, of which 18 were used. This equated to a response rate of 27%. The two responses that were not included were not completed in the prescribed manner and therefore the data could not be incorporated in the study. The 18 participants represented a combined experience of 410 years, with projects to the value of R898 billion (US$62.5 billion). The average participant had 20.5 years of experience and averaged a lifetime project value of R44.9 billion (US $3.i3billion).
The final RAT consists of 180 elements, which are divided into four sections and 18 categories. The total of the weights of each section and category, as well as the average weight of each section and category, are depicted in Table II.

The four sections of the RAT for mining projects progress from a high-level more strategic perspective to a project definition to execution level. In section I the project feasibility as well as Resource and Reserve statements carry the highest weighting estimates which is important for the project decision. Section II addresses the detail of the project, with scope definition being allocated the highest weight. It is interesting to note that value improving practices are important in section III which emphasizes the focus on cost-effectiveness during the high capital expenditure stage of construction. The last section, section IV, considers the execution approach,with focus on control being weighted the highest. The detail weightings within each section are provided in Annexure 1.
Conclusions
Determining the readiness of mining projects is critical to project success. Not only should there be good criteria for selecting the right project, but also items and actions that should be given special attention to implement the selected project successfully. Thus far, a generally available project readiness assessment tool has not been available in the literature or, practice, hence the need to develop such a tool for mining projects. The factors that influence success during the front-end phase of a mining project, were determined through a mixed-method research approach whichd included a literature review, as well as workshops and email inputs from industry experts. The final weighted list of 180 elements was collated in four sections covering strategic decision-making to final project execution.
The completed RAT for mining projects can assist professionals in the mining project field in several ways. By presenting a comprehensive, weighted list of elements to be addressed during the front-end phase of a project, it can assist project team members to come to a common understanding of the areas that need to be studied, as well as the relative importance of the various elements. Project teams can use the RAT as a self-assessment tool during any stage of the project study, to identify the areas which require more definition. Teams can also use the RAT to calculate an overall RAT rating at any stage, which will indicate the overall level of readiness of the project to proceed into the next phase.
The RAT can also be used as a predictor of project success, based on the RAT score. By making use of the maturity of each of the 180 elements to determine a single RAT score, the RAT can assist project members, as well as decision-makers such as Boards of Directors, to make informed decisions regarding the approval of projects. The RAT for mining projects can also assist in reducing risk during project execution and improve project team alignment and communication, as it sets at a common framework for the study. By addressing all the above points, the RAT should improve the probability of a successful project.
References
Addison, T. and Roe, A. 2018. Extractive industries: The management of resources as a driver of sustainable development. Oxford Scholarship Online, November 2018. [ Links ]
Bingham, E. 2010. Development of the Project Definition Rating Index (PDRI) for Infrastructure projects. Masters Dissertation, Arizona State University. [ Links ]
Carvalho, F. 2017: Mining industry and sustainable development: time for change. Food and Energy security, vol. 6, no. 2. pp. 61-77. [ Links ]
Cho, C., Furman, J., and Gibson, G. 1999. Development of the Project Definition Rating Index (PDRI) for building projects. University of Texas at Austin. [ Links ]
Collins, W. 2015. Development of the Project Definition Rating Index (PDRI) for small Industrial projects. Arizona State University, Phoenix. [ Links ]
Creamer, M. 2012. Global mining drives 45%-plus of world GDP - Cutifani. http://www.engineeringnews.co.za/article/global-mining-drives-45-plus-of-world-gdp-cutifani-2012-07-04 [accessed 5 May 2016]. [ Links ]
Dussud, M., Kudar, G., Lounsbury, P., Pikul, P., and Rossi, F. 2019. Optimizing mining feasibility studies: The $100 billion opportunity. McKinsey & Company. https://www.mckinsey.com/industries/capital-projects-and-infrastructure/our-insights/optimizing-mining-feasibility-studies-the-100-billion-opportunity [accessed 25 July 2020]. [ Links ]
Ericsson, M. and Lof, O. 2018. Mining's contribution to national economies between 1996 and 2016. Mineral Economics, vol. 32. pp. 223-250. [ Links ]
EY. 2020. Top 10 business risks and opportunities - 2020. https://www.ey.com/en_gl/mining-metals/10-business-risks-facing-mining-and-metals [accessed 25 July 2020]. [ Links ]
Gibson, G. and Dumont, P. 1996. Project definition rating index (PDRI). Research Report 113-11. Construction Industry Institute, University of Texas at Austin. [ Links ]
ICMM. 2016. The role of mining in national economies.3rd edn. International Council on Mining and Metals, p. 3. London. https://www.icmm.com/romine/index [accessed: 15 September 2018]. [ Links ]
Jamasmie, C. 2012. Mining industry could save billions on capital projects - report. http://www.mining.com/mining-industry-could-save-billions-on-capital-projects-report-20976/ [accessed: 21 September 2018]. [ Links ]
McKinsey. 2017. Getting big mining projects right: Lessons from (and for) the industry. Online. Available: https://www.mckinsey.com/industries/metals-and-mining/our-insights/getting-big-mining-projects-right-lessons-from-and-for-the-industry. Accessed 20 July 2020. [ Links ]
McKinsey. 2020. Through-cycle investment in mining. https://www.mckinsey.com/industries/metals-and-mining/our-insights/through-cycle-investment-in-mining. [accessed 20 July 2020]. [ Links ]
Mining Markets. 2014. Why building a mine on budget is so rare. http://www.miningmarkets.ca/news/why-building-a-mine-on-budget-is-so-rare/ [accessed: 16 September 2018]. [ Links ]
Motta, O., Quelhas, O., Filho, J., Franca, S., and Meirino, M. 2014. Megaprojects front-end planning: The case of Brazilian organizations of engineering and construction. American Journal of Industrial and Business Management, vol. 4. pp. 401-412. [ Links ]
PWC. 2018. Mine 2018. Tempting times. http://www.pwc.com/mining. [accessed: 25 July 2020. [ Links ]
PWC. 2019. Mine 2019. Resourcing the future. http://www.pwc.com/mining. [accessed: 25 July 2020]. [ Links ]
Schneider, K. 2017. Massive infrastructure projects are failing at unprecedented rates. National Geographic. https://www.nationalgeographic.com/news/2017/11/mega-projects-fail-infrastructure-energy-dams-nuclear [accessed 15 July 2020]. [ Links ]
ICMM. 2012. The role of mining in national economies.3rd edn. International Council on Mining and Metals, London. https://www.icmm.com/romine/index [accessed: 15 September 2018]. [ Links ]
 Correspondence:
M.C. Bekker
Email: giel.bekker@up.ac.za
Received: 21 Aug. 2021
Revised: 8 Jun. 2022
Accepted: 30 May. 2022
Published: July 2022


