


Services on Demand
Article
 English (pdf)
 Article in xml format
 Article references
Indicators

Related links
-
 Cited by Google
 -
 Similars in Google
Share

 Permalink
Journal of the Southern African Institute of Mining and Metallurgy
On-line version ISSN 2411-9717
Print version ISSN 2225-6253
J. S. Afr. Inst. Min. Metall. vol.122 n.7 Johannesburg Jul. 2022
http://dx.doi.org/10.17159/2411-9717/1403/2022
PROFESSIONAL TECHNICAL AND SCIENTIFIC PAPERS
Optimizing cut-off grade considering grade estimation uncertainty - A case study of Witwatersrand gold-producing areas
C.C. Birch
School of Mining Engineering, University of the Witwatersrand, South Africa
SYNOPSIS
Due to grade estimation uncertainty, two statistical errors can occur. The Type I error is where material is classified as ore and mined, despite the true value being below the break-even grade. This material is dilution. The Type II error is where the material is estimated to be below the cut-off grade and is classified as waste, although the true grade is actually above the break-even grade. This material is not mined and is lost. The uncertainty was assumed to follow a normal distribution in a previous study. For this study, estimated block values are compared to those determined after mining (the best estimate of the true grade). This actual data from four mines shows that the uncertainty follows a Laplace distribution. There is no single solution regarding adjusting the cut-off grade away from the break-even grade, considering estimation uncertainty, that could be applied to all gold mines. However, adjusting the cut-off grade downwards (up to 22% for one mine) is noted when optimizing the profit considering grade uncertainties. This type of adjustment could open up significant mining areas and extend the life of the mine.
Keywords: uncertainty, Type I error, Type II error, cut-off grade, optimization, NPV; simulation, mixed-integer linear programming, @Risk, Excel Solver.
Introduction
This study is a follow-up to a previous investigation (Birch, 2017) in which cut-off grade optimization was undertaken for four South African narrow, tabular (Witwatersrand-type) gold mines while considering various hypothetical degrees of uncertainty. It was found that where there are higher degrees of uncertainty in the grade, reducing the cut-off grade compared to the break-even grade can improve the financial returns. For the present study, the break-even grade is considered the grade where the income from a mining block will cover all its mining and processing costs (as defined by the all-in sustainable cost (AISC)). The management team uses the cut-off grade to determine the areas to be mined or left and effectively split ore from waste. This study considers the actual grade uncertainty for four South African gold mines. Each case study determines how the cut-off grades should be adjusted compared to the break-even grade when taking grade uncertainties into account.
Background
Some mining companies apply the concept of break-even grade to individual ore blocks and assess if each block could be exploited profitably. This break-even grade is then applied as the mining cut-off grade (Minnitt, 2004) with some adjustments. With these approaches, the overall grade of the material being mined becomes the average grade of the blocks above the break-even-derived cut-off grade. An alternative approach is to apply the pay limit principle where the overall mining grade required to break even financially is determined. Then the profit margin required is determined and added to the breakeven grade. The mining planners then check the mix of the various mining areas to ensure the required mining grade is achieved.
However, these approaches fail to consider the interaction between the royalties for mineral resources and the South African gold tax formula, which varies considering the mine's overall profitability. A revised approach to optimizing the value of gold mines was required as part of a research project to understand the impact of the 2008 Mineral and Petroleum Resources Royalty Act on gold mines (Birch, 2016a). Considering the mine's current planned economic and production profile, this approach considers the entire cash flow and optimizes overall profit or net present value (NPV) for the Measured and Indicated Resource. The financial optimizer uses mixed-integer linear programming (Excel Solver) to maximize profit or net present value NPV by varying the cut-off grade. This, in turn, alters the overall tonnage and average mining grade (AMG) above the cut-off grade. The approach is simple, robust, and provides a valuable tool to quickly assess the impact of grade uncertainty without the need for extensive information from the mines themselves (Birch, 2016b).
The grade for each mining block is estimated by sampling the mineral deposit and projecting the values into the area to be evaluated. Various techniques are used, including nearest neighbour, inverse distance squared, and kriging. The estimated value is used to determine if a mining block is classified as ore or waste. There is, however, a degree of uncertainty regarding the estimated value due to sampling spacing, deposit heterogeneity, and the method of estimation used.
Accepting a hypothesis that should have been rejected is a Type I error in statistics. The alternative error is rejecting a hypothesis that should have been accepted, and is called a Type II error (Underhill and Bradfield, 1994). Due to uncertainty in the estimation, the same two errors can occur. The Type I error is where the material is classified as ore and mined, although the true value is below the cut-off grade and thus this is waste material and constitutes dilution. The Type II error is where the material is estimated to be below the cut-off grade and is classified as waste, whereas the true grade is above the break-even grade and it could have contributed profits if it had been mined. This material is not mined and is lost (Minnitt, 2017).
Problem statement
High uncertainties characterize mining projects. Such uncertainties vary in magnitude and are very prevalent in the geological data and subsequent grade estimation on which the project is based. The method of handling uncertainty in mining projects may significantly affect the decisions made by the management team (Kühn and Visser, 2014). There is no straightforward process for adjusting the cut-off grade away from the break-even grade for narrow tabular orebodies, considering the uncertainties related to the grade estimation.
Previous work
A previous investigation (Birch, 2017) aimed to determine what adjustment should be made to the cut-off grade to reduce the financial impact of dilution or lost ore in typical narrow, tabular Witwatersrand gold mines. Three possible options were identified:
> Raise the cut-off grade to reduce the dilution - 'the old adage that a low-grade ton should never keep a high-grade ton out of the mill' (Minnitt, 2017) > Keep cut-off grades the same, considering that the Type I and Type II errors would balance each other if there is no bias
> Lower cut-off grades to ensure all value from the orebody is obtained (thus recovering a higher percentage of the lost ore). The mines reviewed all have mining block listings. These listings include the area (m2), channel width (cm), and the estimated in-situ grade in grams per ton (g/t). The tonnage and stoping width can be determined from these values, along with the mining grade and expected metal content. South African gold mine block listings were run through a simple financial optimizer for the previous study. Various degrees of uncertainty for the block grades were considered. This uncertainty was introduced using @Risk software (a Monte Carlo simulation program developed by Palisade). The uncertainty distribution was assumed to be symmetrical, and no bias was considered (100% block factor). The databases used for this research exercise had been corrected for conditional bias and smoothing (Tolmay, 2014). The uncertainty dispersion was controlled using the standard deviation to give 5%, 6.7%, 10%, and 20% uncertainty.
The following points were noted.
> It was found that when optimizing for profit, three of the four mines would benefit from a reduction in the cut-off grade compared to the break-even grade.
> This reduction ranged from 2-10%. The fourth mine would not benefit from any change in the cut-off grade.
> When optimizing for 9% NPV, three of the four mines would benefit from reducing the cut-off grade by between 7 and 27%. The fourth mine would benefit by increasing the cut-off grade by 7%.
> When optimizing the NPV at 12%, the one mine would benefit from an 8% decrease in the cut-off grade. The NPV benefit is, however, only 1.3%. The other three mines would not benefit from adjusting the cut-off grades and using the model results in NPVs lower than not adjusting them, as indicated in two cases.
The previous study assumed that the uncertainty follows a normal distribution, and there is no bias present in the estimations. This research uses 'actual' uncertainty distributions to determine if the same conclusions can be drawn.
Methodology
The mining block listing is the starting point for the financial model used for this study. This mining block listing contains all potential mining areas, estimated grades, and volumes created from the geological block model. For South African gold mines, the mining blocks are the same size as the geological blocks (typically 30 m by 30 m for the Measured Resource blocks and 60 m by 60 m for the Indicated Resource blocks).
The determination of the break-even grade is, in essence, quite simple. It determines what grade a unit of ore requires to return a profit. This is basically a break-even volume measurement where the quantity is known (usually limited due to shaft capacity, milling capacity, or other physical constraints). The unknown is the commodity's in-situ value. The other factors needed for the calculation of the break-even grade are the mine recovery factor (MRF), which is the mine call factor (MCF) multiplied by the plant recovery factor (PRF). The metal price is quoted in US dollars (for gold and silver, in troy ounces). These are all projections and open to variation over the time over which the break-even grade is applied. Therefore, they contribute to the investors' financial risk if they change significantly. This can be expressed as follows (School of Mining Engineering, 2021): At break-even grade:
TR = TFC +TVC
but
TR = UR* X
and
TVC = UVC * X
Therefore:
UR * X = TFC + UVC * X
Dividing both sides by X:
UR =(TFC+X + UVC But
UR = g/t * r * p
Therefore at break-even grade (g/t):
g/t = ((TFC-X) + UVC>(r*p)
where g/t is the break-even grade in grams per ton; r is the mine recovery factor in %; p is the metal price in US$ per gram; TFC is the total fixed costs in US$; X is the milled tons; and UVC is the unit variable costs in US$ per t.
The cut-off grade is an extension of the concept of a breakeven grade. If only blocks above break-even grade are mined, this becomes the cut-off grade. However, the cut-off grade undergoes variations over the mine's life. Hall (2014) describes the basics of cut-off grade theory. This book is an exhaustive study of the different techniques currently used in the mining industry. It includes various value measures, including discounted cash flow (DCF) and optimization of NPV. The South African Code for the Reporting of Mineral Asset Valuation (The SAMVAL Code) income approach to valuation requires a mine design with reasonable estimates of expected tonnages, grades, costs (fixed and variable), and recoveries (Border, 1991).
The cost of capital is usually calculated by the weighted average capital cost (WACC) and is expressed as a percentage. The WACC represents a company's average cost of capital from all sources. These include equities (common stock, preferred stock, and bonds) and other forms of debt. The cost of equity can be determined using various methods, including the capital asset pricing model (CAPM) and the Gordon growth model (GGM) (School of Mining Engineering, 2021). The cost of capital of the mine is used as the discount rate for cash inflows and outflows. The NPV is the difference between the present value of cash inflows and the present value of cash outflows over a period of time (Investopedia, 2021). Real monetary mining discount rates of between 9% and 12% are suitable for South African mining projects (Smith et al., 2007). That is equivalent in nominal terms to 14.5% to 17.6% at an annual inflation rate of 5% (typical for South Africa).
The financial optimizer used for this study utilizes linear mixed-integer (Excel Solver) programming. Due to its availability to all Excel users, the Solver function built into Microsoft Excel was selected for this study (Meissner and Nguyen, 2014). The variable for the Solver function is the cut-off grade, and the Solver function is set to optimize the cut-off grade to maximize the resulting profit or NPV. These cut-off grades are then compared to the base break-even grade to indicate how the cut-off grades should be adjusted considering the uncertainty in the estimated in-situ grades.
Sources of data
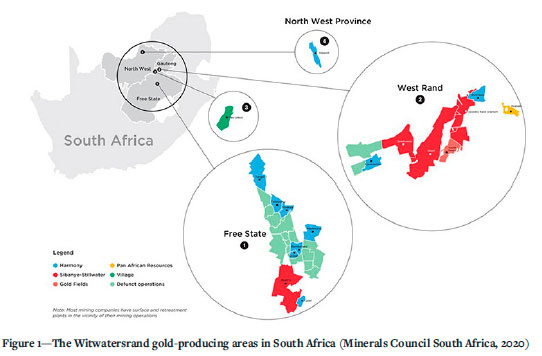
Historical mining block listings were obtained from four gold mines for this study. The mines are located in the West Rand and the Free State gold mining regions of South Africa (Figure 1). They all mine the narrow, tabular gold-bearing conglomerates of the Witwatersrand Supergroup. For anonymity purposes, these mines will be called A, B, C, and D. It is important to note that these are not the mines that were used in the previous study. The data for the previous research was for four individual shafts belonging to two different mines. The data used for that study was the block listing and financial information used for the mines' Mineral Resource Statements.
Accompanying the historical block grades for the mined-out areas is the post-mining grade for the block. This grade is considered the 'true' grade. Although it is still an estimate it is the figure used by the mine surveyor to allocate the called-for grade for the block. Discrepancies between the called-for gold estimates and the final recovered gold are dealt with in the break-even formula where the MRF is considered. The distribution of the uncertainties was based on these listings. They display a significantly different pattern from the normal distribution assumed for the previous study (Birch, 2017), and significant grade overestimation bias in three cases.
The relationship between the volume (tons) available for mining and the cut-off grade, and the resulting average grade above the cut-off grade, can be determined from the gradetonnage curve.
A generic financial model has been utilized to compare a typical deep-level gold mine producing 1.2 Mt of ore per annum. A generic financial model has been used to highlight the effect of the uncertainty and allow direct comparisons as to the effect of this between the different mines. A gold price of US$ 1500 per ounce is assumed for this case study. For all the examples, annual fixed costs are assumed to be US$260 million, and the variable cost is US$55 per ton. The split between fixed and variable costs is 75:25. A feature of South African gold mines is that labour costs are typically 50% (Savant, 2012) of the total costs, resulting in a higher fixed cost to variable cost ratio than more typical mining projects where a 50/50 split would be appropriate (Poxleitner, 2016). The annual production rate and 75% MRF have been selected to give a break-even grade of 7.5 g/t. Break-even face grades of 7.5 g/t are typical for deep-level South African gold mines and fit into the break-even grades determined from the detailed financial figures used in the previous study (6.9-10 g/t). The NPVs were determined using discount rates of 9 and 12%.
Analysis
Estimated versus true block grades
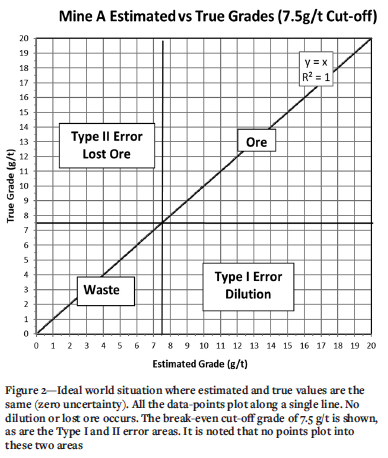
The approximate value for one mining block and the true value will be the same in a perfect world. There will be no blocks above the cut-off grade with a true value below the cut-off grade (Type I error or dilution). There will also be no blocks calculated as below cut-off grade that are actually above cut-off grade (Type II error or missing ore). This ideal relationship can be seen in Figure 2.
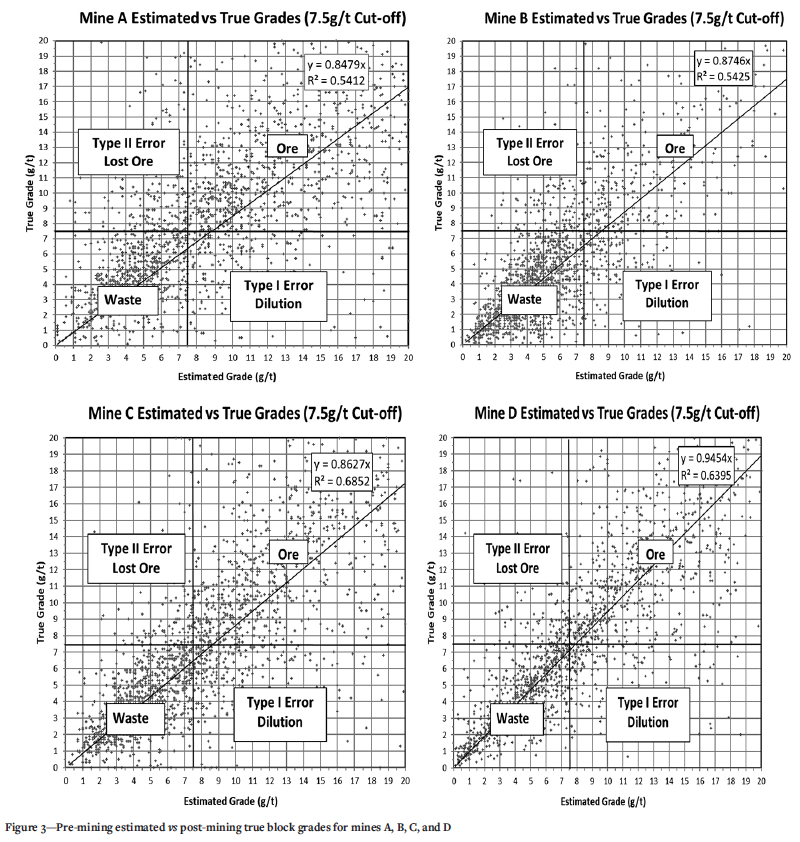
The pre-mining estimated and post-mining true block grades were obtained from four mines for this study. The number of blocks included in the analysis ranged from 1757 to 2547 for the respective mines. The estimated grades vs the true grades for the four mines are shown in Figure 3.
It can be observed that there is significant overvaluation in the estimated block grades for three of the mines. This is reflected in the slope of the trend lines. For mine A, the slope is 0.85. For mine B it is 0.87, and for mine C it is 0.86. This is significant because it shows a clear bias in the estimation, which was not considered in the previous study (Birch, 2017). For mine D, the bias is far less, and the slope is 0.95. This overestimation of the block grades has a marked impact on the suggested cut-off grade optimization adjustments shown later in the analysis. The R2 values for the four mines range from 0.54 to 0.69. This shows a significant spread of the data-points and a poor correlation between the estimated and true values. A perfect correlation would result in an R2 value of 1.0 (see Figure 2). This poor correlation results in numerous points plotting in the graphs' Type I (dilution) and Type II (lost ore) areas.
Variation distribution
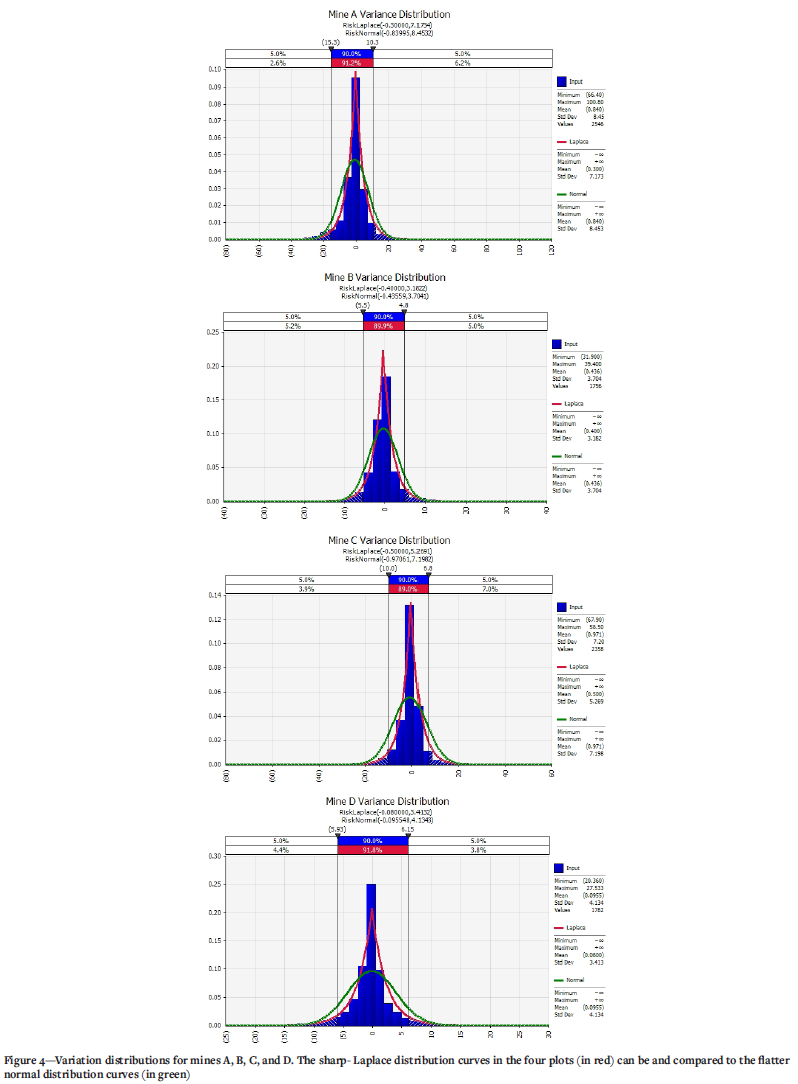
The difference between the estimated and true grades for each block was determined. The distribution of these variations is analysed using the Palisade @Risk Distribution Fit tool. For the previous study, normal distributions with no bias were assumed. When the variation distributions for the four mines in this study were analysed, Laplace distributions were found to fit better than normal distributions. In probability theory and statistics, the Laplace distribution is a continuous distribution of probabilities, called the double exponential distribution. It can be viewed as two exponential distributions spliced together back to back (Hilali,
The distribution which best fits the data was selected using the Akaike information criterion (AIC) value. AIC compares the relative 'quality' of a model (distribution) with the other models. @Risk ranks the various distribution model outputs according to this value. The distribution with the smallest AIC value is usually the preferred model (BPI Consulting, 2016). Figure 4 shows the Laplace and normal distribution curves for the four mines.
It is clear from the figures that the Laplace distribution curve for the variation has a far higher kurtosis (the sharpness of the peak) than the normal distribution curve in all four examples. However, the normal curve reflects the mean variation of the input data better. It shows that the grades for mines A, B, and C are over-estimated by 0.8, 0.4, and 1.0 g/t, respectively. Only mine D has an overall variation of less than 0.1 g/t. Over- or underestimation is often reflected in the block factor value, with 100% indicating no bias. These block factors were found to be 94.3%, 93.2%, 92.4%, and 99.0%, respectively for the four mines.
This overestimation of the block grades is very significant. Many blocks are being identified as ore while they are sub-economic and should not be mined. Suppose the overestimation is carried through to the post-mining true grade estimation for the blocks. In that case, the MCF will also be lower than expected. The MCF is used in the break-even grade calculation. This will raise the break-even grade.
Financial modelling
The tons above the cut-off grade and the AMG are determined from the block listing as inputs into the financial optimizer. The block lists obtained for these mines only contained the gold grades in centimetre-grams/ton (cmg/t). Since the block listing did not include block area, channel width, or stoping width, various assumptions have been made. These assumptions are assumed not to impact the validity of this study because they do not alter the comparative nature of the results. The same assumptions have been made for all four financial models used in the current study.
Some companies model accumulation value (cmg/t) rather than grade (g/t). Accumulation value is helpful for very narrow orebodies because it gives the metal content, rather than just the grade, over the mineralized width. The accumulation value is calculated by multiplying the grade of the sample by the width the sample represents. Multiple samples are taken and composited when sampling narrow tabular orebodies to get the average grade over the mineralized width. Each sample grade is multiplied by the width (in centimetres), and then all the individual values are summed. This combined value is then the value in cmg/t. This value can then be divided by the expected mining width, and the average mining face grade of the block determined. A 1000 cmg/t over 1 m will result in a face grade of 10 g/t. It is possible then to compare the metal content with a very narrow 1 cm mineralized zone with 1000 g/t (for example, the carbon-rich facies of the Basal Reef) to one with a 100 cm mineralized width with a grade of 10 g/t. Both faces will have the same mining face grade of 10 g/t if the minimum mining width is 100 cm. However, since this parameter is not widely used except on South African gold mines, it has been converted to grams per ton for easy explanation. The expected face grade for this study was determined for each block by dividing the cmg/t by a standard stoping width of 150 cm to get the face grade in grams per ton.
This block area needs to exceed the smallest mining unit size determined by the mine design approach. Typical mining panels in deep-level South African gold mines are 30 m long.
The block sizes have been standardized at 30 x 30 m (also the Measured Mineral Resource block size). The specific gravity of the quartzitic conglomerate ores on these mines is typically 2.72, which has been used to determine the tonnage for each block. The other parameters used for financial modelling were described previously.
This study developed a model that can be optimized for either profit or NPV. Optimizing NPV can drive decision-making to focus on short-term gains at the expense of the longer term. Therefore, companies frequently use the total undiscounted cash flow (Hall, 2014). All four mines' financial models were run using zero (undiscounted profit), 9%, and 12% discount rates. This is consistent with the previous study, which used the same discount rates. The NPV cut-off grade is higher than when optimized for profit. The NPV optimization model favours high-grading mining because of the discounting. This leads to a shorter mine life and lower mineral resource extraction (Birch, 2016b).
The optimized cut-off grade obtained from the financial optimizer excludes the estimated cost of the mineral resource royalty ( South Africa, 2008) and income tax calculated using the South African gold tax formula ( South Africa, 2019). The purpose of excluding these financial liabilities from the model is to consider profitability when determining the rate. Including these in the model creates interesting interplays between the optimal cut-off grade and these variable costs. This is the subject of further research by the author. This interplay adds a layer that is distracting from the purpose of this particular research project, which is studying the role of uncertainty in optimizing the cut-off grade.
The financial optimizer uses mixed-integer linear programming (Excel Solver). The Solver feature is built into Microsoft Excel. It was selected for this study due to its availability to all users of Excel (Meissner and Nguyen, 2014). Solver can be used to determine an optimal value (maximum or minimum) for a formula in a target cell that is constrained or limited by the values of other formula cells in a worksheet. Solver adjusts the values in the decision variable cell (the cut-off grade) to fulfil the constraint bounds of the cell and provide the desired result for the target cell (the profit or NPV) (Microsoft, 2022).
Solver uses three algorithms (Microsoft, 2022):
> Generalized reduced gradient (GRG) nonlinear (for problems that are smooth nonlinear)
> LP Simplex (for problems that are linear)
> Evolutionary (for problems that are non-smooth).
It has been found for the financial optimizer model that although the evolutionary approach is the slowest, it is the most reliable. The GRG approach gives inconstant results, often not changing the initial value input for the cut-off grade. The LP Simplex approach has not been tested because the nature of the model is not considered linear.
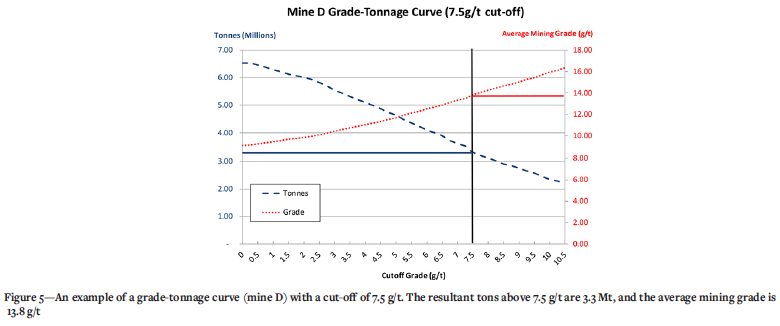
The financial optimizer determines the tonnage above the cut-off grade and the AMG from the block listing sheet. The MRF and ratio between stope tonnage and total milled tonnage are obtained from the mines' ore flow sheets. These values form the primary inputs into the cash flow sheet, along with the production rate, metal price, and mining costs. As Solver's cut-off grade varies, the tonnage above the cut-off grade and AMG inputs change to maximize the target selected (profit or NPV). This relationship is shown in Figure 5.
Mine D has been selected to demonstrate the grade-tonnage curve (Figure 5). This is due to mine D demonstrating block factors closest to 100% among the four mines included in this study.
A grade-tonnage curve can be used to visually display the tons above the cut-off grade and the average mining grade of the blocks above the cut-off grade. A vertical line drawn at the cut-off grade will intersect both the tonnage and grade curves. A horizontal line drawn from the tonnage curve to the tonnage axis (the left side in this case) will indicate the tons above the cut-off grade (3.3 Mt in this case). These tons can be used as the tons available for the financial model. A horizontal line drawn from the intersection point with the grade curve to the grade axis (right side) will indicate the average grade of all the blocks above the cut-off grade (13.8 g/t in this case). This can then be used as the AMG for the financial optimization model.
Results and discussion
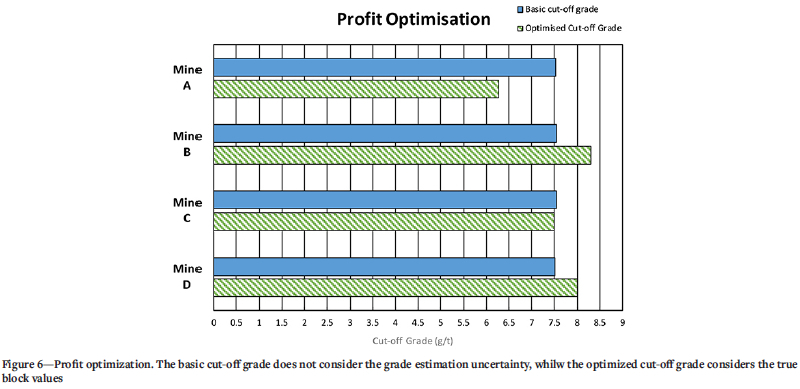
Overall bias not considered
The model was set to replace the pre-mining estimated block value with the post-mining true value for each block. The Solver function was then run to optimize the cut-off grade. This exercise was run considering both optimization for profit (zero NPV) and NPV at 9% and 12%. Figure 6 displays how the cut-off grade for each of the four mines varies when considering the uncertainty of the block values when optimized for profit (zero NPV).
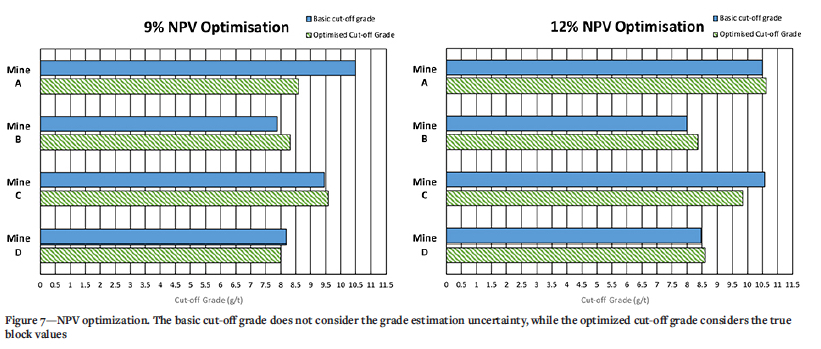
It can be observed that only mine A shows a decrease in the cut-off grade when the grade uncertainty is considered. In the previous study, the overall tendency was that the cut-off grade when optimizing for profit is lower than the unoptimized break-even grade when uncertainty is considered. Figure 7 shows the cut-off grade graphs optimized for 9% and 12% NPV.
The following can be noted.
> Both the basic and grade estimate uncertainty-optimized cut-off grades are higher than the break-even cut-off grade of 7.5 g/t, which is expected when optimizing for either 9% or 12% NPV.
> The same trend as seen in the profit optimization is observed in the 9% NPV cut-off grade optimization.
> Only mine A shows that a significantly reduced cut-off grade is beneficial.
> For the 12% NPV optimization considering grade uncertainty, mine C shows a reduction in the cut-off grade, while the other three mines show an increase in the cut-off grade is preferable.
These trends indicate that the bias in the pre-mining block estimation grades is significant and alters the previous study's findings.
Overall bias considered
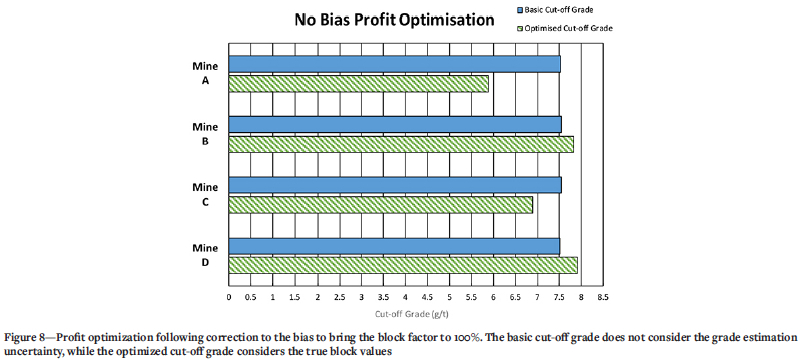
Mines A, B, and C had block factors significantly below 100% at 94.3, 93.2, and 92.4%. Only mine D has a block factor close to 100%, at 99.0%. The distribution model used in the previous study to determine each model's true grades assumed a block factor of 100%. Considering this study's initial optimization exercise results, the impact of the overall bias in the estimated block grades needed to be considered.
Whether to mine a block or not is based on the estimated grade. Suppose the overall tendency is to overestimate the block grades. In that case, more blocks will be considered ore than is actually the case (Type I error), which will add to the dilution. Mines should constantly consider their block factor and adjust their evaluation parameters to reduce this bias. If the same technique is used to evaluate the blocks post-mining, this will reflect an apparent loss when determining the mine call factor (de Jager, 1997).
The planned block grade is adjusted to bring the block factor to 100% to correct this bias. This correction was applied to all four mines. The model then selects the blocks based on this adjusted planned grade rather than the originally planned grades. For the profit optimization, the results indicate that two of the four mines (mines A and C) would benefit from a significant downward adjustment in the cut-off grade from the break-even grade of 7.5 g/t (Figure 8).
The following is noted.
> The reduction in cut-off grade is 22% and 9%, respectively, for mines A and C.
> The other two mines (B and D) would require a 4-5% increase in cut-off grade.
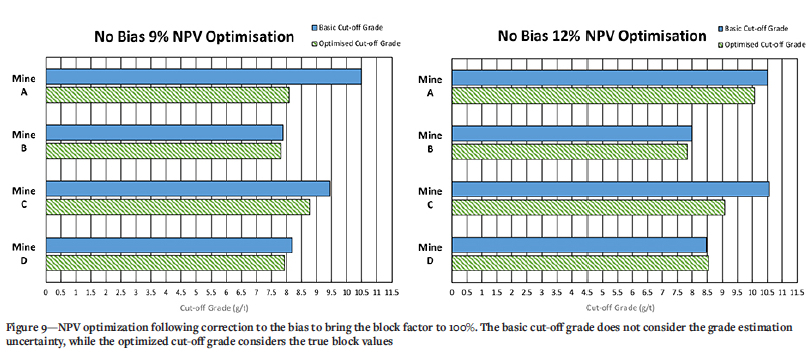
For the exercise where the optimization maximizes the NPV, the overall tendency is to reduce the cut-off grade from the cut-off grade obtained without considering the uncertainty. This is shown in Figure 9.
The following is noted.
> The indicated cut-off grade reduction for 9% NPV is 23% for mine A and 7% for mine C.
> The reductions for mines B and D are minor at 1% and 3%, respectively.
> For the 12% NPV, the indicated cut-off grade reduction for mines A and C is 4% and 14%, while for mine B there should be a 2% reduction.
> No adjustment is suggested for mine D.
Conclusion and recommendations
The previous study (Birch, 2017) assumed a normal distribution with no bias for establishing the grade uncertainty. This study uses real data from four South African gold mines to establish whether the assumptions and results from the previous research are valid.
The true data indicates in all four cases that the distribution curve of the uncertainty of the grade estimation follows a Laplace rather than a normal curve. This 'double exponential' curve displays far greater kurtosis than a normal curve with tails extending further.
In three of the four case studies, there is a significant bias. This is displayed by block factors below 95%, indicating an overestimation in the estimated grades. The initial financial optimization exercise indicated that reducing the cut-off grade was preferable in a single case for the profit optimization and mixed results for the NPV optimization cases. This is contrary to the previous study (where the optimization model indicated a cutoff grade reduction was always preferable for profit optimization and generally preferable for NPV optimization). In the previous research the variances had no bias, and it was felt that the bias was altering the trends. The bias was corrected to bring the block factors for all four to 100%, and the exercise was repeated.
When optimizing for profit, two of the four cut-off grade optimization models suggest a reduced cut-off grade by up to 22% from the break-even grade when considering grade uncertainty. However, no reduction was indicated for the other two mines, and a slight increase (4-5%) is suggested. With the 9% NPV model, the data from all the mines suggests that reducing the cut-off grade is preferable. This reduction varied significantly from 1-23%. This trend was also observed following the 12% NPV exercise, with reductions between 2-14% in three mines. For the fourth mine, no reduction in the cut-off grade is suggested.
It is recommended that all mines focus on their block factors and other evaluation parameters to ensure no overall bias in the block estimations. This bias could also be carried through to estimate the mined grades (the true grade) and will result in gold being called for that does not exist. This apparent loss will mean an increase in cut-off grades.
Once the bias is corrected, running a financial optimization exercise similar to this one, considering the grade uncertainty, could unlock value by reducing the number of lost blocks. The value of the lost blocks appears to be higher than the mining losses incurred by mining more un-pay blocks by reducing the cutoff grades. However, every orebody has a unique grade-tonnage characteristic and financial circumstances. No single solution could be applied to all gold mines, and the optimization strategy (profit or NPV) also affects the outcome.
References
Birch, C. 2016a. Impact of the South African mineral resource royalty on cut-off grades for narrow, tabular Witwatersrand gold deposits. Journal of the Southern African Institute of Mining and Metallurgy, vol. 116, no. 3. doi: 10.17159/2411-9717/2016/v116n3a4 [ Links ]
Birch, C. 2016b. Impact of discount rates on cut-off grades for narrow tabular gold deposits. Journal of the Southern African Institute of Mining and Metallurgy, vol. 116, no. 2. doi: 10.17159/2411-9717/2016/v116n2a2 [ Links ]
Birch, C. 2017. Optimization of cut-off grades considering grade uncertainty in narrow, tabular gold deposits. Journal of the Southern African Institute of Mining and Metallurgy, vol. 117, no. 2. pp. 149-156. doi: 10.17159/2411-9717/2017M17n2a6. [ Links ]
Border, S. 1991. Optimisation of cut-off grades during design of underground mines. Proceedings of the Mining Industry Optimisation Conference, Sydney. Australasian Institute of Mining and Metallurgy, Melbourne. [ Links ]
BPI Consulting. 2016. Deciding which distribution fits your data best. https://www.spcforexcel.com/knowledge/basic-statistics/deciding-which-distribution-fits-your-data-best [accessed 8 April 2020]. [ Links ]
De Jager, E. 1997. The analysis of the mine call factor in gold mining, with specific reference to Western Holding Mine. PhD thesis, University of the Witwatersrand. http://sierra-eds.wits.ac.za/iii/encore/record/C_Rb1382121_SDeJager,Ernst Jakobus__Orightresult__X4?lang=eng&suite=def [accessed 10 April 2020]. [ Links ]
Hall, B. 2014. Cut-off Grades and Optimising the Strategic Mine Plan. Spectrum, S. (ed.). Australasian Institute of Mining and Metallurgy, Carlton. Victoria, Australia. [ Links ]
Hilali, H. 2016. Laplace-distribution. https://www.coursehero.com/file/18659563/Laplace-distribution/ [accessed 8 April 2020]. [ Links ]
Investopedia. 2021. Net present value (NPV) definition. https://www.investopedia.com/terms/n/npv.asp [accessed 22 January 2022]. [ Links ]
Kuhn, C. and Visser, J.K. 2014. Managing uncertainty in typical mining project studies. South African Journal of Industrial Engineering, vol. 25, no. 2. pp. 105-120. doi: 10.7166/25-2-800 [ Links ]
Meissner, J. and Nguyen, T. 2014. An introduction to spreadsheet optimization using Excel Solver. http://www.meiss.com/download/Spreadsheet-Optimization-Solver.pdf [accessed 19 March 2020]. [ Links ]
Microsoft. 2022. Define and solve a problem by using Solver. https://support.microsoft.com/en-us/office/define-and-solve-a-problem-by-using-solver-5d1a388f-079d-43ac-a7eb-f63e45925040 [accessed 22 January 2022]. [ Links ]
Minerals Council South Africa. 2020. Gold. https://www.mineralscouncil.org.za/sa-mining/gold [accessed 19 March 2020]. [ Links ]
Minnitt, R.C.A. 2004. Cut-off grade determination for the maximum value of a small wits-type gold mining operation. Journal of the South African Institute of Mining and Metallurgy, vol. 104, no. 5. pp. 277-283. [ Links ]
Minnitt, R.C.A. 2017. Poor sampling, grade distribution, and financial outcomes. Journal of the Southern African Institute of Mining and Metallurgy, vol. 117, no. 2. pp. 109-117. doi: 10.17159/2411-9717/2017/v117n2a2 [ Links ]
Poxleitner, G. 2016. Operating costs for mines. SRK Consulting (Canada). https://www.srk.com/sites/default/files/file/GPoxleitner_OperatingCostEstimationForMiners_2016.pdf. [ Links ]
Savant, R. 2012. Overview of mining costs. CPM Group. Brooklyn, NY. http://www.goldconvention.in/iigc2012/presentation/CPMGroupOverviewofMiningCostsRS.pdf. [ Links ]
School of Mining Engineering. 2021. MINN7092A Course Notes. University of the Witwatersrand. [ Links ]
Smith, G.L., Pearson-Taylor, J., Anderson, D.C., and Marsh, A.M. 2007. Project valuations, capital investment and strategic alignment. Journal of the Southern African Institute of Mining and Metallurgy, vol. 107, no. 1. pp. 67-74. https://journals.co.za/content/saimm/107/1/AJA0038223X_3255 [accessed 4 November 2019]. [ Links ]
South Africa. 2008. Mineral and Petroleum Resources Royalty Act 28 of 2008. Government Gazette. 521:13. [ Links ]
South Africa. 2019. Guide for Tax Rates/Duties/Levies (Issue 14). South African Revenue Service, Pretoria. https://www.sars.gov.za [accessed 15 October 2019]. [ Links ]
Tolmay, L. 2014. On the reduction of algorithmic smoothing of kriged estimates. Journal of the Southern African Institute of Mining and Metallurgy, vol. 114, no. 8. pp. 667-672. https://www.saimm.co.za/Journal/v114n08p667.pdf [accessed 17 March 2020]. [ Links ]
Underhill, L. and Bradfield, D. 1994. IntroSTAT 5.0. Juta & Co., Kenwyn, Cape Town. [ Links ]
 Correspondence:
C.C. Birch
Email: clinton.birch@wits.ac.za
Received: 13 Oct. 2020
Revised: 16 May 2022
Accepted: 16 May 2022
Published: July 2022

